Let me remind everyone that intermediate cycle lows (ICL), and especially yearly cycle lows in the metals are always hard to hold onto. Even if you catch the exact bottom, they usually resist for a week or more and try to shake everyone off. The metals bottom differently than the stock market. When stocks form an ICL they rocket launch straight up. Traders get instant gratification and a market that quickly moves away from their stop. Gold on the other hand forms much more difficult bottoms. It will usually churn back and forth for a week or longer as traders try to decide whether or not a bottom is forming. Its during this churn, and especially after a destructive bloodbath phase, that traders can rationalize any number of reasons to get knocked off the bull no matter how good the setup is. Understandably after witnessing a devastating bloodbath phase traders are nervous and skittish that the drop is going to continue.
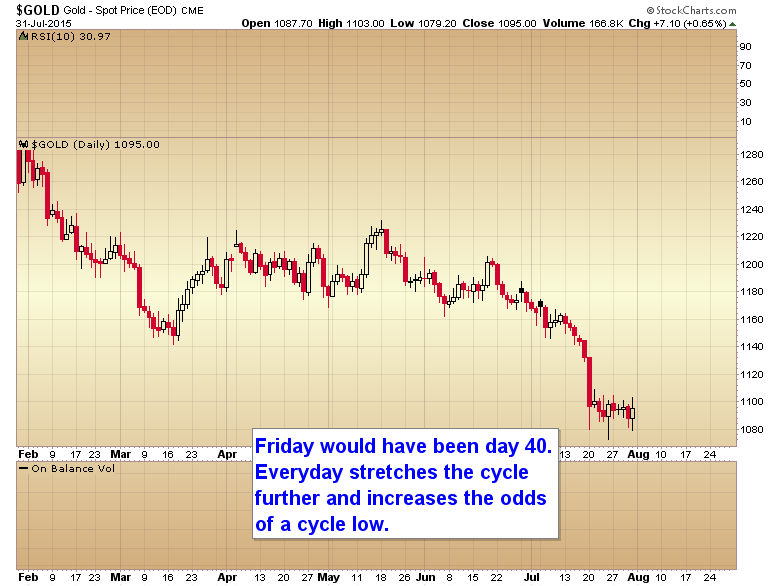
For gold to continue down next week we would have to count a daily cycle that has moved into the 40+ day range (average is 25-35 days). That seems unlikely to me, so I think the odds are better that we put in a daily cycle low a week ago last Friday, and Monday will be day 6 of a new cycle. That being said here is what bothers me.
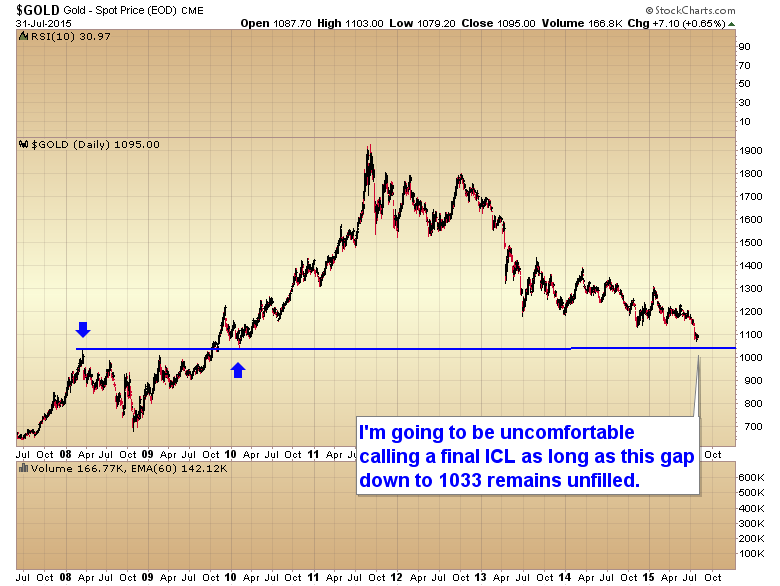
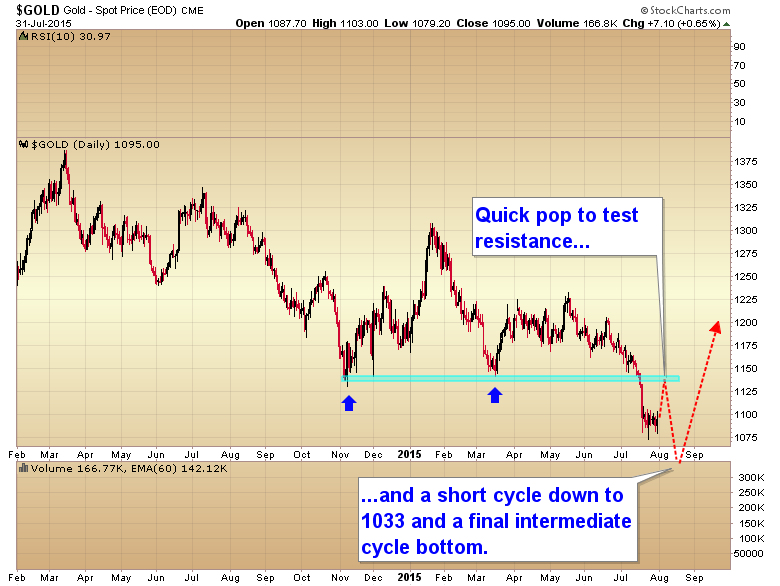
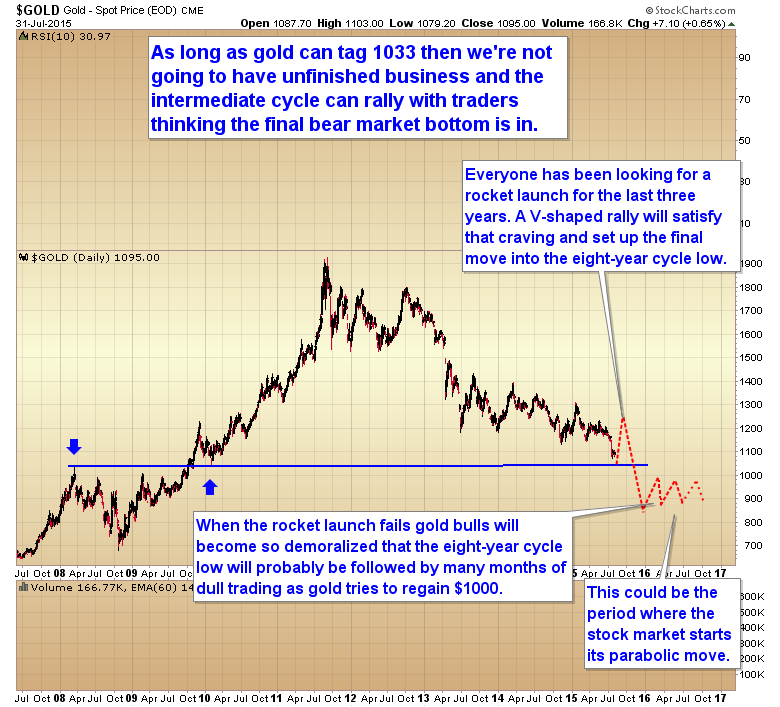
Im going to be uncomfortable calling a final intermediate cycle that bottoms this close to that major support zone at 1033 without completing the move. I would just rather not have that gap hanging over the market. Its going to act like a magnet trying to draw gold backed down. Obviously the cleanest scenario would be for gold to just give us a quick spike down early next week and tag 1033 to be done with it. I daresay everyone will freak out if that happens, but like I said I just dont like the odds of the current daily cycle continuing to stretch past 40 days. So here is a possible scenario: Gold gives us a 4 or 5 day spurt up to the 1130 range and a daily cycle top around next weeks employment report, to be followed by a short cycle down that fills the gap and tags that 1033 support zone for a final intermediate, and possibly yearly cycle low.
Once we tag 1033 then I think the market will be set up for the rocket launch type event that every gold bug has been hoping and praying for over the last four years. Ill say this though, with as much damage as has been done to this sector I seriously doubt the bear is going to end with a rocket launch type event. Sentiment in the sector is too bleak and no one trusts the metals anymore. More likely in my opinion this intermediate rally will get everyones hopes up, especially if it makes a higher intermediate high, only to completely destroy sentiment when gold rolls over and makes a lower low at the 8 YCL. Assuming Im correct and gold retests the 1980 breakout at 850 Im pretty sure the bottoming pattern will be a multi-month dull sideways churn as gold tries to regain the $1000 level rather than a rocket launch that immediately heads towards $2000 like all of the gold gurus have been predicting for the last three years. This could be the period where stocks start their parabolic bubble phase.
So Im expecting the impending rally out of the ICL to be the last really good shot at making big percentage gains in a short period of time for quite a while in this sector.
Here are the factors signaling that an intermediate degree bottom is close. The setup rarely gets much better than this.
The COT is at bullish levels last seen at the 2001 low. The commercials are on the verge of turning net positive. That is something that has only happened a handful of times in history. Notice the Blees rating has been at a maximum bullish level of 100 for two weeks now.

Sentiment levels are at extremes only seen one other time in the last 15 years.
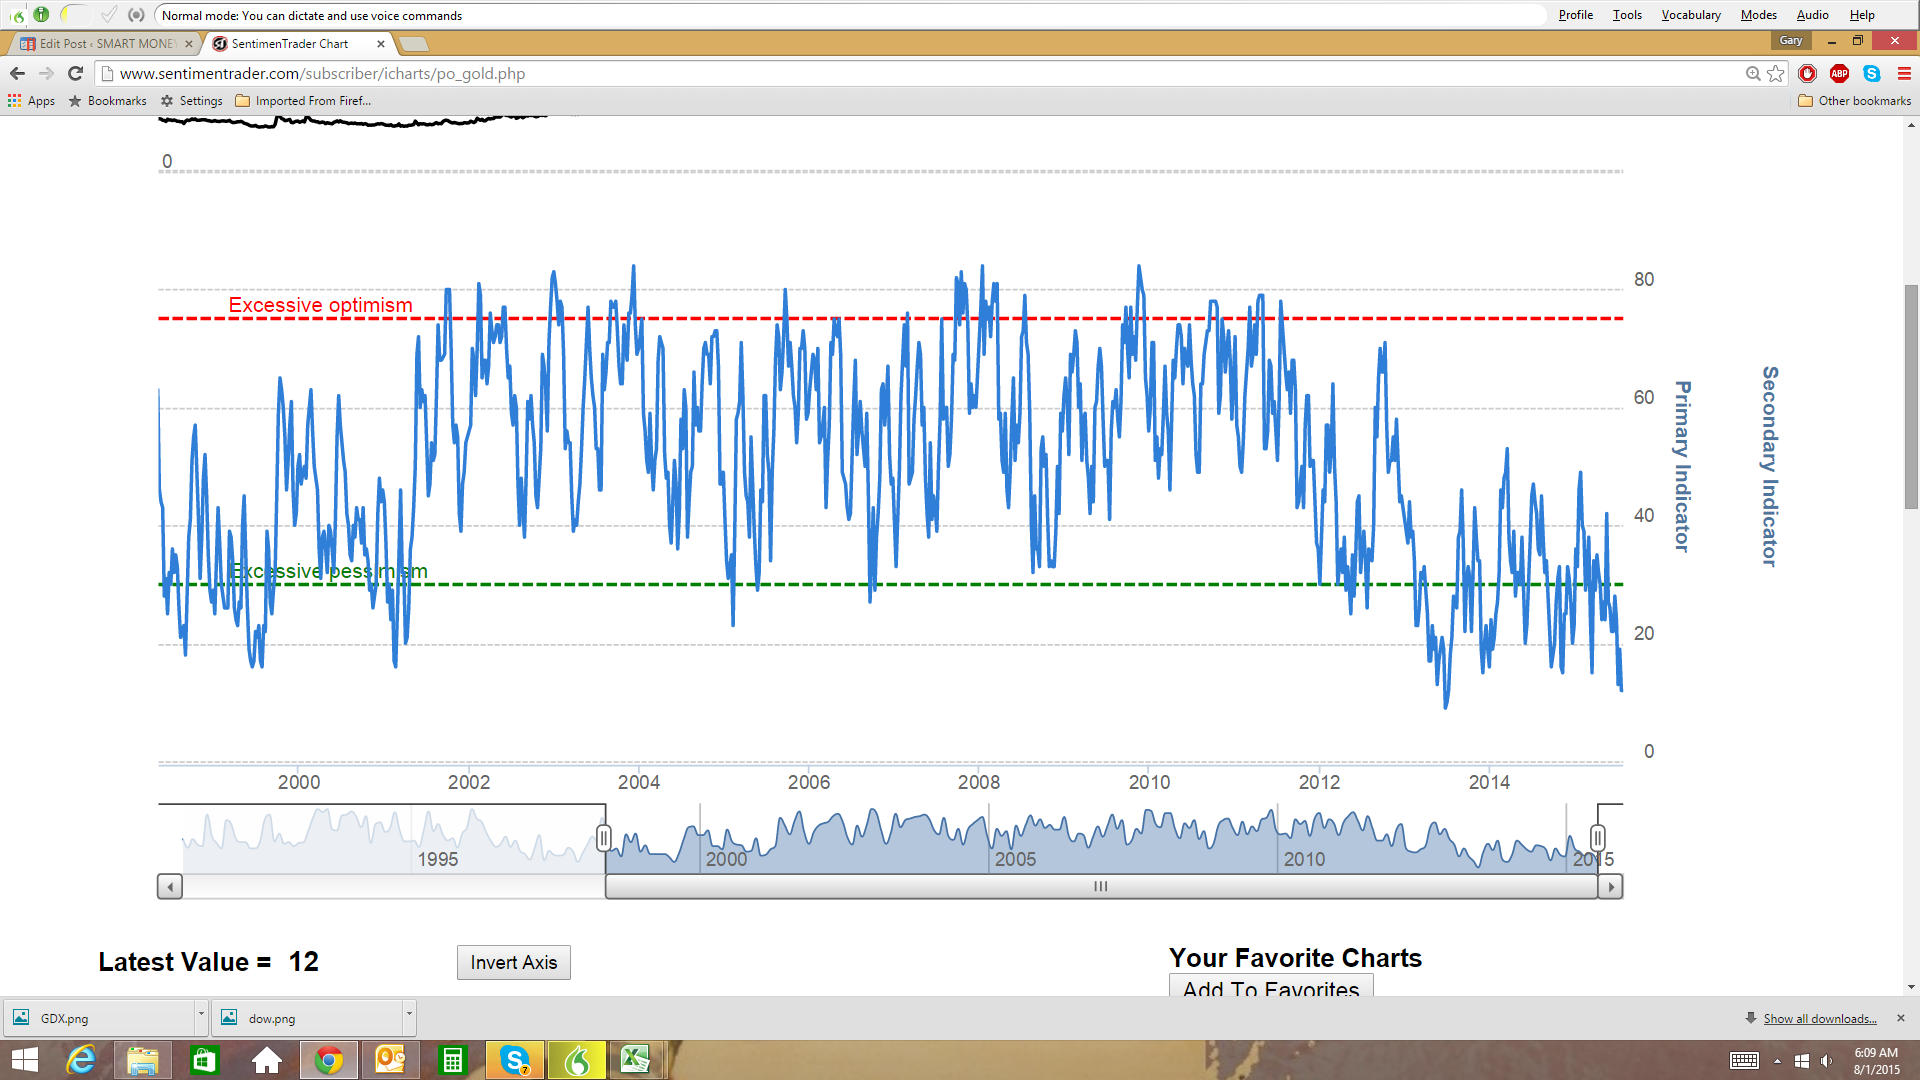
Source: sentimentrader.com
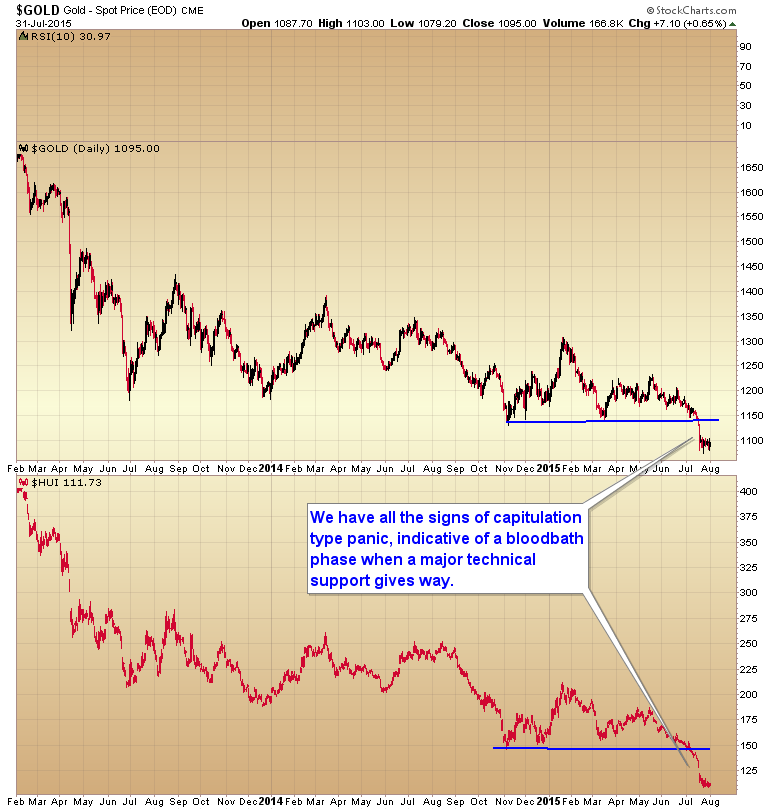
A clear bloodbath phase has been generated. Remember a bloodbath phase generally occurs during the last 5-7 days of an intermediate decline. It is an acceleration of selling as longs begin to panic when a major technical support level gives way.
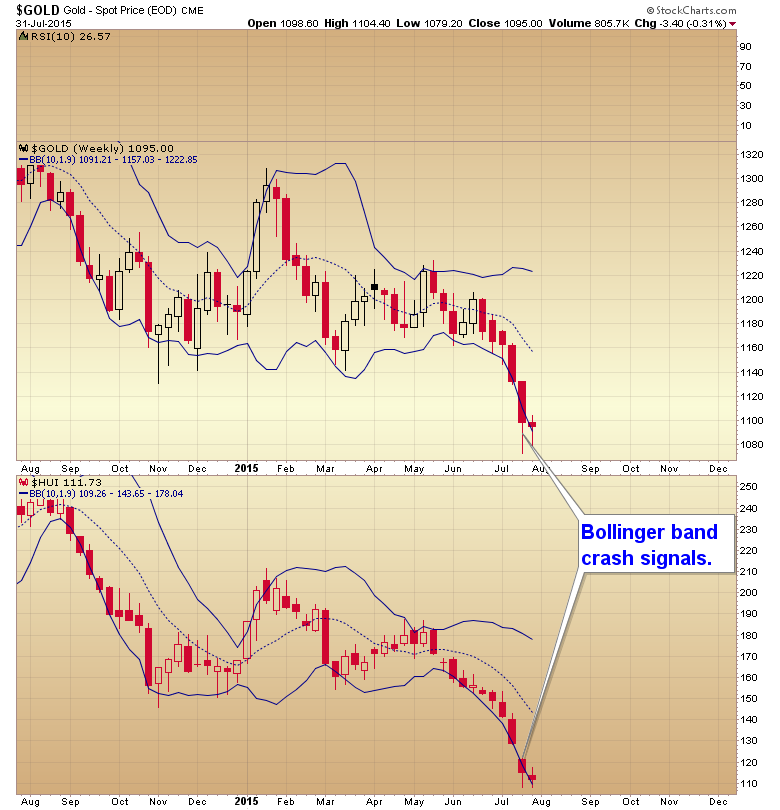
Bollinger band crash trades have signaled on not only the daily charts, but also the weekly charts.
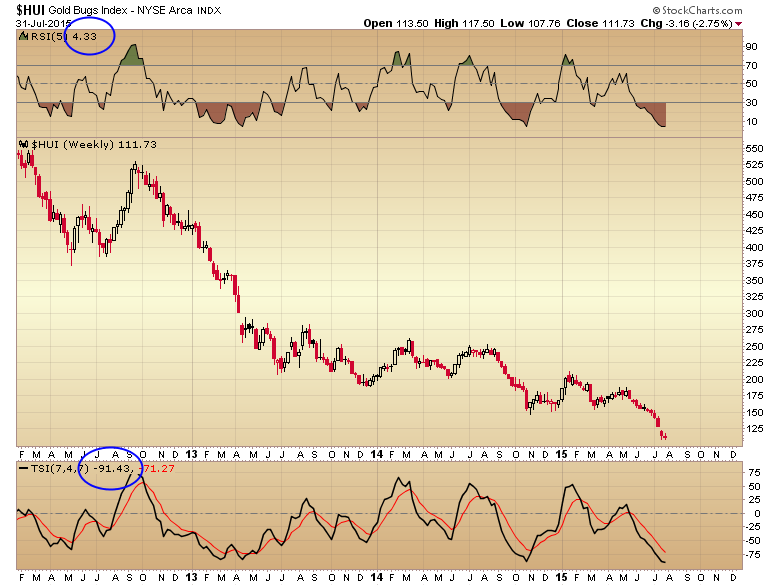
Oversold levels as extreme or worse than any other point in this bear market, especially in mining stocks.
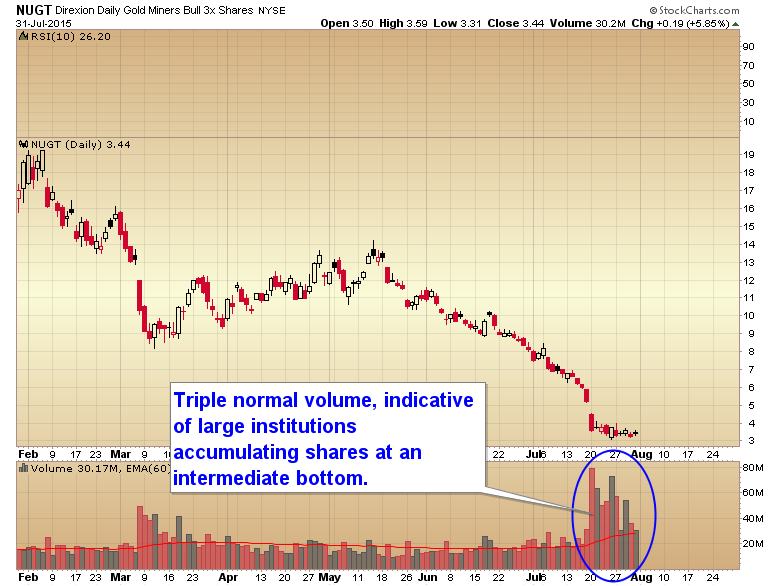
Huge volume up days in the triple leveraged mining ETF indicative of institutional traders entering large positions at an intermediate cycle low.
Stretched daily cycle.
When you add it all up, its exceedingly rare that you ever get a set up this strong for a contrarian trade.
As a matter of fact the only negative I can see in this entire set up is that gap down to 1033 still acting like a magnet trying to finish off the decline. At this point, this late in the cycle, if its going to get there, then its going to do it as a flash crash and premarket attack over one or two days. Otherwise were going to need to see another daily cycle that bounces up to the 1130 level and then rolls over for two or three weeks to tag that final support zone at 1033.
Of course there is always the possiblity that gold formed an intermediate bottom a week ago and any shorts that are still waiting for a tag of 1033 before they cover are about to get caught in a powerful short squeeze. A tag of 1033 would have to wait until the next ICL later this winter if this scenario plays out.

No matter how the next week plays out, whether gold formed a final intermediate bottom a week ago, or whether it still has to finish the move to 1033 first, gold and especially mining stocks are at a level that should deliver some nice gains during the impending bear market rally. Most traders are obsessing over whether gold still has further to drop, when they should be focusing on the bigger picture and at least starting to accumulate shares for the impending rally out of an intermediate cycle low and move back above the 50 day moving average. As a matter of fact I expect the rally to be powerful enough to push the weekly stochastics back to overbought levels
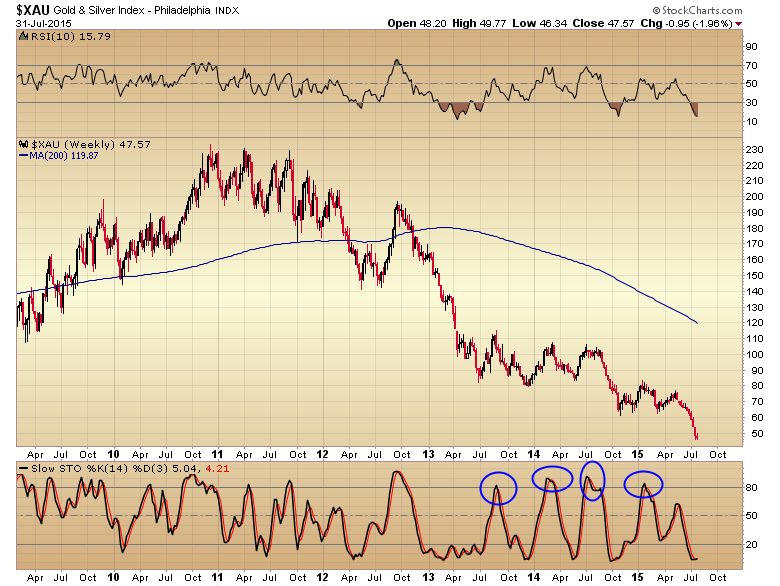
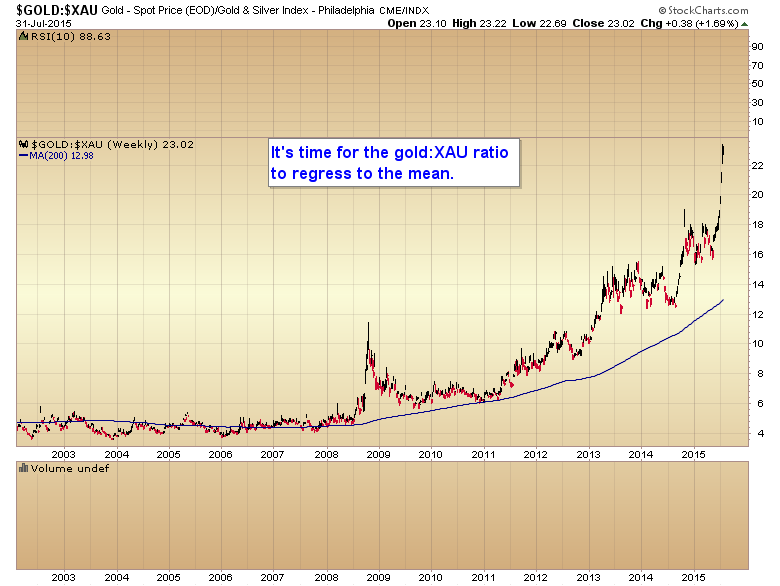
and mean revert the gold:XAU ratio at least back to 16-17.