-- Published: Monday, 10 August 2015 | Print | Disqus
By Frank Holmes
CEO and Chief Investment Officer
U.S. Global Investors
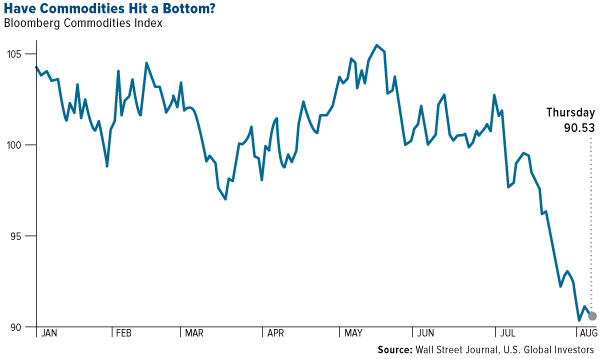
Theres no other way to put it: Commodities took it on the chin last month.
July was the seventh worst performing month for the S&P Goldman Sachs Commodities Index, going back to January 1970. Crude oil saw its steepest monthly loss since October 2008. Both copper and aluminum touched their lowest levels in six years. And on July 19, possibly as a result of deliberate price manipulation, gold experienced a mini flash crash, sending it down to five-year lows.
click to enlarge
Regardless, several commodities are beating the exchange-traded funds that track them for the one-year period, according to the Wall Street Journal. Our Gold and Precious Metals Fund (USERX) is over 1,900 basis points ahead of the Market Vectors Gold Miners ETF (GDX) year-to-date.
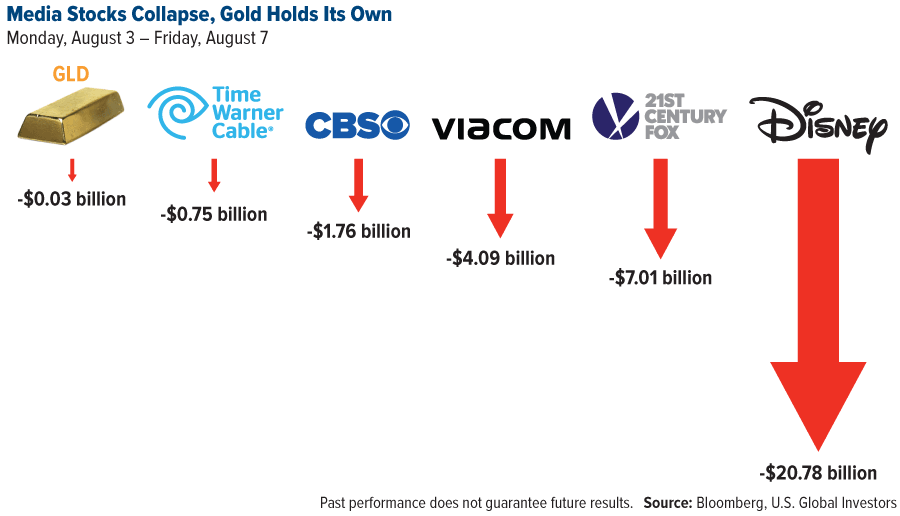
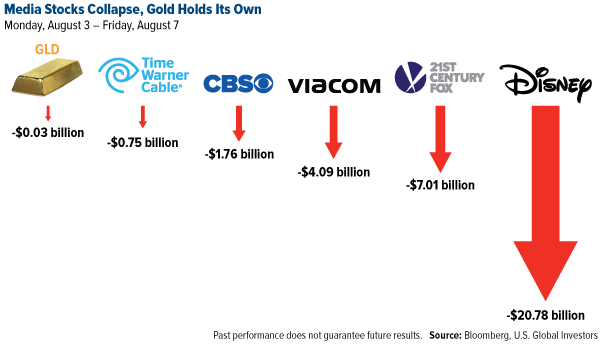
But that hasnt stopped many gold bears from using this as an opportunity to disparage the yellow metal. A recent Bloomberg article points out that the gold rout has cost China and Russia $5.4 billion, an amount that would sound colossal were it not for the fact that U.S. media companies such as Disney and Viacom collectively lost over $60 billion for shareholders in as little as two days last week.
Below are the weekly losses for just a handful of those companies. Compared to many other asset classes, gold has held up well, even after factoring in its price decline.
click to enlarge
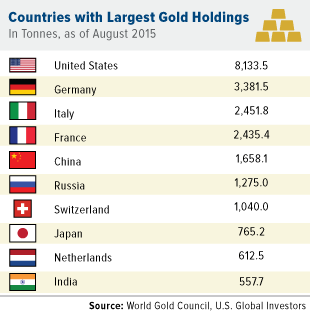
And isnt it funny that the Federal Reserve doesnt keep other countries currencies, but it continues to hold goldand in larger amounts than any other central bank? China and Russia have two of the biggest gold reserves in the worldand have added to them recentlybut they dont come close to the Feds holdings, even when combined. Whats more, the U.S. Treasurys Office of the Comptroller of the Currency just classified gold as money by placing gold futures in the foreign exchange derivatives classification.
Indeed, central banks all over the world continue to add to their gold reserves. If the metal were as valueless as a pet rock, as one Wall Street Journal op-ed recently claimed, why would they bother to do this? A few weeks ago, China disclosed the amount of gold its central bank holds for the first time in six years. Global markets reacted negatively that the country increased its reserves only 57 percent. But the World Gold Council (WGC) saw this as positive news:
We believe the Peoples Bank of Chinas confirmation of its revised gold holdings is supportive for the gold market. It reiterates how China, along with other central banks, views gold as a key resource asset as it continues to seek diversification away from the U.S. dollar.
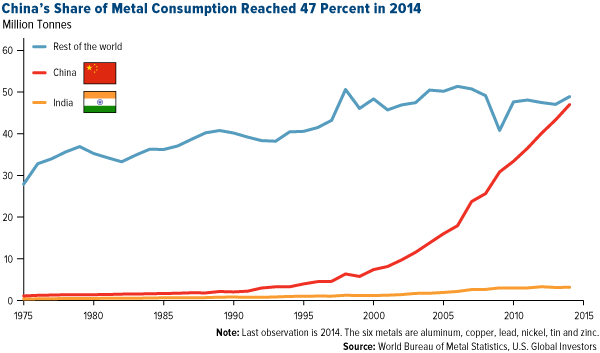
As Ive said before, China is the 800-pound commodities gorilla. This has largely been the case since 2000.
Half a Trillion Dollars a Year in Commodities
Between 2002 and 2012, China was growing fast at an average annual pace of around 10 percent. The country was responsible for nearly all of the net increase in global metals consumption between 2000 and 2014, according to the World Bank. Over the same time period, its share of metals consumption tripled, eventually reaching an astounding 47 percent.
click to enlarge
The year 2014 was a standout for Chinese commodity imports. Compelled by low prices, the country, which accounted for 12 percent of worldwide imports, brought in record volumes of crude oil, iron ore, copper and other raw materials.
Because China is a trading partner with practically every other country, and because it imports over $500 billion a year in commodities, its importance in global trade cannot be stressed enough. BBVA Research writes that any reduction in its level of [purchasing] activity places significant downward pressure on the prices of [commodities], such as oil or copper.
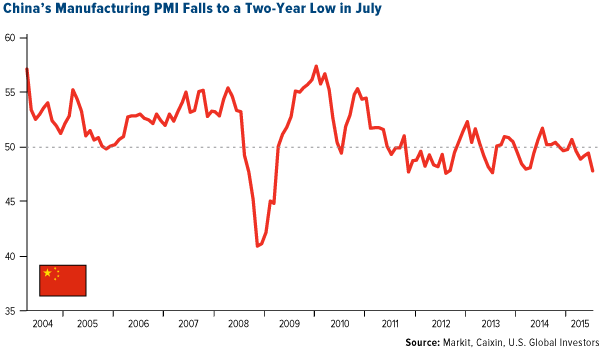
And yet were seeing that reduction now. For the past five months, Chinas purchasing managers index (PMI) has remained below the neutral 50 mark, indicating that its manufacturing sector has been in contraction mode for the better part of this year so far.
click to enlarge
Its important to keep in mind that China is still the number one importer of many key materials, including coal, iron ore and crude oil. The countrys import growth of these commodities continues to rise, but at a slower pace than in years past.
This isnt necessarily the case with gold, however.
Demand Still Higher Than the Five-Year Average
According to the WGC, the decline in Chinese gold demand has been overstated.
Although Chinas jewelry demand in the first quarter of 2015 was down from the record level the previous year, it was 27 percent higher than its five-year average. And consumer demandjewelry plus bar and coinsin the first quarter was the fourth best on record, surpassed only by the surge in demand triggered by the price fall in 2013.
The WGC also points out that gold has a low correlation with and different demand drivers than commodities. Whereas commodities, as expressed by the Bloomberg Commodities Index, have returned to 2001 levels, gold is still up significantly for the period shown in the chart below.
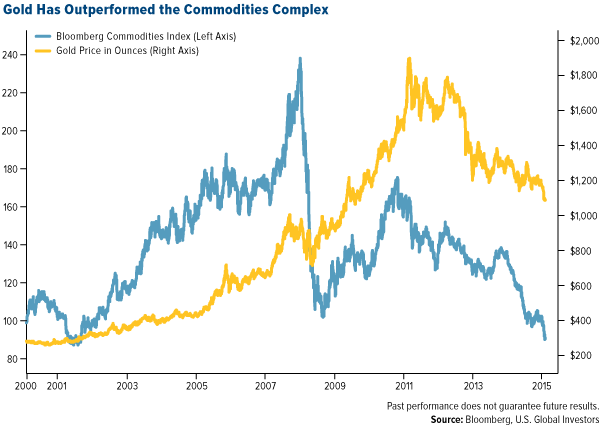
click to enlarge
As many of you know, I call golds drivers the Fear Trade and the Love Trade. I recently had the pleasure to describe these drivers to Mike Gleason of Money Metals Exchange.
The Fear Trade, dominant in the psyche of North America, involves money supply growth and real interest rates. Whenever the U.S. has negative real interest rates, gold starts to rise in dollar terms, and whenever we have positive real rates of return, it starts to decline. If you go back to 2011, we had negative real interest rates off 3 percent on a 10-year government bond, and the average gold price that year was around $1,500 per ounce. But now that rates are positive 2 percent, the metals been depressed.
The Love Trade includes the purchase of the precious metal due to cultural affinity and rising GDP per capita in Asia and the Middle East. This includes gift giving of bullion and gold jewelry in anticipation of upcoming festivals such as Diwali, Christmas and the Chinese New Year. Historically, the Love Trade has begun to pick up around this time of the year.
Gold is a long-term investment with long-standing tradition. This remains true even now that prices have declined. As always, I recommend a 10 percent weighting: 5 percent in gold stocks, 5 percent in bullion or jewelry, then rebalance every year.
Please consider carefully a funds investment objectives, risks, charges and expenses. For this and other important information, obtain a fund prospectus by visiting www.usfunds.com or by calling 1-800-US-FUNDS (1-800-873-8637). Read it carefully before investing. Distributed by U.S. Global Brokerage, Inc.
Total Annualized Returns as of 6/30/2015:| Fund | One-Year | Five-Year | Ten-Year | Gross Expense Ratio | Expense Cap (or) Expense Ratio After Waivers |
|---|
| Gold and Precious Metals Fund | -28.42% | -15.80% | 1.62% | 1.97% | 1.90% |
| Market Vectors Gold Miners ETF | -32.35% | -18.76% | n/a | 0.53% | 0.53% |
Expense ratios as stated in the most recent prospectus. The expense cap is a voluntary limit on total fund operating expenses (exclusive of any acquired fund fees and expenses, performance fees, extraordinary expenses, taxes, brokerage commissions and interest) that U.S. Global Investors, Inc. can modify or terminate at any time, which may lower a funds yield or return. Performance data quoted above is historical. Past performance is no guarantee of future results. Results reflect the reinvestment of dividends and other earnings. For a portion of periods, the fund had expense limitations, without which returns would have been lower. Current performance may be higher or lower than the performance data quoted. The principal value and investment return of an investment will fluctuate so that your shares, when redeemed, may be worth more or less than their original cost. Performance does not include the effect of any direct fees described in the funds prospectus (e.g., short-term trading fees of 0.05%) which, if applicable, would lower your total returns. Performance quoted for periods of one year or less is cumulative and not annualized. Obtain performance data current to the most recent month-end at www.usfunds.com or 1-800-US-FUNDS.
For information regarding the investment objectives, strategies, liquidity, risks, expenses and fees of the Market Vectors Gold Miners ETF, please refer to that fund's prospectus.
Gold, precious metals, and precious minerals funds may be susceptible to adverse economic, political or regulatory developments due to concentrating in a single theme. The prices of gold, precious metals, and precious minerals are subject to substantial price fluctuations over short periods of time and may be affected by unpredicted international monetary and political policies. We suggest investing no more than 5% to 10% of your portfolio in these sectors.
The Purchasing Managers Index is an indicator of the economic health of the manufacturing sector. The PMI index is based on five major indicators: new orders, inventory levels, production, supplier deliveries and the employment environment.
The S&P GSCI Spot index tracks the price of the nearby futures contracts for a basket of commodities.
The Bloomberg Commodity Index is a broadly diversified commodity price index that tracks the prices of futures contracts on physical commodity on the commodity market. It currently has 22 commodity futures in seven sectors.
M1 Money Supply includes funds that are readily accessible for spending.
Fund portfolios are actively managed, and holdings may change daily. Holdings are reported as of the most recent quarter-end. Holdings in the Gold and Precious Metals Fund as a percentage of net assets as of 6/30/2015: Market Vectors Gold Miners ETF 0.00%, The Walt Disney Co. 0.00%, Viacom Inc. 0.00%, 21st Century Fox 0.00%, Time Warner Inc. 0.00%, CBS Corporation 0.00%.
All opinions expressed and data provided are subject to change without notice. Some of these opinions may not be appropriate to every investor. By clicking the link(s) above, you will be directed to a third-party website(s). U.S. Global Investors does not endorse all information supplied by this/these website(s) and is not responsible for its/their content.
| Digg This Article
-- Published: Monday, 10 August 2015 | E-Mail | Print | Source: GoldSeek.com