The global deflationary wave we have been tracking since last fall is picking up steam. This is the natural and unavoidable aftereffect of a global liquidity bubble brought to you courtesy of the world’s main central banks. What goes up must come down -- and that's especially true for the world's many poorly-constructed financial bubbles, built out of nothing more than gauzy narratives and inflated with hopium.
What this means is that the traditional summer lull in financial markets has turned August into an unusually active and interesting month. August, it appears, is the new October.
Markets are quite possibly in crash mode right now, although events are unfolding so quickly – currency spikes, equity sell offs, emerging market routs and dislocations, and commodity declines - that it’s hard to tell for sure. However, that’s usually the case right before and during big market declines.
Before you read any further, you probably should be made aware that, at Peak Prosperity, our market outlook has been one of extreme caution for several years. We never bought into so-called "recovery" because much of it was purely statistical in nature, and had to rely on heavily distorted and tortured 'statistics' to be believed. Okay, lies is probably a more accurate term in many cases.
Further, most of the gains in financial assets engineered by the central banks were false and destined to burst because they were based on bubble psychology, not actual returns.
Which bubbles you ask? There are almost too many to track. But here are the main ones:
- Corporate bond bubble
- Corporate earnings bubble
- Junk bond bubble
- Sovereign debt bubble
- Equity bubbles in various markets (US, China) and sectors (Tech, Biotech, Energy)
- Real estate bubbles, especially in the commodity exporting countries
- Central bank credibility bubble (perhaps the largest and most dangerous of them all)
What’s the one thing that binds all of these bubbles together? Central bank money printing.
Passing The Baton
Operating in collusion, the world's major central banks passed the liquidity baton back and forth between them, first from the US to Japan, then from Japan to Europe, then back to the US, then over to Europe again where it now resides. Seemingly endless rounds of QE that didn’t always do what they were supposed to do, and plenty of things they were not intended to do.
The purpose of printing up trillions and trillions of dollars (supposedly) was to create economic growth, drive down unemployment, and stoke moderate inflation. On those fronts, the results have been dismal, horrible, and ineffective, respectively.
However, the results weren’t all dismal. Big banks reaped windfall profits while heaping record bonuses on themselves for being at the front of the Fed’s feeding trough. The über-wealthy enjoyed the largest increase in wealth gains in recorded history, and governments were able to borrow more and more money at cheaper and cheaper rates allowing them to deficit spend at extreme levels.
But all of that partying at the top is going to have huge costs for ‘the little people’ when the bill comes due. And it always comes due. Money printing is fake wealth; it causes bubbles, and when bubbles burst there’s only one question that has to be answered: Who’s going to eat the losses?
The poor populace of Greece is just now discovering that it collectively is responsible for paying for the mistakes of a small number of French and German banks, aided by the collusion of Goldman Sachs, in hiding the true state of Greek debt-to-GDP using sophisticated off-balance sheet derivative shenanigans. As a direct result, the people of Greece are in the process of losing their airports, ports, and electrical distribution and phone networks to ‘private investors’ -- mainly foreigners harvesting the last cash-generating assets the Greeks have left to their names.
Broken Markets
As we’ve detailed repeatedly, our “markets” no longer resemble markets. They are so distorted, both by central bank policy and technologically-driven cheating, that they no longer really qualify as legitimate markets. Therefore we’ve taken to putting double quote marks around the word “”market”” often when we use it. That’s how bad they’ve become.
Where normal markets are a place for legitimate price discovery, todays “”markets”” are a place where computers battle each other over scraps in the blink of an eye, ‘investors’ hinge their decisions based on what the Fed might or might not do next, and rationalizations are trotted out by the media for why inexplicable market price movements make sense.
Instead, we view the “”markets”” as increasingly the playgrounds of, by and for the gigantic market-controlling firms whose technology and market information have created one of the most lopsided playing fields in our lifetimes.
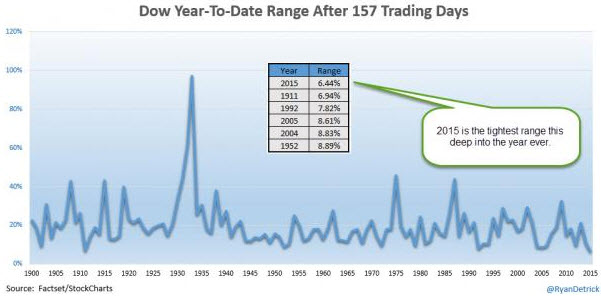
Signs of these distortions abound. One completely odd chart is this one, showing that the average trading range of the Dow (ytd) was the lowest in history as of last week (before this week’s market turmoil hit). And that was despite Greece, China, QE, Japan, oil’s slump, Ukraine, Syria, Iran and all of the other ample market-disturbing news:
(Source)
Based on the above chart, you’d think that 2015 up through mid-August was the most serene year of the last 120 years. Of course, it's been anything but serene.
The explanation for this locked-in trading range is a combination of ultra-low trading volume and the rise of the machines. There have been times recently when practically 100% of market volume was just machines playing against each other…no actual investors (i.e, humans) were involved.
As long as there was ample liquidity, then the machines were content to just play ping pong with the “”market””. Which they did, crossing the S&P 500 over the 2,100 line 13 times before the recent sell-off took hold.
But that’s not the most concerning part about having broken markets. The most concerning thing centers on the fact that things that should never, ever happen in true markets are happening in todays “”markets”” all the time.
One measure of this is how many standard deviations (std dev) an event is away from the mean. For example, if the price of a financial asset moves an average of 1% per year, with a std dev of 0.25 %, then it would be slightly unusual for it to 2%, or 3%. However it would be highly unusual if it moved as much as 6% or 7%.
Statistics tells us that something that 3 std dev movements are very unlikely, having only a 0.1% chance of happening. By the time we get to 6 std devs, the chance is so small that what we’re measuring should only happen about once every 1.3 billion years. At 7 std dev, the chance jumps up to once every 3 billion years.
Why take it to such a ridiculous level? Because those sorts of events are happening all the time in our “”markets”” now. And that should be deeply concerning to everyone, as it was to Jamie Dimon, CEO of JP Morgan:
'Once-in-3-Billion-Year' Jump in Bonds Was a Warning Shot, Dimon Says
Apr 8, 2015
JPMorgan Chase & Co. head Jamie Dimon said last year’s volatility in U.S. Treasuries is a “warning shot” to investors and that the next financial crisis could be exacerbated by a shortage of the securities.
The Oct. 15 gyration, when Treasury yields fluctuated by almost 0.4 percentage point, was an “unprecedented move” that would have serious consequences in a stressed environment, Dimon, the New York-based bank’s chairman and chief executive officer, said in a letter Wednesday to shareholders. Treasuries are supposed to be among the most stable securities.
Dimon, 59, cited the incident as he waded into a debate about whether bank regulations implemented after the 2008 financial crisis exacerbate price declines by limiting the ability of Wall Street banks to make markets. It’s just a matter of time until some political, economic or market event triggers another financial crisis, he said, without predicting one is imminent.
The Treasuries move was “an event that is supposed to happen only once in every 3 billion years or so,” Dimon wrote. A future crisis could be worsened because there “is a greatly reduced supply of Treasuries to go around.”
(Source)
While Mr. Dimon used the event to suggest that bank regulations were somehow to blame, that explanation is self-serving and disingenuous. He'd use any excuse to try and blame bank regulations; that’s his job, I guess.
Instead what happened was that our “”market”” structure is so distorted by computer trading algorithms, with volume so heavily distorted by their lighting-fast reflexes, that one of those ‘once in 3-billion years events’ resulted.
This simply wouldn't have happened if humans were still the ones doing the trading, but they aren't. All the colored jackets have been hung up at the CME, and human market makers on the floor of the NYSE are rapidly slipping away into the sunset as algorithms now run the show.
The good news about computers is that they allow our trading to be faster and cheaper, presumably with better price discovery. The bad news is that nobody really understands how the whole connected universe of them interact and that, from time to time, they go nuts.
As Mr. Dimon hinted, they have the chance of taking the next financial downturn and converting it into a certified financial meltdown
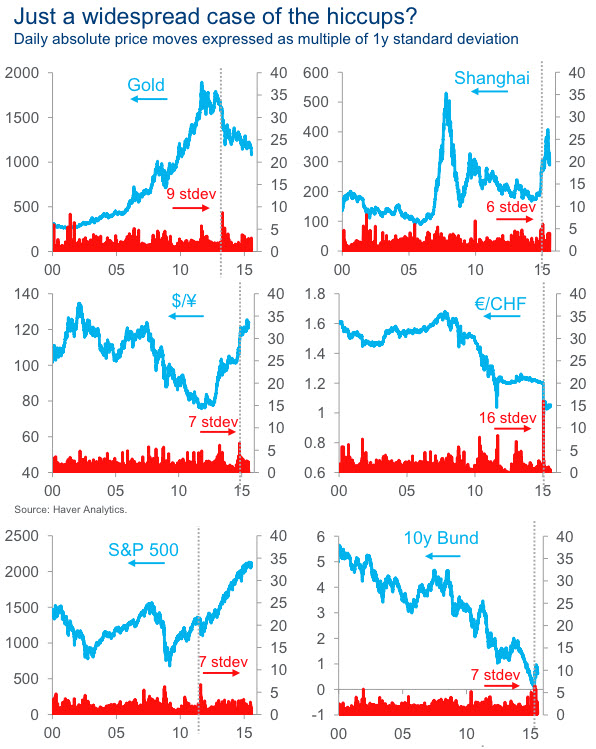
How common are these ‘billion year events’?
They happen all the time now. Here’s a short list:
(Source)
All of this leads us to conclude that the chance of a very serious, market-busting accident is not only possible, but that the probability approaches 100% over even relatively short time horizons.
The deflation we’ve been warning about is now at the door. And one of our big concerns is that we’ve got “”markets”” instead of markets, which means that something could break our financial system as we know and love it.
From The Outside In
One of our main operating models at Peak Prosperity is that when trouble starts it always begins at the edges and moves from the outside in.
This is true whether you are looking at people in a society (food banks see a spike in demand well before expensive houses decline in price), stocks in a sector (the weakest companies decline first), bonds (junk debt yields spike first), or across the globe where weaker countries get in trouble first.
What we’re seeing today is an especially fast moving set of ‘outside in’ indicators that are cropping up so fast it’s difficult to keep track of them all. Here are the biggest ones.
Currency Declines
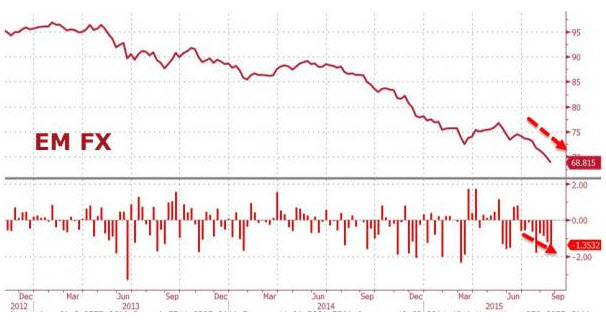
The recent declines in emerging market (EM) currencies is a huge red flag. This combined chart of EM foreign exchange shows the escalating declines of late.
(Source)
Since last Monday, here’s the ugly truth:
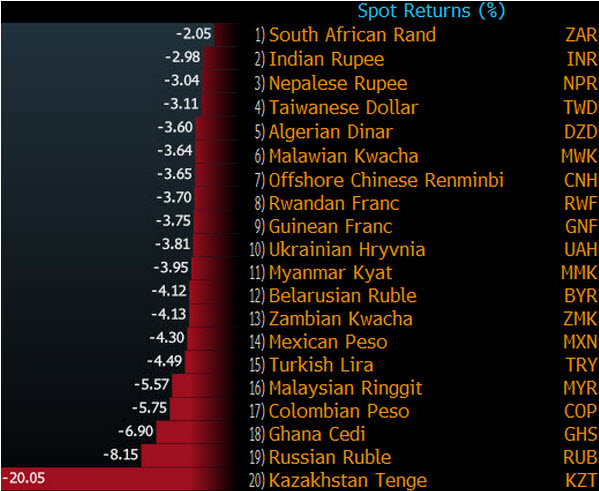
Many of these countries have been using precious foreign reserves to try and stem the rapid declines of their currencies, but I fear they will all run out of ammo before the carnage is over.
What’s happening here is the reverse part of the liquidity flood that the western central banks unleashed. The virtuous part of this cycle sees investors borrow money cheaply in Europe, the US or Japan, and then park in in EM countries, usually by buying sovereign bonds, or investing in local companies (especially those making a bundle off of the commodity boom that was happening).
So on the virtuous side, a major currency was borrowed, and then used to buy whatever local EM currency was involved (which drove up the value of that currency), and then local assets were bought which either drove up the stock market or drove down bond yields (which move as in inverse to price).
The virtuous part of the cycle is loved by local businesses and politicians. Everything works great. The currency is stable to rising, bond yields are falling, stocks are rising, and everyone is generally happy.
However when the worm turns, and it always does, the back side of this cycle, the vicious part, really hurts and that’s what we’re now seeing.
The investors decide that enough is enough, and so they sell the local bonds and equities they bought, driving both down in price (so falling stock markets and rising yields), and then sell the local currency in exchange for dollars or yen or euros, whichever were borrowed in the first place.
And thus we see falling EM currencies.
To put this in context, many of the above listed currencies are now trading at levels either not seen since the Asian currency crisis of 1997, or at levels never before seen at all. The poor Mexican peso is one of the involved currencies, which has fallen by 12% just this year, and almost made it to 17 to the dollar early this morning (16.9950). Battering the peso is also the low price of oil which is absolutely on track to destroy the Mexican federal budget next year.
Stock Market Declines
In concert with the currency unwinds we are seeing deep distress in the peripheral stock markets. There are now more than 20 that are in ‘bear country’ meaning they’ve suffered declines of 20% or more from their peaks.
Here are a few select ones, with Brazil being in the worst shape:
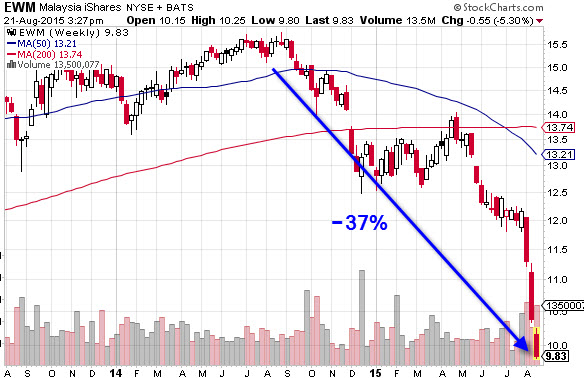
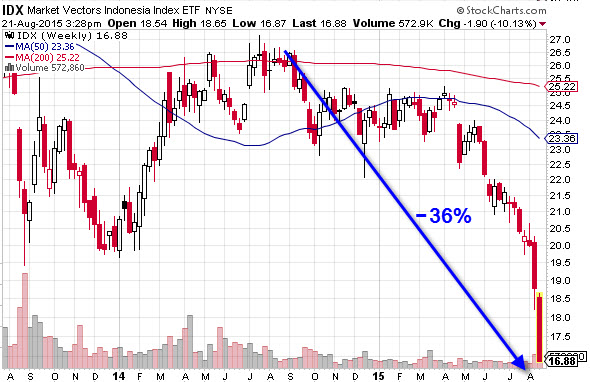
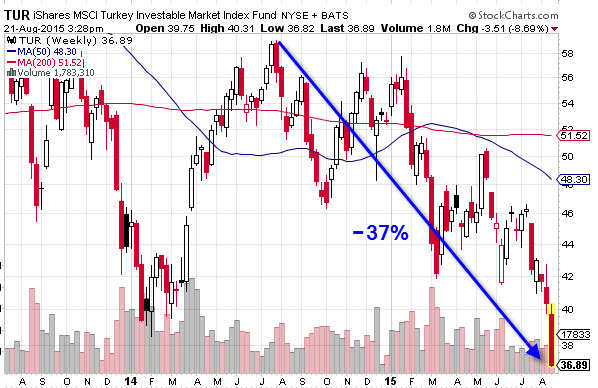
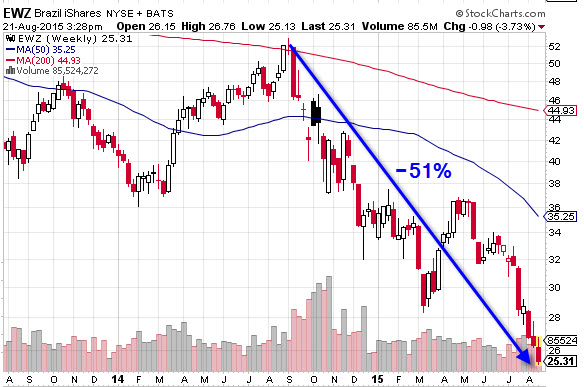
All of these signs reinforce the idea that the great central back liquidity tsunami has reversed course and is about to create a lot of damage and suck a lot of debris out to sea.
The Commodity Rout
A lot of EM countries are commodity exporters. They sell their minerals trees and rocks to the rest of the world, by which we mean to China first and foremost.
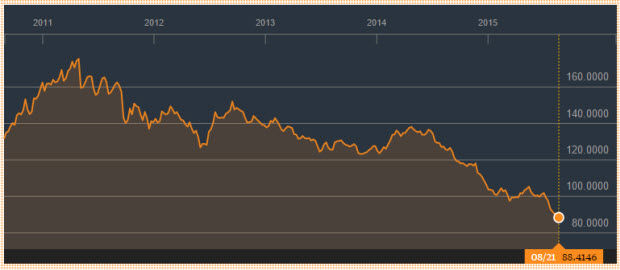
Commodities are not just doing badly in terms of price, they are absolutely being crushed, now down some 50% over the past four years.
(Source)
Commodities tells a number of things besides the extent of EM economic happiness or pain – they tells us whether the world economy is growing or shrinking. Right now they are saying “shrinking” which is confirmed by all of the recent Chinese import, export and manufacturing data, along with the dismal results coming out of Japan (in recession), Europe and the US.
Conclusion Part I
As we’ve been warning for a long time, you cannot print your way to prosperity, you can only delay the inevitable by trading time for elevation. Now, instead of finding ourselves saddled with $155 trillion of global debt as we did in 2008, we’re entering this next crisis with $200 trillion on the books and interest rates already stuck at zero. We are 30 feet up the ladder instead of 10 and it’s a long way down.
What tools do the central banks really have left to fight the forces of deflation which are now romping across the financial landscape from the outside in?
If the computers hiccup and give us some institution smashing or market busting 8 sigma move what will the authorities do? Shut down the markets? It’s a possibility, and one for which you should be prepared.
Where are we headed with all this? Hopefully not the way of Venezuela which is now so embroiled in a hyperinflationary disaster that stores are stripped clean of basic supplies, social unrest grows, and creative street vendors are now selling empanadas wrapped in 2 bolivar notes because they are, literally, far cheaper than napkins. Cleaner? Maybe not so much. I wouldn’t want to eat off of currency.

(Source)
But make no mistake, the eventual outcome to all this is captured brilliantly in this quote by Ludwig Von Mises, the Austrian economist:
There is no means of avoiding the final collapse of a boom brought about by credit expansion. The alternative is only whether the crisis should come sooner as the result of a voluntary abandonment of further credit expansion, or later as a final and total catastrophe of the currency system involved.
The credit expansion happened between 1980 and 2008, there was a warning shot which was soundly ignored by ignorant central bankers, and now we have more, not less, debt with which to contend.
Venezuela has already entered the ‘total catastrophe’ stage for its currency, but Japan will follow along, as will everyone eventually who lives in a country that finds itself unable to voluntarily abandon the sweet relief of booms enabled by credit creation.
In Part 2: Prepare Now! we discuss how time is now running short to make adequate preparations in the event the long-overdue market correction arrives in force. Which one should you focus on most?
Click here to read Part 2 of this report (free executive summary, enrollment required for full access)

