-- Published: Thursday, 3 September 2015 | Print | Disqus
By Rambus
Here is a sample of a Chart I posted in 2008
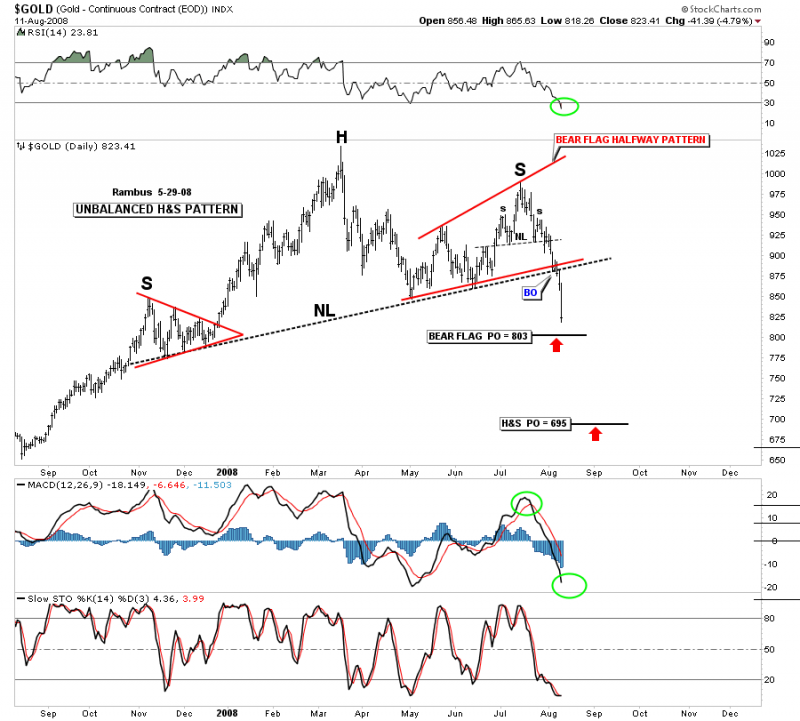
Gold Did bottom at 695 and then the Bull Resumed
That was then and this is now
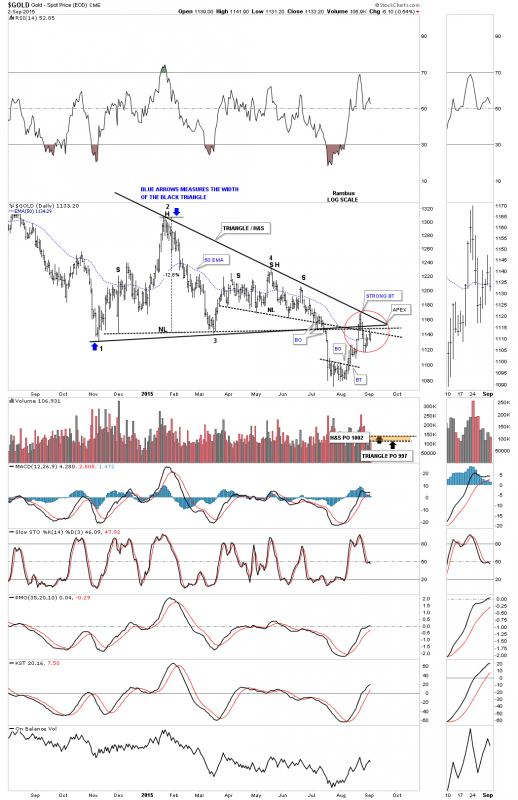
So lets look at some gold charts which are showing gold is at a critical level right here. Below is the daily chart for gold that shows its comb triangle / H&S consolidation pattern. I have shown you on the precious metals indexes the same combo consolidation pattern. The only real difference is the PM stock indexes reached their respective price objectives while gold has yet to reach its. So there is a big divergence between the Pm stocks and the metal. This counter trend rally that started at the August low finally ran into some serious resistance as shown by the red circle. There are two necklines, the top and bottom rails of the triangle and the 50 ema. The rally was finally halted at the top rail of the black triangle. What we need to see happen now is for the previous low from last week to be broken to the downside establishing a lower low and a lower high. As you can see the price action is sitting right on the 50 day ema at the close of trading today.
gold combo
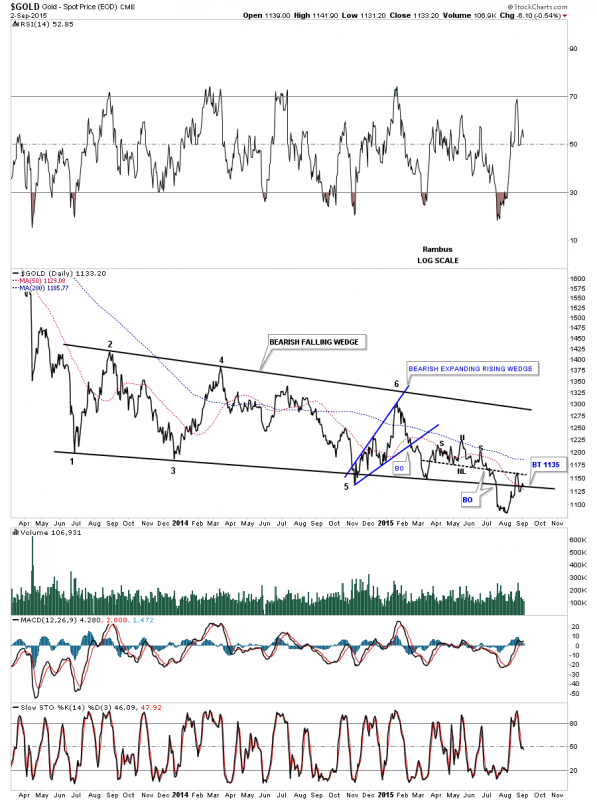
The next chart for gold shows it massive bearish falling wedge with the false breakout to the downside and the strong backtest to the neckline of the smaller H&S consolidation pattern. It closed today right on the bottom rail. I will feel more comfortable when I see the price action trading below the bottom rail of the bearish falling wedge. I cant stress enough how important this area is right here and now for the longer term. This is a huge consolidation pattern with huge implications if it finally breaks out to the downside.
gold day line long
Its been awhile since we last looked at this linear scale chart of golds downtrend channel. As you can see this last rally attempt was stopped at the top rail of the downtrend channel for the fourth time. Note that since the bear market stated in September of 2011 you can see a series of lower lows all the way down. If this latest topping area holds gold will have made lower highs virtually the whole way down. So this is a very critical spot for gold right now.
gold linear scale downtrend
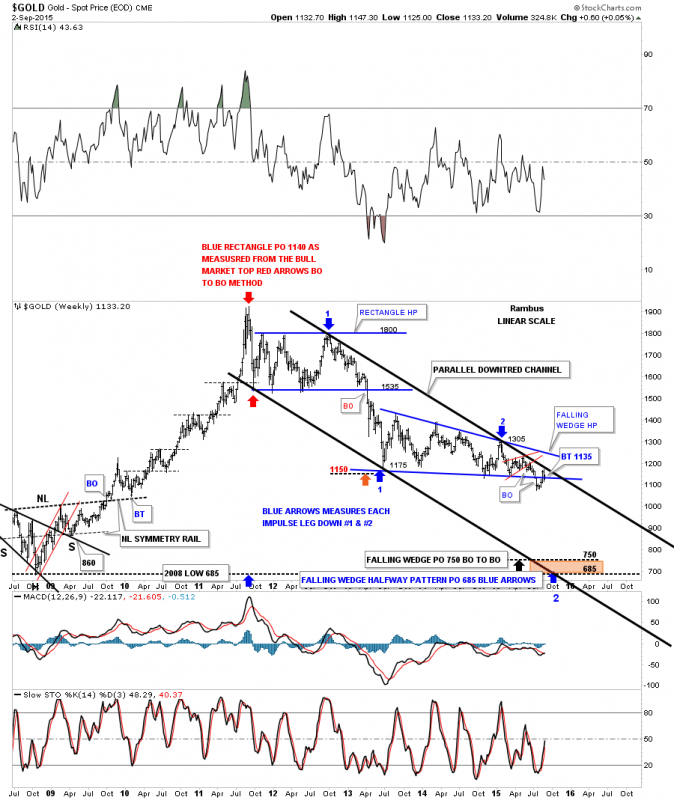
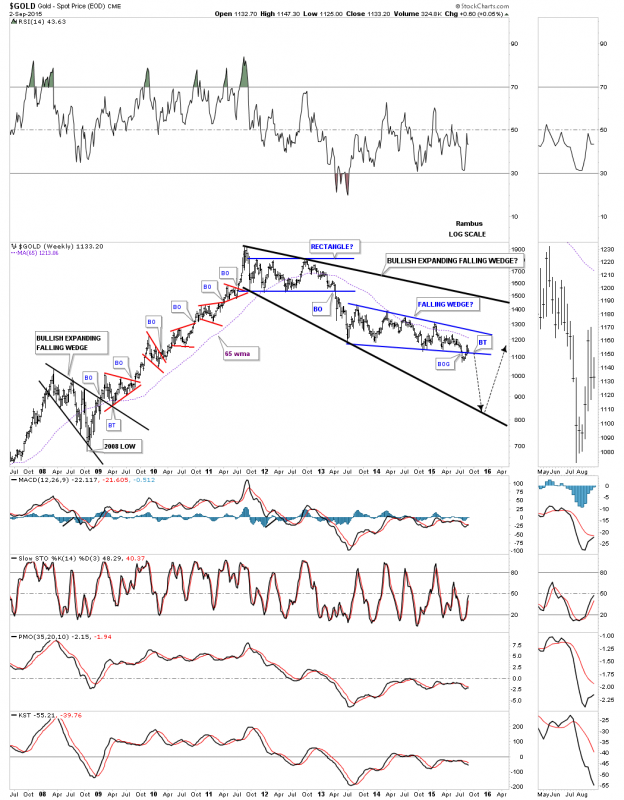
If I could show a perfect setup to end this four year bear market and keep the secular bull market intact I would shows this long term weekly chart for gold. This bear market would be one big consolidation pattern which would be a bullish expanding falling wedge consolidation pattern. The black arrows shows how I would like to see the rest of this pattern develop. Also notice the black bullish expanding falling wedge that marked the low during the 2008 crash. That was one hell of a rally once the top rail of the black expanding falling wedge gave way. Each low in each of the smaller red consolidation patterns were all right at 6 months from low to low. The 65 wma has done a good job of showing support during the bull market years and resistance during the bear market years.
gold expanding falling wedge short
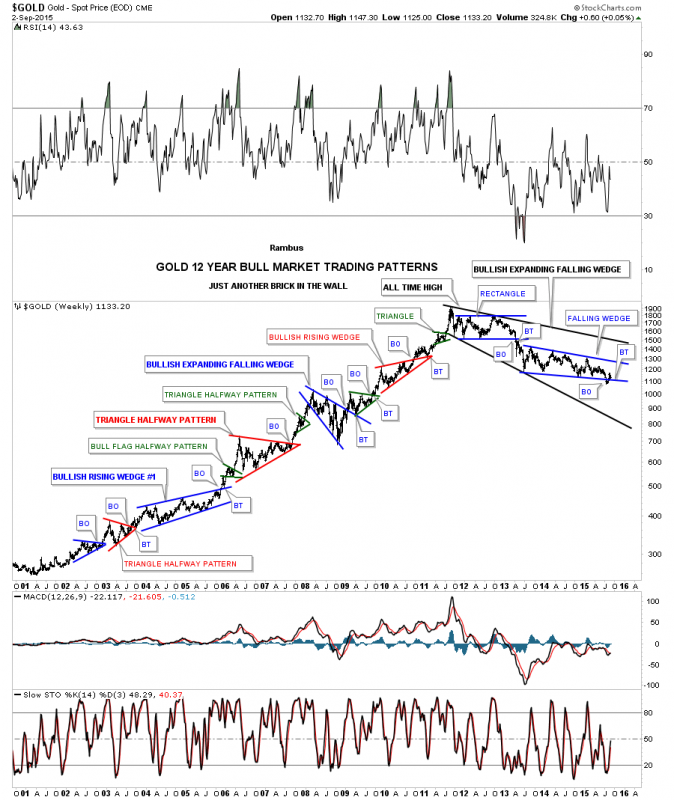
This last chart for gold shows you every chart pattern that formed in both the bull and bear markets. I have said many times in the past that golds bull market was one of the most beautiful bull markets I ever had the privilege to chart. The beauty and symmetry of the bull market was exceptional. Most of our members dont know I was a staunch gold bull during the bull market years. I had no choice as the charts were so compelling. This is one reason why Ive never commented on manipulation. I know for most gold bugs manipulation is like a bible to them but when I see the beautiful bull market gold investors created it cant be manipulation. If there was manipulation we wouldnt see such beautiful chart patterns IMHO.
If you are a goldbug looking for the final bottom or just plain interested in trading the Precious Metals Markets, it is time to focus on the Gold Charts. That is primarily what we do at Rambus Chartology. Have a Look see.
www.rambus1.com
All the best
Rambus
gold every pattern
| Digg This Article
-- Published: Thursday, 3 September 2015 | E-Mail | Print | Source: GoldSeek.com


