-- Published: Sunday, 18 October 2015 | Print | Disqus
We have the data. And it tells a clear story.
By Dave Fairtex
Gold price suppression!
The amount of ink spilled on this topic could fill a supertanker. Goldbugs the world over believe in the suppression story as an article of faith, and indeed, the evidence that something is happening appears incontrovertible.
Given how important the subject is to Peak Prosperity and the bullion-owning community, and the volume of energy we expend talking (and talking, and talking, and talking) about it, how much information do we really have about what is actually going on? Has anyone quantified suppression? Do we know how, when, and how frequently it occurs? Once a month? Once a day? What does it even look like? For many of us it might be like that old Supreme Court Justice's definition of obscenity: I can't define it, but I know it when I see it.
So, I'll take my best shot at defining suppression. Then armed with a definition, I should be able to discover how and when it takes place. To see how frequently it happens, and what the immediately observable effects are as well as the apparent longer term effects of such events. Does the fact that a suppression attack occurs means the price trend changes? Is an attack prima facie evidence of successful control of prices over the long term? And is anything else being suppressed, too? Perhaps everything is being suppressed by our banking lords and masters!
The visible attacks that we have all seen involve someone dumping (or buying) large numbers of futures contracts in the market when activity is relatively lighter than usual, with the intent of deliberately moving price. Most goldbugs like to say that gold and silver suppression attacks occur in the wee hours of the morning. Loosely translated, I take this to mean during non-US and non-London trading hours. So that's the time range I will use: 4pm-3am Eastern; from just after US market close through to the London market open.
So how do we define a deliberate act of suppression or let me state it more neutrally - a volatility event? The ones we have all seen involve a large spike down (or up) in a small increment of time. I'll define this more specifically as at least a 0.5% move within a one-minute period. So, at current prices, that's a $6 move in gold or a $0.08 move in silver that happens within one minute. That's just the minimum amount often the moves are much larger than that.
Goldbugs tend to believe they are a heavily persecuted lot, with their favorite metal singled out for routine beatings. Is there a factual basis for this feeling? Or do volatility events occur for other futures contracts also?
Others (including me!) have pointed out that volatility events happen to the upside as well as to the downside. I have personally seen these spikes higher squeeze the shorts, thus driving prices even higher during non-US non-London trading hours. Some goldbugs never seem to want to acknowledge these events; some have even claimed that they don't happen! So do they happen? That should be easy enough to prove or refute by looking at the trading records. And if such evidence indeed exists, how often do these volatility events take place compared to the downside moves?
To answer all these questions, I wrote some software -- as I'm a programmer by training. The program sorted through intraday price data for 9 different futures markets, with the data starting in late 2009 through today, and counted all the 0.5% 1-minute price spikes (either up or down) that happened during non-US non-London trading times. Then, I entered them into a spreadsheet for analysis. Let's take a look:
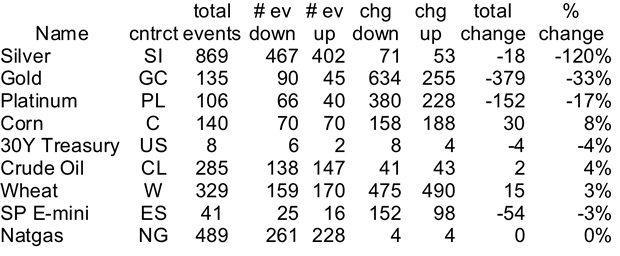
Legend:
total events: the total number of 0.5% 1-minute moves during the time period for that contract.
# ev down/up: # of moves that ended lower, or higher than the starting price.
chg down/up: aggregate dollar change for all up and down events for that contract.
total change: aggregate chg up chg down, in either dollars or points.
So first of all, are there up events as well as down events? The # ev up column says yes, definitely. Silver had 402 up events, and 467 down events. So it's not just a one way street down. Those scoffing analysts are correct: the up-events really do happen. And not just occasionally either! That said, evidence also clearly shows there are more down events than up events for gold and silver (and also for Natgas, and the e-minis).
Next, are gold and silver the only contracts that suffer volatility events during the wee hours of the morning? No. Many contracts received hundreds of similar-sized volatility events during the time period. While it is true that silver received the most total events at 869, Natgas, Wheat, and Crude have all received more total events than gold, with Natgas coming in at #2 with 489.
Could there be an active Natgas, Wheat, and Crude oil suppression campaign going on too?
No. There is one last critical part: the aggregated total change column. If you sum the price changes for all events: chg down + chg up, you get to see the net price impact of all the events. So for silver, the total change over the period is $53 up - $71 down = -$18. Compare this with crude oil, which had $43 up - $41 down = +$2.
What does this mean? Even though silver had $53 in support from the 402 up events it received, it was also hit for $71 from the 467 down events it got: net effect -$18. That's significant for something with a current price of $15. In fact, when viewed as a percentage of silver's current price (the % change column), silver was far and away the hardest hit of all 9 contracts I investigated. Gold's price impact was #2, at $379. Crude actually had a positive effect, while Natgas was dead flat. Even though Natgas had a large number of volatility events, the net effect on price was a wash. The same is largely true for wheat, treasury bonds, and the e-mini futures. Some experienced a mild positive effect, others a mild negative effect, but the effects were quite small relative to the current price of the underlying item.
So goldbugs, take a victory lap! Even though the scoffers were right there are a large number of up events the down events dominate for PM contracts and especially for silver. You have been singled out for beatings! Of course you already knew that, didn't you? :-)
So now that we've looked at the last 6 years in aggregate, and we've established that precious metals have definitely been singled out for negative attention compared to other contracts, its time to look at these events across time, to see if we can get answers to the other questions, such as: When do these events take place? What effect do they have on the price chart? Are they still happening? And if so how often?
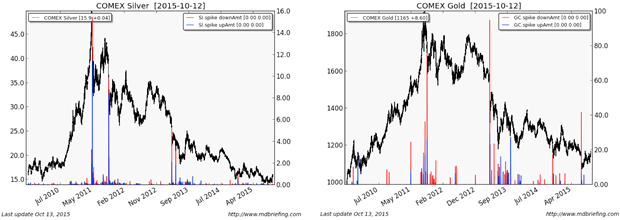
First, let's look at the big picture. Here are a pair of price charts for silver and gold over the five year time period, with the volatility events (red = down, blue = up, measured in dollars, weekly) overlaid.
For silver, we can see four main events: a huge spike right near the 2011 peak, another spike that seems to coincide with the low in 2011, and a couple more in early-2013 that happened during the great gold smash of 2013. We can also see that the red (the down spikes) usually is larger than the blue (the up spikes).
Gold's picture is a bit different: a few smaller spikes appear during the uptrend, a couple appear right near the peak, and a massive spike appears right after the peak. The largest spike in gold happens during the 2013 gold smash. One last big spike occurs in 2015, about the time of the low at 1075. As a general impression, gold has far more red than blue; this is borne out by the spreadsheet, which shows a 2:1 red:blue ratio.
Anatomy of a Top
The next goal is to dig deeper, and see how a volatility event storm affected price. Does a volatility event line up with a big move down? And what happens after? Does price keep falling, or does it bounce right back up? Do volatility events change trend? If so are there conditions?
Silver has received the biggest total number of volatility events, and has received the largest negative impact as a percentage of price. Let's look at the biggest spike, the infamous 2011 peak at $50 through the lens of volatility events, and try to see what might have gone on. Did suppression cause the top? It seems like it should have but did it?
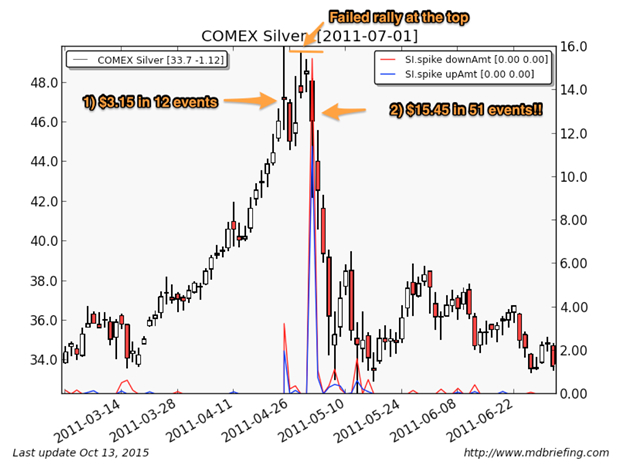
On Sunday/Monday, April 25th , 2011, someone hit the market with 12 different volatility events totaling $3.15, which was at that time the largest single set of volatility events in the timeseries, the same day that silver ticked $50/oz. As a result, silver printed a doji on the day. Price fell the following day, but then a funny thing happened. Price started moving higher again. Three days after the big Sunday-evening silver smash, price was once again testing $50 and in fact it had two shots at $50 without any volatility events appearing at all on days #4 and #5. But those two shots at $50 failed, and on day #6 as price began to fade, someone came in with a truly absurd 51 events totaling $15.45 in impact that started the collapse in price down from the high. Buyers still tried to buy the dip that day, and price only fell $2 a minor miracle given the pounding - but the rock had started to roll down hill, and it didn't stop until price dropped a total of $15 over 5 days.
Was the top caused by these volatility events? Its hard to say. Had the bulls been strong enough to push price over $50 in days #4 & 5, its likely the volatility event on day #6 would not have worked. They don't seem to work too well during an uptrend. The silver bulls had two free shots to move price above $50, completely unopposed by any volatility events at all, and they failed. Once they failed, that's when someone launched the second volatility event storm.
Looking at the price chart alongside the volatility event chart, it does not look like a straightforward case of someone successfully causing the top through direct application of force. First they used a stall to stop the upward momentum in a very extended market which resulted in the doji print, and then the buyers were unable to muster enough power to push prices higher, and then someone unloaded with maximum force once the buyer fatigue became apparent. That's how I read the chart anyway.
What would have happened had someone not unleashed the volatility storm on day #6? We will never know. The market would have eventually corrected at some point no tree grows to the sky - but its hard to know how much higher it might have gone.
In Part 2: How To Protect Yourself & Profit From This Manipulation, we look further into the recent data to determine whether or not the downward manipulation of precious metals can continue as it has over the past few years. Bullion investors will be heartened to learn of the signs we're seeing that $1,05/oz gold may have been the bottom, and that brighter days may indeed lie ahead.
True or not, though, the manipulation attempts are likely to continue for some time. We look at how bullion investors can position themselves to defend against the most predictable elements of these raids, and how brave souls interested in speculating may profit from them.
Click here to read Part 2 of this report (free executive summary, enrollment required for full access)
| Digg This Article
-- Published: Sunday, 18 October 2015 | E-Mail | Print | Source: GoldSeek.com


