-- Published: Tuesday, 29 December 2015 | Print | Disqus
By Daniel R. Amerman, CFA
Markets and economies usually run in cycles and there have been numerous previous reversals where falling interest rates have been replaced by rising interest rates. The soothing reassurances from many financial authorities and much of the financial media are that there is no need for the general public to worry because this sort of thing is quite normal.
But is this actually true? Have we really been "here" before?
Or are there are major differences between this time around and the previous cycles of rising interest rates which mean that much of recent history may not apply at all?
There are a number of aspects of the current situation and this quite small and hesitant increase in short term interest rates that are not at all like previous cycles, and not the slightest bit normal.
The biggest difference of all may be the amount of federal debt currently outstanding. As explored herein, the national debt "supercycle" has moved to a very different place than where it was for many decades and that means that interest rate cycles can't work like they have in recent decades, without the risk of triggering extraordinary increases in the deficit and national debt.
When we understand why these factors are so different from previous cycles, then the Federal Reserve's action in raising short-term interest rates on December 16th, 2015 can be seen for what it truly is: something brand new, a first time attempt. It is a cautious experiment, with stakes that could potentially change economies and investment returns for years or even decades to come.
Unprecedented Low Rates For An Unprecedented Time
As can be clearly seen in the graph of the effective Federal Funds Rate below, interest rate cycles have switched from falling to rising many times since 1954. So yes, just saying that rates are going up does not mean "the sky is falling", but rather far from it.
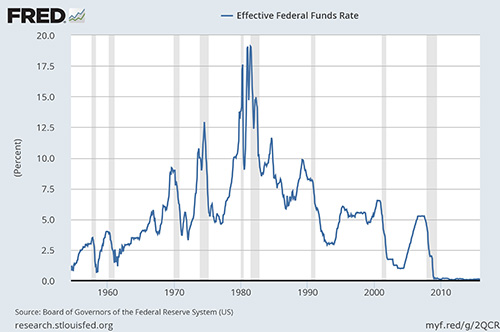
However, what is also visually obvious is that we have never seen anything like this situation before. Rates are lower than they had ever been in the modern era. And they have been low for longer than we have ever seen before. The previous lows were brief dips, and they didn't "flat-line" for years on end.
It is easy to say the words "this is all just a cycle". But clearly, that doesn't stand up to simple visual inspection, when we look at what the historical cycles actually looked like over the more than sixty years covered in the graph.
So why does this low in interest rates look so very different?
An Extraordinary Increase In The National Debt
To understand why recent interest rates have looked so different, we have to consider something else that has looked very different indeed over the years since the financial crisis of 2008.
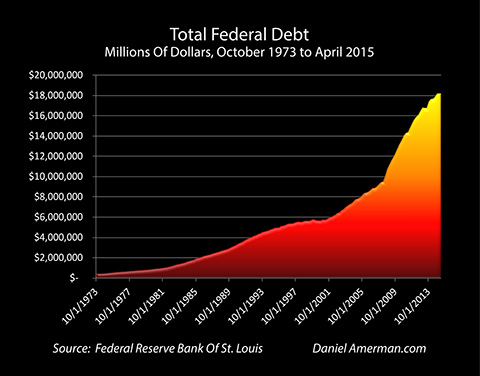
The issue is that we have a national debt that has exploded upwards, to over $18 trillion. Interest payments have to be made on that debt. So if interest rates rise materially above the flat-lined floor where they have been, then the United States has to make far higher interest payments meaning much larger budget deficits.
Now, what happens when we combine our national debt graph, with our previous Federal Funds rate graph?
As shown above and further explored here, we get a truncation. An off the chart explosion in the national debt outstanding was met by a through the floor plunge in interest rates (including medium and long term interest rates).
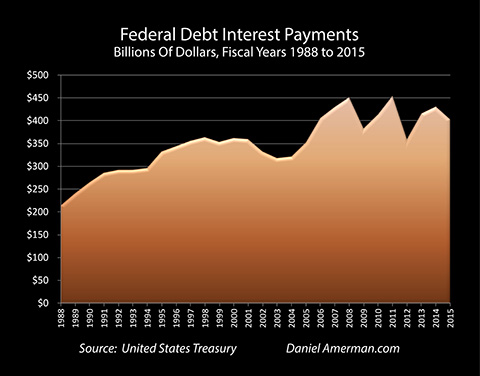
Interest payments should have soared with the increase in the national debt, but they were chopped off by the simultaneous plunge in interest rates, and in combination, soaring debt and plunging rates negated each other and produced the more or less flat interest payment pattern seen above. A pattern that was not coincidence nor mere luck, but the very deliberate result of the unprecedented interest rate interventions by the Federal Reserve.
So if we are to believe that this is all just part of a quite normal cycle, and that interest rates will smoothly rise back to normal and historical levels as the Federal Reserve returns to normal policies could that have a financial effect on the US government?
Two key considerations about interest payments on the national debt are that the federal government borrows the money to make the interest payments, and that those interest payments are the source of more than half of the annual budget deficit.
So if interest rates are allowed to get too far "above the floor", that risks setting off major increases in the budget deficit which must be borrowed, and added to the national debt.
If we look simply at the annual deficit, then a 3% increase in interest rates paid would increase the federal government deficit by over $500 billion per year, and a 5% increase in interest rates paid on the national debt would raise the annual deficit by over $900 billion per year.
However, there is a much bigger problem, which is the interest payments that must be made on the money that was borrowed to make interest payments, and how interest on interest can rapidly compound the national debt.
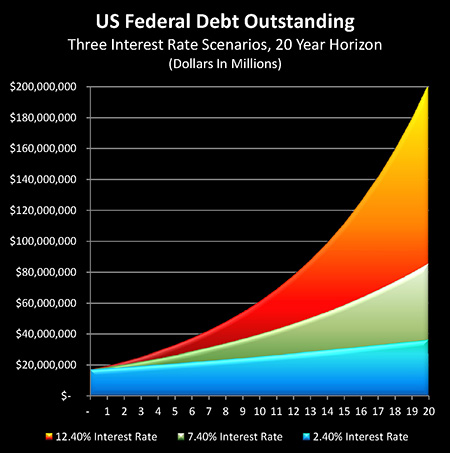
As illustrated above and further explored here, the financial mathematics are quite clear compound interest is a minor factor with the current very low level of interest rates, but can rapidly grow out of control with medium or high interest rates. Indeed, an increase to the "normal" interest rates of the 1970s to the 1990s could quadruple the United States national debt within the next 20 years, to a level of over $80 trillion (absent major tax increases).
Integrating The Interest Rate Cycle With The National Debt Supercycle
So, if a "normal" increase in interest rates could set off a catastrophic increase in the national debt, then why hasn't that happened many times before with all those many previous increases in interest rates, or those decades of "normal" interest rates?
To understand why this time is truly different, we need to understand that there is a second, much larger and more long-term cycle than the interest rate cycle.
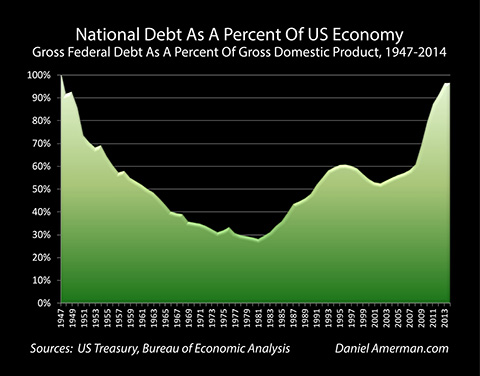
When economists look at the size of a national debt, they often look at it terms of affordability. The size of the economy is what determines affordability, as it is the economy that generates the resources which can be taken by the government in order to support payments on the debt.
The graphic shows the national debt as a percent of the US economy from 1947 to 2014. What we see is an almost 70 year "supercycle" which profoundly impacts and even supersedes normal interest rate cycles. The US national debt is currently the highest that it has been relative to the economy since shortly after the end of World War II. And a very large portion of that gain occurred very quickly after the financial crisis of 2008.
What this means is that much of our interest rate history from the 1970s, 1980s, 1990s and early 2000s no longer applies. Nations that have smaller debts relative to their economies can much more easily afford higher interest rate levels. If the national debt is only 30%, or 40%, or 50% or so of the size of the national economy, then increases in interest rates do impact the federal budget but they aren't an existential event.
Conversely, economic history shows us that when nations reach the stage where the United States is currently at, with national debts essentially equaling the size of the economy, then these nations can become quite financially vulnerable.
The other fascinating part of the graph above, is that contrary to what is believed by many people we have been here before. While a number of things are quite different this time around, the national debt problem by itself is not unprecedented. The last time around the US didn't go bankrupt. And the national debt was in fact gradually reduced relative to the size of the economy over a period of 25-35 years.
This gradual, long-term return to relative financial health was no accident, but as further explored here, it was a very deliberate process that required overriding the usual interest rate cycles. For decades the government took firm control of interest rates, and particularly during the first 20 years of high levels of indebtedness it used that power to keep rates in a lower and more stable range than would be seen in the almost 40 years after that until the crisis of 2008 brought the old survival tools back into play.
In anticipation of the 2015 rate hike, there was a flurry of articles in the financial media about the novelty of rates rising again, and how so many younger professionals had no career experience with increasing interest rates. Those articles missed the point. Experience with what we are going through now does not require going back 10 years or 20 years in time, but rather 50 to 60 years or more, which is the last time we had rising interest cycles occurring during a heavily indebted portion of the national debt supercycle.
An understanding of this distant past becomes highly relevant when it comes to one of the big questions of today and the December of 2015 "liftoff": does this mean that savers and retirees will finally start to get a fair deal?
Part II
Part II of this article explores 1) what history shows for savers and retirees at this stage of the national debt supercycle; 2) why the full federal debt is what is important, rather than merely external debt; and 3) why Fed Funds aren't the main experiment, and what hasn't been changing.
Continue Reading The Article
Contact Information:
Daniel R. Amerman, CFA
Website: http://danielamerman.com/
E-mail: dan@danielamerman.com
This article contains the ideas and opinions of the author. It is a conceptual exploration of financial and general economic principles. As with any financial discussion of the future, there cannot be any absolute certainty. What this article does not contain is specific investment, legal, tax or any other form of professional advice. If specific advice is needed, it should be sought from an appropriate professional. Any liability, responsibility or warranty for the results of the application of principles contained in the article, website, readings, videos, DVDs, books and related materials, either directly or indirectly, are expressly disclaimed by the author.
| Digg This Article
-- Published: Tuesday, 29 December 2015 | E-Mail | Print | Source: GoldSeek.com


