-- Published: Thursday, 31 December 2015 | Print | Disqus
By Steve St. Angelo, SRSrocco Report
The market price of gold would be considerably higher if it wasn’t for the massive stock dilution and debt in the gold mining industry. Basically, the gold mining industry issued billions of new shares and debt to help replace production and to compensate for rising costs. Thus, investors of gold mining stocks got raped so the market could enjoy an artificially lower gold price.
Nothing like Free Market Capitalism at work.
Top 5 Gold Producers: Production vs Shares
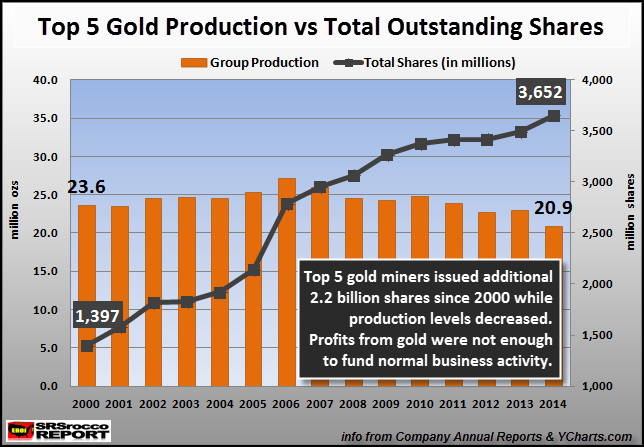
If we look at the data from the top five gold producers since 2000, we can see a very interesting trend. In 2000, these top gold producers (Barrick, Newmont, AngloGold, GoldFields & GoldCorp) had 1.39 billion shares outstanding, while their total production was 23.6 million ounces (Moz).

Now compare that to year ending 2014, where combined production for the group declined to 20.9 Moz while total outstanding shares increased to a staggering 3.65 billion (shown in the chart as 3,652 million shares). Since 2000, these top five gold companies increased their shares total shares by 2.2 billion while total production declined by 2.7 Moz.
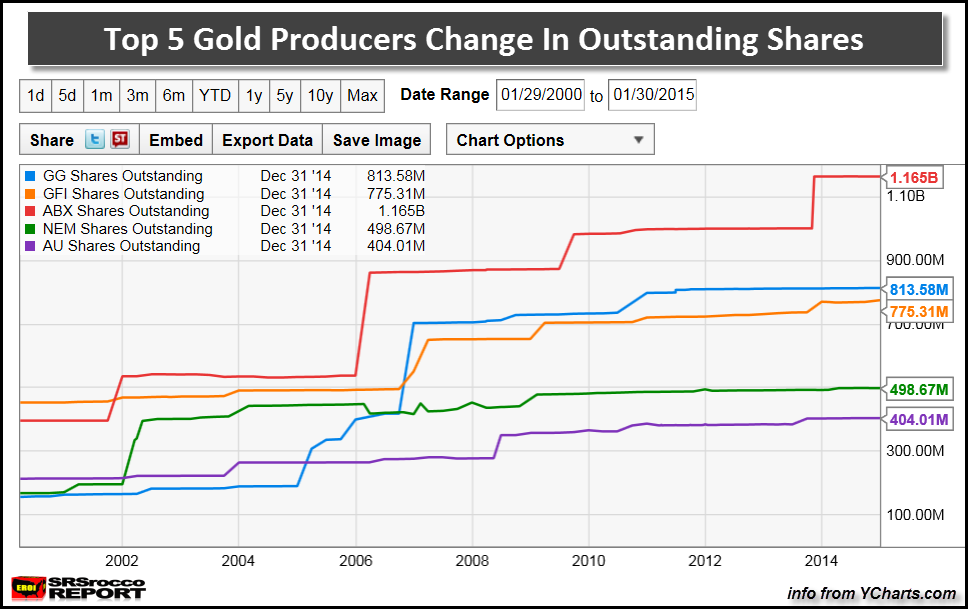
This next chart shows the increase of outstanding shares for each gold mining company:

(GG: GoldCorp, GFI: GoldFields, ABX: Barrick, NEM: Newmont, AU: AngloGold)
Here is a breakdown for the increase in shares for each since 2000:
Barrick = +769 million shares
GoldCorp = +657 million shares
GoldFields = +332 million shares
Newmont = +332 million shares
AngloGold = +191 million shares
What has taken place in the top gold mining industry is simple… profits alone could not fund new projects (replacement production) or increased costs, so the industry raped shareholder value. Here’s another way to look at this wonderful phenomenon.
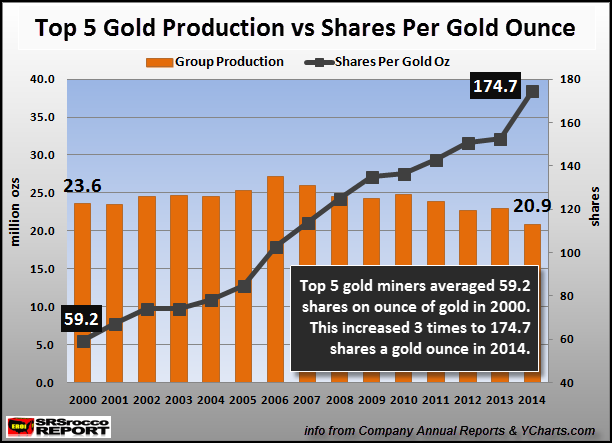
If we compare total annual gold production versus outstanding shares, this is the result:

In 2000, these top five gold companies averaged 59.2 shares for each ounce of gold produced. However, in 2014 this increased nearly three times to 174.7 shares per gold ounce produced. Which means, stock investors got hoodwinked into financing the gold mining industry as profits alone were unable to do so.
And if you think that is bad…. it get’s even worse.
Top Gold Companies Increased Debt To Fund Production
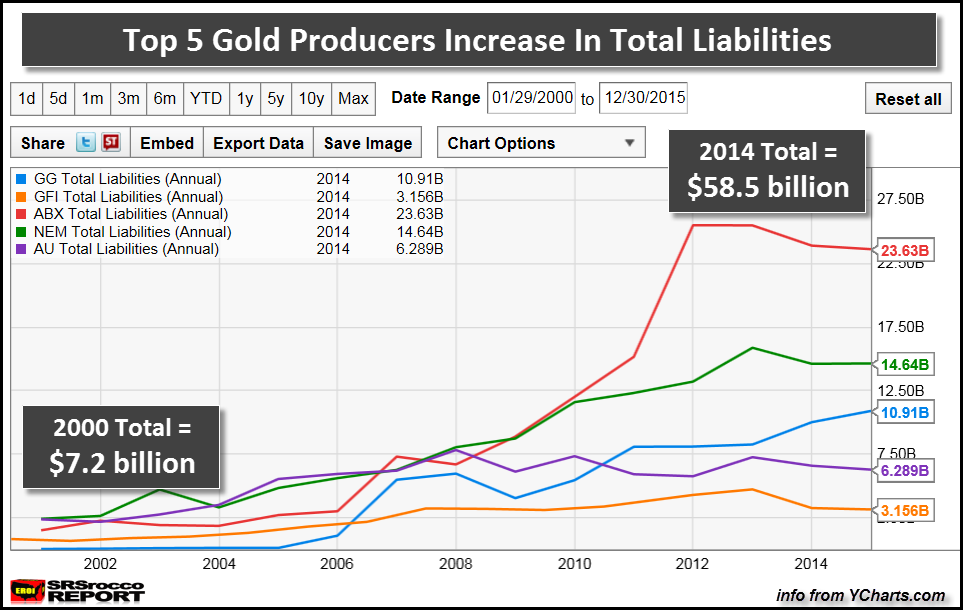
Not only did these gold mining companies issue a lot more shares to fund their operations…. they also added a lot of debt:

As we can see in the chart above, total debt (liabilities) for these top gold companies was $7.2 billion in 2000 compared to a staggering $58.5 billion in 2014. If we apply simple math we have the following…..
Top 5 Gold Companies Debt per oz of gold produced:
2000 = $305 debt/ gold oz produced
2014 = $2,800 debt/ gold oz produced
What a change…. aye? These top gold producers held just $305 in debt for each ounce of gold they produced in 2000, however this skyrocketed to $2,800 of debt per ounce in 2014. That’s a lot of debt.
Imagine what the real cost to produce gold if these top mining companies did not issue 2.2 billion more shares or increase their debt more than eight times over the same time period. Thus, the market price of gold is artificially lower due to massive share dilution and colossal debt.
Investors purchasing gold (and silver) will be handsomely rewarded when the public finally realizes that they are holding onto DEBTS masquerading as ASSETS. This is when the true store of wealth value of gold and silver are realized.
Please check back for new articles and updates at the SRSrocco Report. You can also follow us at Twitter below:

| Digg This Article
-- Published: Thursday, 31 December 2015 | E-Mail | Print | Source: GoldSeek.com

