-- Published: Thursday, 31 December 2015 | Print | Disqus
By Gary Tanashian
I see analysis out there discussing the Semiconductor sector as a whole as being under valued relative to other stock market sectors. This seems to be based on the fact that the SOX chart has not made nearly the catch up move that for example, the NDX has in its post 2000 recovery.
While charts can provide many helpful views to probabilities, they cannot get inside an industry and divine the importance of a sub-sector (Semi Equipment; AMAT, LRCX, etc.) within a sector as a whole. The equipment companies (which I am short) are the Canarys Canary, with the Semi sector in general being an economic Canary in a Coal Mine.
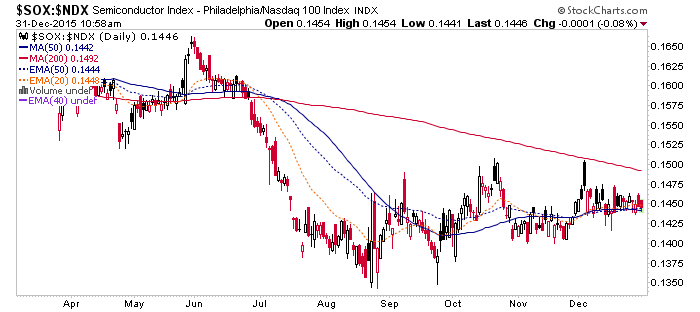
I can see why a chartist might get excited. SOX vs. NDX has been stair stepping higher since leading the market into the August drop.
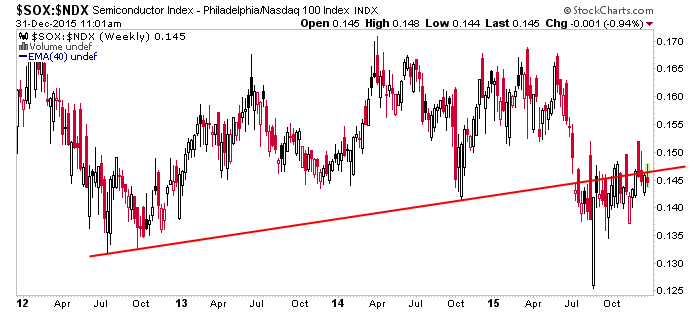
However, a weekly view is not so pleasant.
Further, the monthly is even less so as it shows the under valued SOX having lost the post 2012 leadership trend vs. NDX.
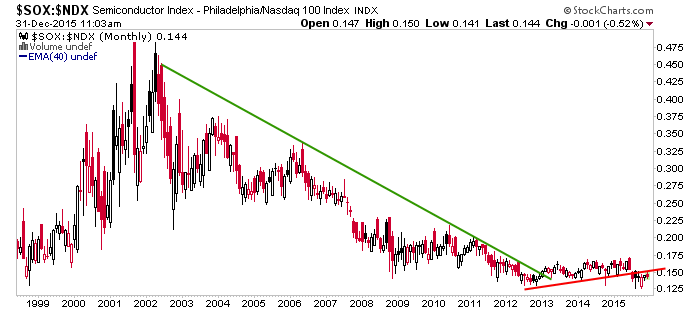
To review, we took the signals from this highly cyclical industry, led by its even more cyclically sensitive equipment sector and projected coming economic strength in January of 2013. The chart does not indicate that SOX is under valued vs. the NDX; it simply indicates that it is losing its cyclical leadership. Before moving on to the Book-to-Bill data, here again is an email from my former colleague, who is intimate with the Semi Equipment sector, received back in November
All is as well as can be with this severe downturn in Semi. Yes, Semi has slowed considerably, something like 25% [from] where we were early this year. We noticed starting in June that orders were not coming in as they were. Right now here at [XYZ Company, name withheld for privacy] we are off about 40% from earlier this year. What I am hearing is that this is probably not going to start improving until late first quarter. Part of it is inventory adjustments all the way up the supply chain and the rest is just business itself.
At the last release (for October) from SEMI we noted that the book-to-bill had declined as it had sporadically on previous occasions. But this time the negative reading could be taken seriously because both bookings and billings had declined, with the all-important bookings declining faster. Previous negative readings were just due to the interplay between bookings and billings, which each remained healthy in nominal terms. Now November joins October in layering in another negative reading.
As you can see, the picture is degenerating.
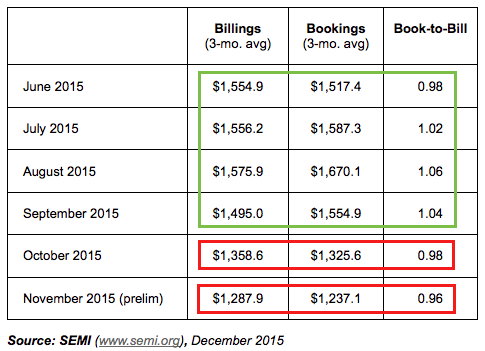
For what its worth, this is the first SEMI release in which the spokesman specifically mentioned the strong US dollar as a negative driver.
The semiconductor equipment book-to-bill ratio continued to decelerate in the fourth quarter, said Denny McGuirk, president and CEO of SEMI. In light of this recent softening and with the currently strong U.S. dollar, SEMI anticipates that the total equipment market (billings) will be flat to slightly down this year vs. last year as reported in U.S. dollars.
To summarize the situation, the Semiconductors are so under valued for a reason and that reason is because they are relatively volatile and highly cyclical, unlike many of the markets components. In other words, these are not just tech stocks. They are a specialized, and leading edge component of technology. The message from the Canarys Canary is to expect a cyclical bump in the economic road at the very least.
A positive bet on the Semis right now is a bet that my associates noted inventory adjustments are the primary reason for supply chain weakness and that the stock market will discount that promptly. But if there is more to it than that as I think there is, I see no reason to believe that the Canary is not acting exactly like it did for us in early 2013, only in reverse. After all, as long as the 3rd chart above remains in breakdown mode, the post-2012 cycle is indicated to be over.
The well rounded NFTRH service will see a modest price increase within the next few days. If you would like to have our weekly reports and dynamic market and trading updates always on the job providing right minded analysis of many major markets, subscribe today at nftrh.com before the increase takes effect.
Subscribe to NFTRH Premium for your 25-35 page weekly report, interim updates and NFTRH+ chart and trade ideas or the free eLetter for an introduction to our work. Or simply keep up to date with plenty of public content at NFTRH.com and Biiwii.com.
| Digg This Article
-- Published: Thursday, 31 December 2015 | E-Mail | Print | Source: GoldSeek.com


