-- Published: Tuesday, 26 January 2016 | Print | Disqus
By Frank Holmes

Plunging oil prices, rising market volatility, surging global debt—it’s all beginning to remind some investors of 2008. Earlier this month, billionaire former hedge fund manager George Soros warned of an impending financial crisis similar to the last major one, which sent shockwaves throughout global markets.
The comparisons to 2008 have triggered gold’s Fear Trade, with many investors scrambling into safe haven assets. Jeffrey Gundlach, the legendary “bond king,” recently made a call that amid further market turmoil, the metal could spike as much as 30 percent, to $1,400 an ounce.
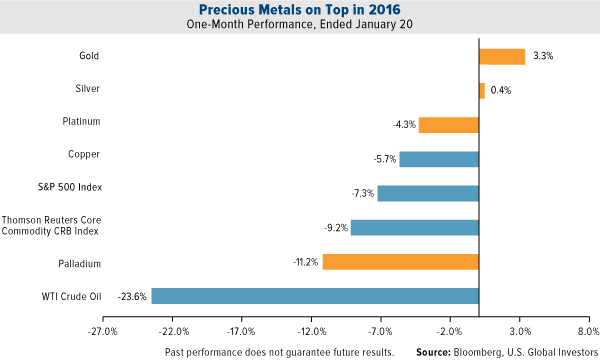
Making such predictions is often a fool’s game, but there’s no denying that gold demand is on the rise, both in the U.S. and abroad. For the one-month period ended January 20, gold (and silver) outperformed, comfortably beating domestic equities as well as a basket of other commodities.

click to enlarge
I’ve already shared with you the fact that gold has historically had a low correlation with equities. This point is worth reiterating: When equities have zigged, gold has zagged. And with volatility high in global markets right now, many investors are choosing to rotate a portion of their portfolios into the precious metal.

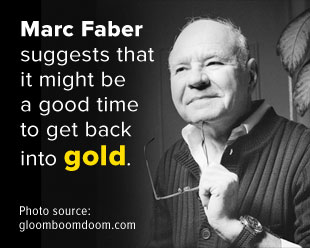
This was the advice of my friend Marc Faber, who recently warned investors in his influential “Gloom, Boom & Doom Report” newsletter that global stocks could fall an additional 40 percent on mounting liquidity and debt problems. In the event such a crisis occurs, Marc says, investing in gold—which, again, has been shown to be inversely correlated with stocks—might be one way to protect one’s wealth.
I’ve always recommended a 10 percent weighting in gold: 5 percent in physical bullion, the other 5 percent in gold stocks or mutual funds. This applies in all market conditions, good or bad.
Something else I want to draw attention to in the chart above is the extreme divergence in performance between gold and oil, which is trading at levels we haven’t seen in a long while. Declines in oil have traditionally invited enormous selloffs in other commodities, making gold’s resilience at this time all the more impressive.
China Consumed Nearly All of Global Gold Output in 2015
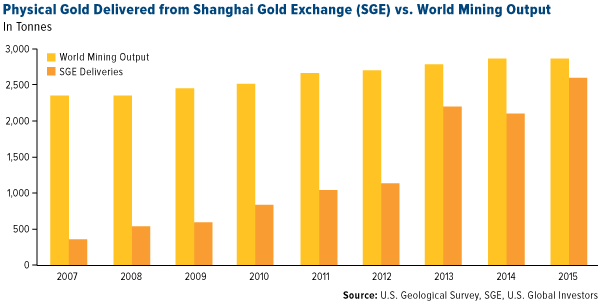
Investors in China appear to recognize the importance of gold in times of market uncertainty. Since June 2015, the Shanghai Composite Index has dropped close to 45 percent, prompting scores of retail investors to pivot into safe haven assets such as gold. As you can see below, 2015 was a blowout year for the Shanghai Gold Exchange (SGE), which in the past has served as a good measure of wholesale demand in China.

click to enlarge
Not only did gold deliveries climb to a record number of tonnes in 2015, they also represented more than 90 percent of the total global output of the yellow metal for the year.
The SGE has made it incredibly easy for Chinese citizens to participate in gold investing. Recently it rolled out a smartphone app, making it more convenient than ever before to open an account and begin trading.
Gold Miners Are Winners of the Currency Wars
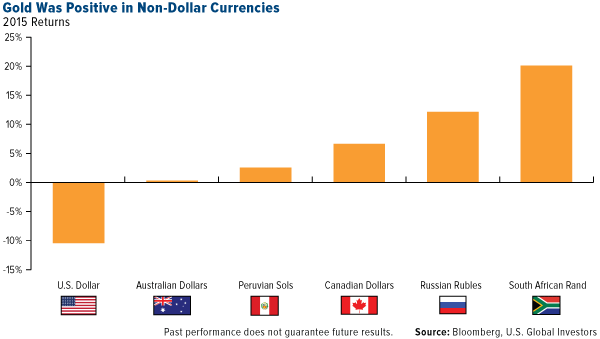
Gold priced in the strong U.S. dollar might have netted a loss in 2015, but in many other parts of the world, prices were either stable or even made gains. For buyers of gold in non-dollar economies, it’s the local price that matters most, not the dollar. In Russia, the third-largest producer, the metal rose 12 percent—and came close to an all-time high. In South Africa, the sixth-largest, it was well above the all-time high. Investors there saw returns of greater than 20 percent in 2015.

click to enlarge
This has been beneficial to many mining companies based outside the U.S. Operations are paid for in local currencies—most of which have weakened in the last year—but companies sell their production in U.S. dollars. This has helped offset the decline in gold prices since they peaked in 2011.
Canadian-based companies such as Claude Resources, Richmont and Agnico Eagle Mines are performing well, even in the gold bear market and amid high volatility.

click to enlarge
For the last three years, gold miners all over the globe have been thoroughly beaten up. Today, they’re heavily discounted, and there are signs that conditions are stabilizing.
Managing Expectations
With the Fear Trade heating up, it’s important that we manage our expectations. The length and extent of the current bear market, which began in September 2011, might seem unprecedented to many investors. In actuality, it doesn’t veer very far from what we’ve seen in the past, according to data presented by the World Gold Council (WGC).
Current Gold Bear Market Not Far off the Mean| January 1970 – January 2016 |
|---|
 BULL MARKET BULL MARKET |  BEAR MARKET BEAR MARKET |
|---|
| Dates | Length (months) | Cumulative Return | Dates | Length (months) | Cumulative Return |
|---|
Jan 1970 -
Jan 1975 | 61 | 451.4% | Jan 1975 -
Sep 1976 | 20 | -46.4% |
Oct 1976 -
Feb 1980 | 41 | 721.3% | Feb 1980 -
Mar 1985 | 61 | -55.9% |
Mar 1985 -
Dec 1987 | 33 | 75.8% | Dec 1987 -
Mar 1993 | 63 | -34.7% |
Apr 1993 -
Feb 1996 | 35 | 27.2% | Feb 1996 -
Sep 1999 | 43 | -39.1% |
Oct 1999 -
Sep 2011 | 144 | 649.6% | Sep 2011 -
Present | 52 | -44.1% |
| Average | 63 | 385.1% | Average | 47 | -44.0% |
| Median | 41 | 451.4% | Median | 52 | -42.7% |
| Source: World Gold Council, U.S. Global Investors |

