-- Published: Friday, 19 February 2016 | Print | Disqus
By Steve St. Angelo, SRSrocco Report
There’s been a significant trend change in the gold market and it has the Western Central Banks worried. Before the collapse of the U.S. Investment Banking system in 2008, annual net physical gold investment was negligible. However, the present situation has changed considerably, putting severe stress on Western Central Bank policy makers.
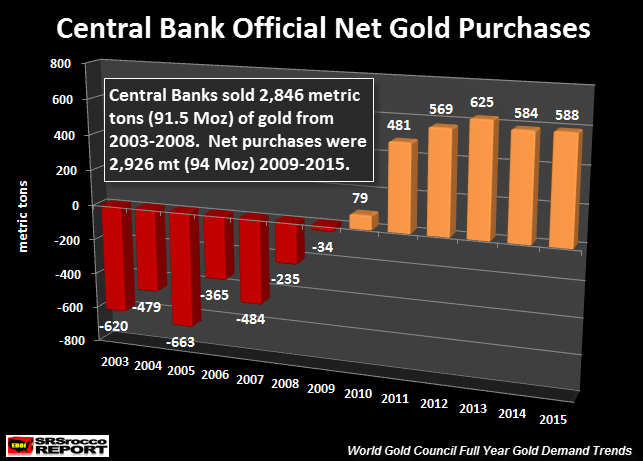
Prior to 2008, many Central Banks (mostly Western) were net sellers of gold into the market. This official Central Bank policy was designed to keep the gold price from moving up higher. According to the figures from the World Gold Council, from 2003 to 2009, net sales of Central Bank gold totaled 2,846 metric tons (mt), or 91.5 million oz (Moz):

Central Bank gold sales peaked in 2005 at 663 mt and accounted for 21% of total demand that year. What would have been the market price of gold if the Central Banks didn’t dump 91.5 Moz over the seven-year period (2003-2009)?
Then something changed in 2010. As the United States and other Western Central Banks (Japan & then the EU) continued their massive QE (Quantitative Easing – money printing) policies, Eastern and various Central Banks became net buyers of gold.
Net Central Bank gold buying started at only 79 mt in 2010, surged to 625 mt in 2011 and is estimated to be 588 mt for 2015. Again, the majority of Central Bank gold purchases were from Eastern governments, especially in 2015. Russia and China accounted for majority of Central Bank gold purchases last year.
What a trend change… aye? From 2003-2009, Central Banks dumped 91.5 Moz of gold into the market. However, this totally reversed as Central Banks were net buyers, acquiring 94 Moz of gold from 2010-2015.
Net Physical Gold Investment Has Western Central Banks Worried
While Western Central Banks dumped gold onto the market to suppress the price, Eastern Central Banks are doing the opposite. Thus, Eastern Central Bank gold purchases have put more stress on “Net Physical Gold Investment.” I say physical gold investment as I have excluded changes in Global Gold ETF inventories. While Gold ETF’s are a gold investment vehicle, there is speculation that some (or a large percentage) of the Global Gold ETF inventories may be fictitious or oversubscribed. By the term oversubscribed… it refers to the notion that there are more than one owner for each ounce.
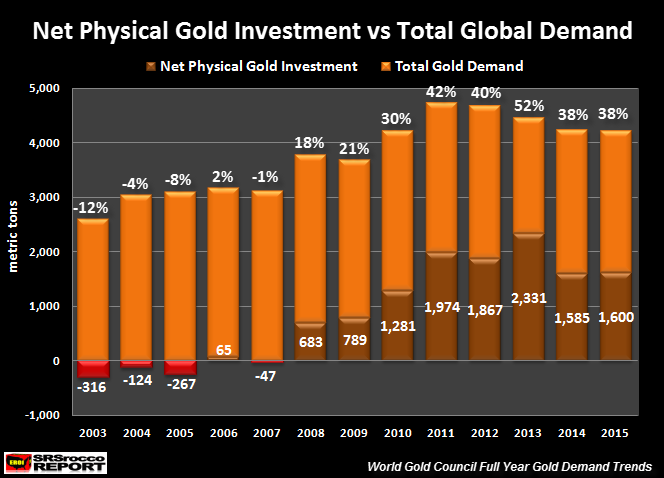
To get an idea just how significant the trend change of net physical gold investment has been over the past several years, I created the chart below:

Basically, I took total physical Gold Bar & Coin demand for the year, subtracted or added Central Bank net purchases and divided it by total demand. In 2003, total world Gold Bar & Coin demand was 304 mt and Central Bank gold sales were 620 mt for a net decline of total physical gold investment of 316 mt for the year. Thus, net physical gold investment for 2003 was a negative 12%. Which means, there was a 12% net disinvestment of physical gold in 2003.
I know this may sound a bit obtuse, but Central Bank gold sales are a liquidation of Central Bank reserves. Furthermore, most of this Central Bank gold sales were used to supplement the overall market including Jewelry, Bar-Coin and Technology demand.
For example, here is the breakdown for 2003:
2003 Global Gold Demand
Jewelry = 2,484 mt
Technology = 386 mt
Bar & Coin = 304 mt
Total = 3,174 mt
Central Bank sales = -620 mt
Total Demand = 2,554 mt
Even though total world gold demand was 3,174 mt in 2003, Central Bank sales of 620 mt had a negative impact and lowered overall demand down to 2,554 mt.
As we can see from the chart above, net physical gold investment was actually negative or very low (2% in 2006) before the U.S. and World financial and economic markets collapsed in 2008-2009. As Central Bank gold purchases increased after 2010, so did Gold Bar & Coin demand.
Let’s look at the peak year… 2013:
2013 Global Gold Demand
Jewelry = 2,673 mt
Bar & Coin = 1,706 mt
Central Bank = 625 mt
Technology = 354 mt
Global ETF change = -915 mt
Total = 4,443 mt
Here we can see that in ten years, there has been a significant increase in Gold Bar & Coin and Central Bank purchases. In 2003, net physical gold investment (Bar & Coin – Central Bank sales) was a negative 318 mt versus a positive 2,331 mt in 2013. Thus, net physical gold investment in 2013 accounted for a record 52% of total demand.
NOTE: I did not use changes in Global Gold ETF’s in creating the “Net Physical Gold Investment” in the chart above, but I did use the total demand figures from the World Gold Council which were adjusted due to builds or declines of Global Gold ETFs.
Why is this so important? Before 2008, net physical gold investment was minuscule or actually negative when we factor in Central Bank gold sales. Even if we took total Gold Bar & Coin demand of 304 mt in 2003 and divide it by total demand of 2,594 mt, it would only equal 12% of total gold demand that year.
Regardless, Central Banks dumped gold onto the market to suppress the price and help supplement the market. Now that Eastern Central Banks are net buyers of gold as well as the elevated Gold Bar & Coin demand, total net physical gold investment is consuming nearly 40% of total demand compared to the single digits prior to 2008.
Western Central Banks realize the price of gold determines demand, which is why they had to resort to knocking the price down from $1,600 to $1,150 at the beginning of 2013. Even though demand picked up significantly in 2013, there was available stocks to loot from above ground stocks such as the GLD ETF to meet this demand.
However, I believe the real Western Central Bank strategy was to continue slowly pushing the price down lower to keep gold off the RADAR from the Main Street Investor. There is speculation that China may be apart of the market rigging of gold, but it’s to their benefit in the long run, not the Western Central Banks.
There is one thing that I have not factored into the equation. A lot of global jewelry demand is by Indians. India consumed 654 mt of gold jewelry in 2015. I would imagine most of this would be considered a “Store of Wealth”, rather than something used for adornment purposes only. Yes, it’s true that the Chinese (and to lessor extent, Americans) purchased a lot of gold jewelry in 2015. And yes, this gold can be sold back into the market at close to spot price if the owner is clever.
That being said, Indians view gold jewelry more as a store of wealth, than do the Chinese or Americans. While some Chinese may be buying gold jewelry as a store of wealth, more Chinese have become like Americans and enjoy wearing gold more as adornment purposes.
Lastly, we must remember, nothing has changed since Lehman Brothers and Bear Stearns went bankrupt in 2008. The situation in the financial system is much worse than it was in 2008. I hear from several precious metal dealers that the wealthy investors are buying a lot of gold since the price spiked 5% in one day last week.
I believe 2016 will turn out to be an interesting year for the precious metals. Today, the price of gold is up $30 at $1,238. While the bullion banks continue to control the paper price, the new ABX fully allocated precious metal exchange will likely cause some real trouble for the Western Central Banks.
It wouldn’t take much of an increase of physical gold investment buying to totally overwhelm the market. Keep an eye out for possible fireworks in the precious metal markets this year. If this occurs, there is a good change that it may become impossible to acquire physical gold and silver.
Please check back for new articles and updates at the SRSrocco Report. You can also follow us at Twitter below:

| Digg This Article
-- Published: Friday, 19 February 2016 | E-Mail | Print | Source: GoldSeek.com

