-- Published: Sunday, 20 March 2016 | Print | Disqus
By Jordan Roy-Byrne, CMT
Gold and gold stocks have refused to correct for more than a few days at a time. Weakness is being bought and quickly. Gold has gained over $200/oz but not corrected by more than 6%. The miners (GDX) have endured three roughly 10% corrections in the past six weeks but nothing greater. A few weeks ago we noted a comparison to the 2008 rally which hinted that miners could correct 20% before moving higher. So far, no dice. Many gold bulls continue to expect a correction while losing sight of the bigger picture: precious metals are in a new bull market.
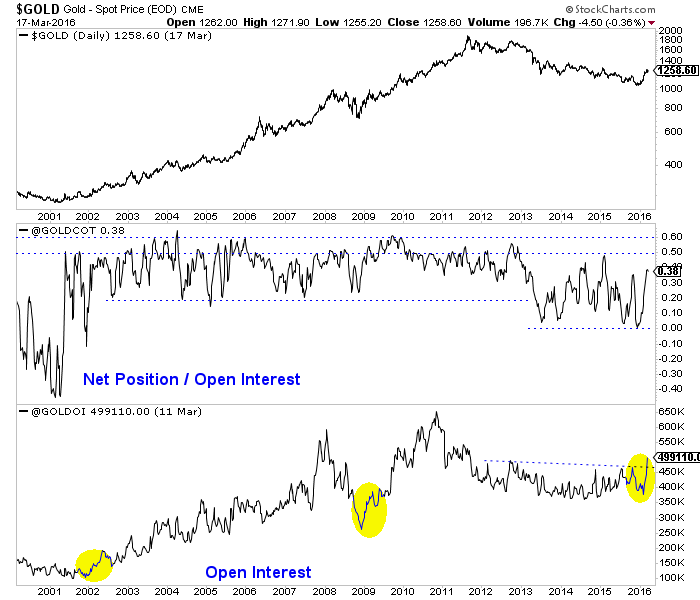
Many have expected a correction due to the CoT, which shows a net speculative position of 37.6% of open interest. While this figure appears high, we should note that from 2001 through 2012 the net speculative position often peaked from 50% to 60%. Moreover, everyone has completely missed the rise in open interest, which reached a more than 4-year high! Open interest is not a leading indicator but a confirming indicator. Strong increases in open interest validate the strong increases in Gold. The recent increase in open interest mirrors the increases that followed the 2001 and 2008 lows in Gold.

Gold & Gold CoT
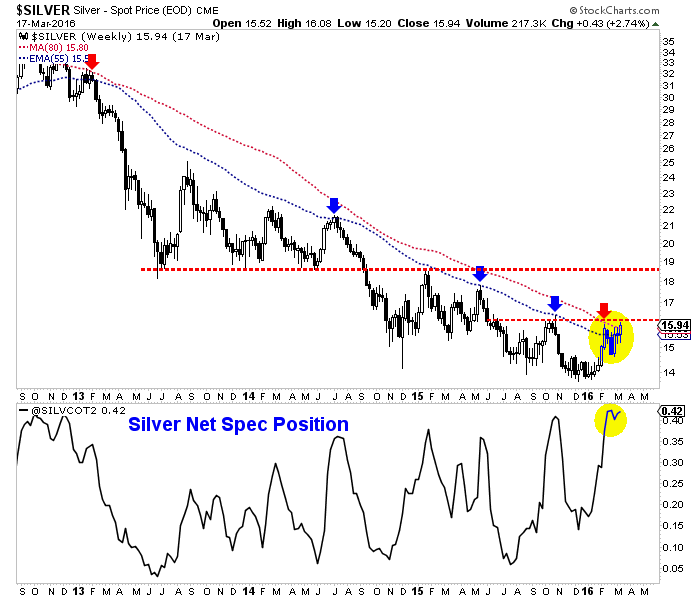
Silver is also defying “conventional” CoT analysis. In recent weeks, Silver’s net speculative position of 43% actually was the highest in more than 5 years! That means Silver has to decline, right? While Silver hasn’t broken above $16/oz yet, it closed above its 80-week moving average (by a penny) for the first time since 2012. Moreover, the recent strength in Silver stocks strongly argues that Silver will move higher. Look for an upside target in the mid to high $18s.

Silver & Silver CoT
There are two problems with the recent, widespread conventional analysis of the CoT. (By the way you can’t swing a dead cat without hitting a “bearish CoT” article or blog post in the past few weeks).
First, bullish and bearish parameters have to adjust during a trend change. In a bear market sentiment usually reaches “extremely bearish” before that market can rebound. Also, even neutral or slightly bullish sentiment is enough to bring about more selling. In a bull market it is the opposite. Sentiment can get really bullish before that market corrects.
The second point is sentiment analysis can be tricky and counterproductive when a market has just made a major trend change. An extreme sentiment reading during a brand new bull trend is often a false signal because the majority remain on the sidelines. This is why new bull markets recover quickly and remain overbought for months amid bullish sentiment.
Here are some examples. Recall the huge moves equities made from the 2002 and 2009 lows. Following its 2002 low the Nasdaq rebounded 94% in 15 months and only endured one real correction (15%). Following its 2009 low the Nasdaq rebounded roughly 100% in 13 months and never corrected more than 9%! Gold, following its 1976 low rebounded roughly 62% over the next 15 months and its worst correction was 11%. Gold from its 2008 low rallied roughly 45% in five months and only endured one 10% correction.
Where are we now?
As we noted last week, if Gold follows the path of the 1976 and 2008 rebounds then it would soon reach $1400/oz and continue to reach higher levels in the months and quarters ahead.
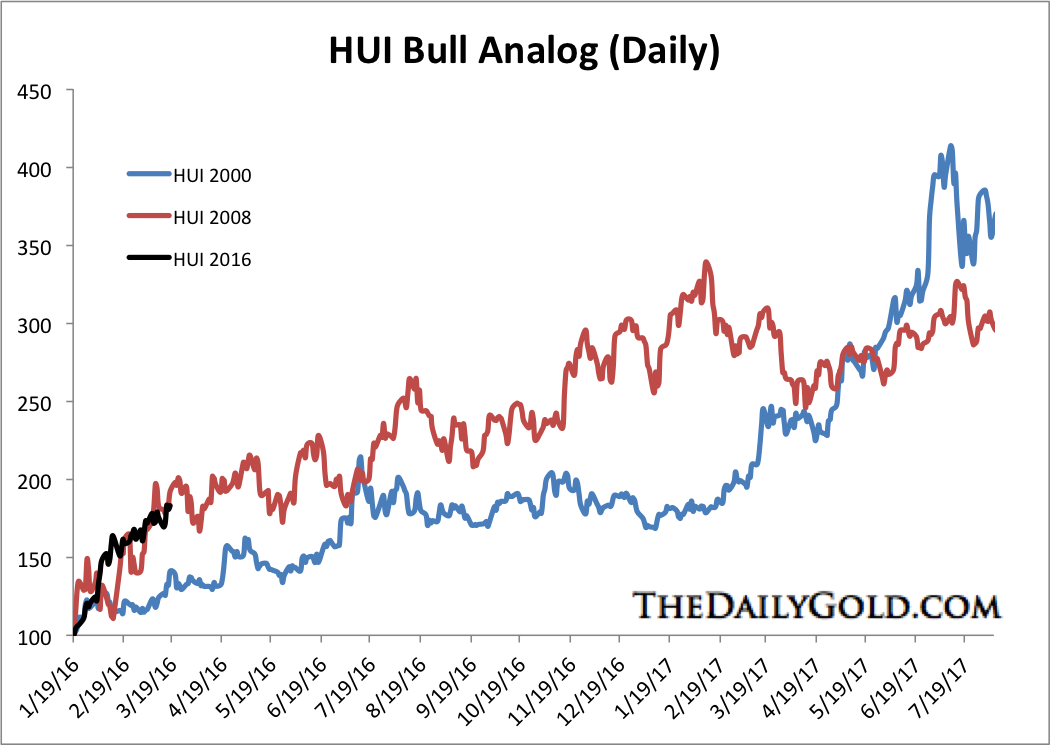
Meanwhile, the gold stocks are certainly overbought but history argues they could trend higher in the months ahead. Note the bull analog chart below. If the HUI follows its 2008 path then it would gain 46% over the next five months and 88% over the next 11 months. If the HUI follows its path after its 2000 bottom then it would rally 128% over the next 16 months.

HUI Bull Analog
While it is very difficult to buy into a market that has already gained substantially, history argues that the larger risk is staying out of that market especially if it only recently made a major bottom. The epic “forever” bear market of 2011-2015 lingers in the minds of many and that is why it is so difficult to believe the recent strength can continue. Hence, many continue to apply bear market thinking and bear market parameters without realizing the sector has made a major character change. That doesn’t preclude the likelihood of pullbacks. We even made a solid case two weeks ago for GDX to correct 20%. It will come to pass soon or later. Going forward, look to accumulate select shares on weakness. Buy and hold. You don’t make money in a bull market by trading. Consider learning more about our premium service including our favorite junior miners which we expect to outperform in 2016.
Jordan Roy-Byrne, CMT
Jordan@TheDailyGold.com
| Digg This Article
-- Published: Sunday, 20 March 2016 | E-Mail | Print | Source: GoldSeek.com

