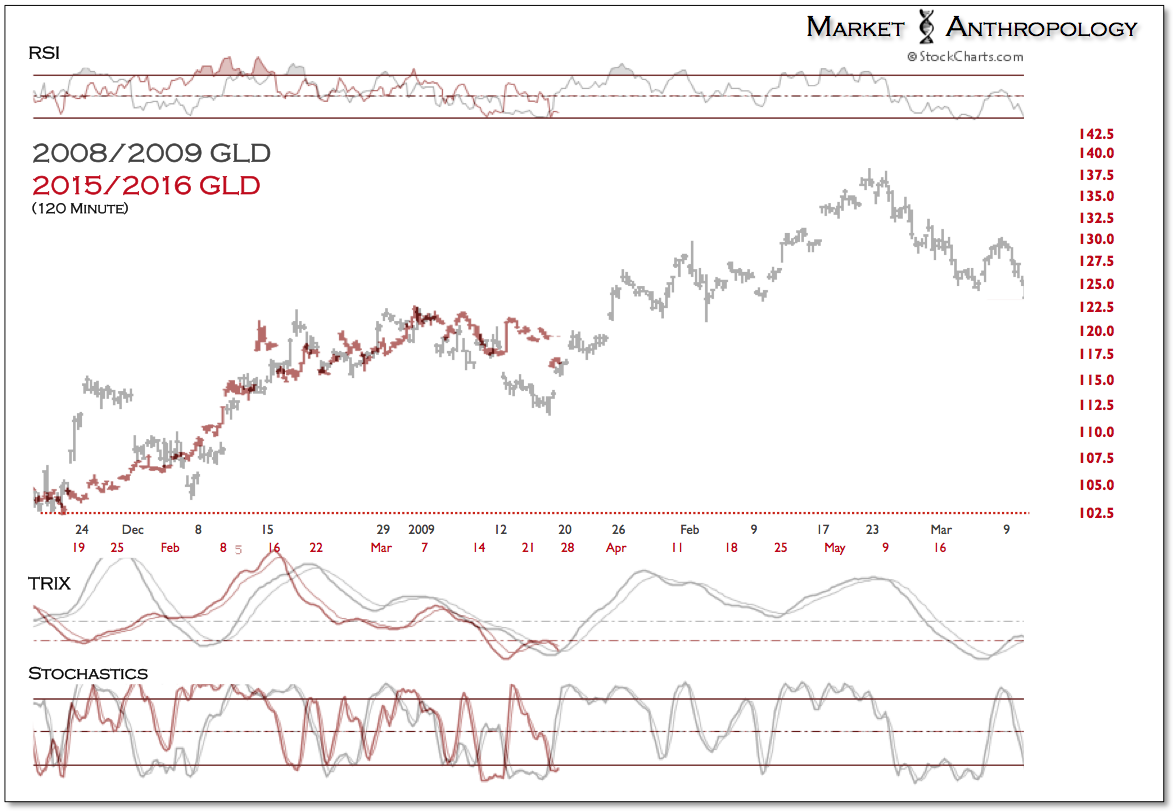
From an intermarket perspective, we will continue to follow the dollar relative to gold as an indication that the retracement move has run its course or if our longer-term expectations towards gold and commodities in general needs to shift.
Although we suspect a majority (~70%) of the downside in gold was accomplished through this morning's early session estimates of the comparatives that we incorporate for spot prices, the miners and the dollar suggests the retracement move and consolidation could extend through May. As always, these comparatives are referenced as guides within a broader research outlook and will yield bias to current market conditions or seek to adjust when deemed necessary.
Sizing up the moves in gold relative to the US equity markets over the past year, wed contend that gold has not only led the broader reflationary trend, but pivots in the equity markets as well.
Click to enlarge all images

We've speculated, however, that a principal difference in market structure to-date is as commodities have put in a cyclical low with inflation expectations; US equities are carving out a cyclical peak. Meaning, although stocks may be loosely following golds leading pivots, as gold makes higher highs equities would make lower highs. This dovetails into our work with the miners and the financials over the past several months.

That said, we certainly did not expect the retracement rally in stocks to extend nearly as high as it has, despite noting in the second week of February that the bulls might find support from golds leading move.
Hindsight 20/20, the upside in the S&P 500 appears limited even as breadth has markedly improved which wed argue is primarily due to rising inflation expectations and the broadening performance in the commodity markets, rather than an underlying improvement towards equities overall. And while the economy today may benefit from a boost in inflation expectations (see Here), the corresponding cyclical pivots in the commodity and equity markets harkens back to the late 1940s when the Fed and Treasury ended their active support after undertaking similar large scale asset purchase programs.
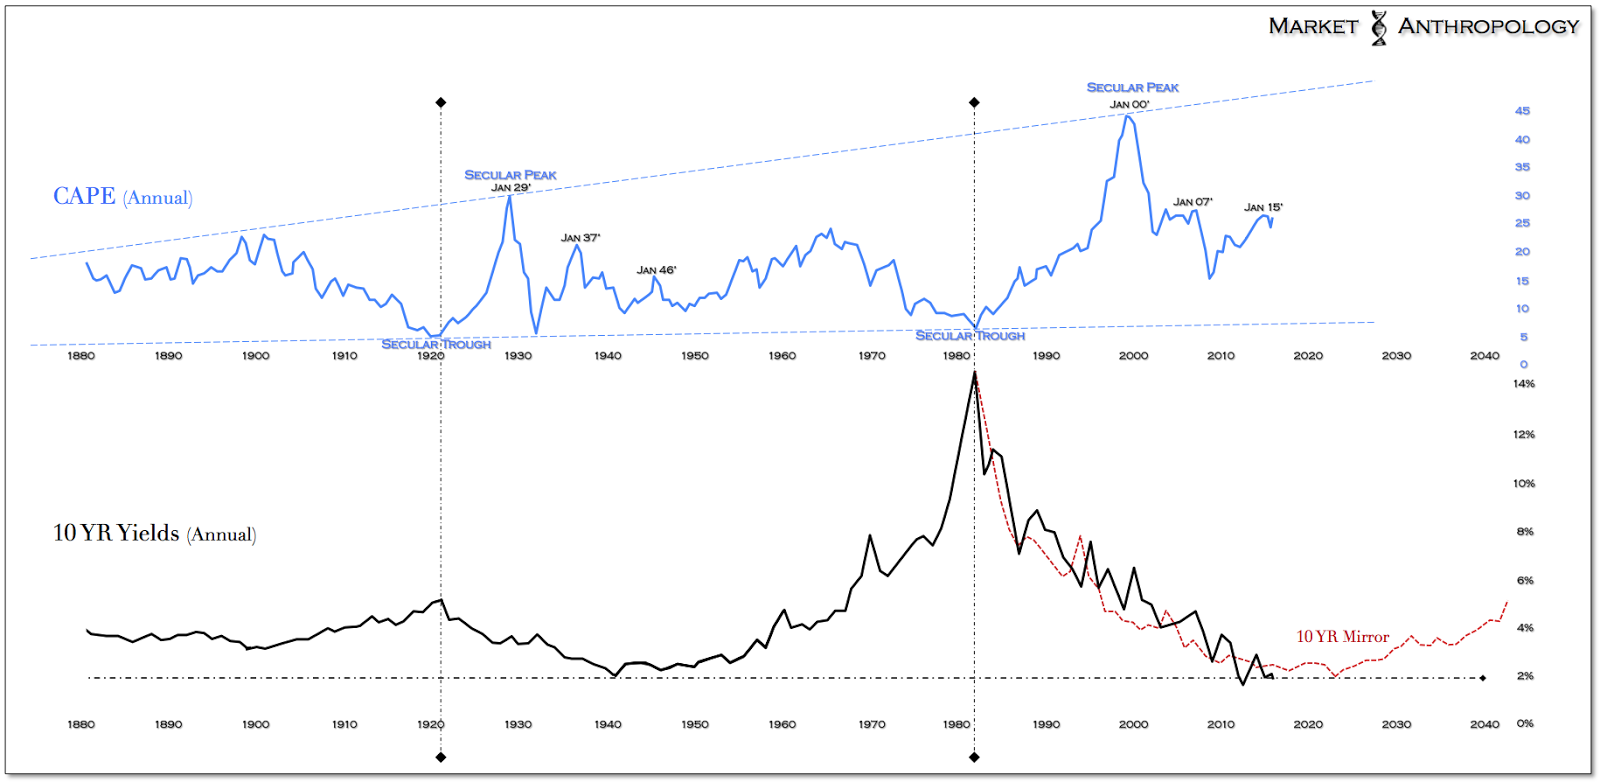
Longer-term, we continue to defer to the broader cyclical patterns in CAPE and yields that has pointed towards a revaluation in equities lower and a prolonged market environment of historically low yields akin to the long normalization in the markets that took place in the late 1940s following the Fed and Treasurys extraordinary support after the Great Depression and World War II.
Although some participants and economists largely ignore this period precisely because they perceive it as so unlike any era before; when normalized through the broad context of the long-term yield cycle we would argue it is the closest market corollary. Historically speaking, we find that the long-term yield cycle distills and weighs most variables as it ultimately represents expectations on the cost and demand of capital. Considering our comparative thoughts on yields (see Here), the 1940's holds relevance with today.
Moreover, the parallels extend in relation to equity market cycles, valuations, debt/GDP, monetary policy and hence we believe share similar underlying market psychologies with today. Although the financial crisis this time around led to the significant expansion of the Feds balance sheet, from a capital expenditure perspective the ongoing War on Terror since September 11, 2011, is the second most costly of any military engagement in US history (inflation adjusted) behind World War II (see Here).
Nevertheless, while economists still dispute the merits or policy mistakes from the 1940s, a few key market takeaways from this period that we believe still hold practical insights with today are:
- The cyclical move higher in equities that corresponded in 1942 with the beginning of the Fed and Treasurys LSAP programs exhausted in 1946 as they ended extraordinary policy support.
- The cyclical move lower in equities corresponded with a return of inflation, another move lower in real yields and a cyclical move higher in the commodity markets.
- Despite rising inflation, Treasury yields remained historically low as real yields fell sharply.
- From a total return perspective, the S&P 500 fell back to its breakout levels from around 1945 and remained range bound for nearly 3 years before the secular move higher in yields and equities began as the decade came to a close.
Our general interpretation of this period which we find resonates with today, is it delineated the final phase of transition between the long-term yield and growth cycles and where the influence and intervention of monetary policy reached its zenith within the market.
Following the conspicuous support of the financial markets through 1946, participants still held strong recency biases to the previous declines of the Great Depression. When the positive effects of policy support disappeared and the equity market cycle turned down, participants did not trust the market or expect inflation to rise as precipitously as it did from the trough going into 1947 and 1948. They by and large expected a downturn commensurate with the two previous severe cyclical declines and another wave of deflation.
As we noted in the past, Milton Friedman and Anna Schwartzs had the following observations of this period in - A Monetary History of the United States.
"Despite the extent to which the public and government officials were exercised about inflation, the public acted from 1946 to 1948 as if it expected deflation."
"An important piece of evidence in support of this view is the harbinger of yields on common stocks by comparison with bond yields. A shift in widely-held expectations toward a belief that prices are destined to rise more rapidly will tend to produce a jail in stock yields relative to bond yields because of the hedge which stocks provide against inflation. That was precisely what happened from 1950 to 1951 and again from 1955 to 1957. A shift in widely-held expectations toward a belief that prices are destined to fall instead of rise or to fall more sharply will tend to have the opposite effect - which is precisely what happened from 1946 to 1948." - Milton Friedman and Anna Schwartz, A Monetary History of the United States, 1963
In hindsight, what participants did experience was a revaluation in equities, as markets slowly normalized from a lengthy period of extraordinary support and intervention. Although the initial correction was significant in 1946 (~26 percent), the economy did not fall into the greater fear of another depression, but muddled through and was range-bound over the next three years as the economy traversed the yield trough to its next major growth cycle and as markets struggled with bouts of inflation and a less proactive and accommodative policy posture.
_______________________________
As a postscript towards our perspective on CAPE and the long-term yield cycle, we offer the following observations:
- The exhaustive highs in the yield cycle (21' & 82') corresponds to the valuation troughs in the ratio.
- The valuation range of the ratio appears proportional to the size of the long-term yield cycle. I.e., the greater yields were pulled (higher) the higher the valuation range was subsequently extended. To this point, we note the congruence and timing between the two broader cycles with the yield peaks made in 21' and 82' (Jan 1st data) and the lagged reflex and explosive drive higher of the ratio directly following the pivot lower in yields. Yields rose for 20 years leading up to the peak in 21' and the equity market subsequently exploded higher for ~ 8 years leading up to the 29' high. In the most recent cycle, yield rose for ~ 40 years to a peak in 82' and the equity markets enjoyed the historic disinflationary open road for ~ 18 years leading up to the valuation peak in 00'.
- One way to look at the relationship and lag between the series is that the ratio trends with the yield cycle for a period until higher yields and inflation expectations put downward pressures on equity prices, thus creating the pressure differential described above that's eventually released with proportional inertia subsequent to the cycle high in yields.
- Similar to what is found in other wide-angle asset panoramics, the relative range of Shiller's PE isn't static, but broadening with a rising lower and upper range. We would argue the drift higher in valuations is primarily a result of the expanded range of the current yield cycle.
- As often the case with major crashes, the outlier effect to the broader cycle muddles the interpretive tea-leaves going forward. Having said that and although they didn't occur at the same point or present with equal magnitude (33'>09'), we view the extended dislocations from the equity market crashes (29-33' & 08-09') as relative outliers with respect to the ratio calculation but view them nonetheless with wide peripheral vision to the broader flow and bearings of equity valuations within the respective cycle. Moreover, it doesn't make much sense to us to compare absolute valuations between cycles because of how the ratio is calculated based on a smoothed 10 year inflation-adjusted metric and the difference in size and magnitude between the respective yield/inflation cycles.
Overall, we've viewed the Feds policy actions this time around helping to push equities up to a valuation ceiling in CAPE around the previous peak in 2007. Although we believe from a proportional understanding of the relationship between the long-term yield cycle and CAPE it doesnt make much sense to compare absolute valuations between periods; from a cyclical and pattern perspective, the mid to late 1940s offers the closest corollary - as valuations ultimately were capped by a cyclical move higher in inflation as markets and the economy began to normalize from extraordinary policy support.
Similar to how the Fed and Treasury's actions in the first half of the 1940s broadly smoothed the transition in the economy from the Great Depression and World War II, we expect the US to muddle through this next phase as real yields in the long-term cycle move lower one last time. And what's the most benevolent asset class to speculate and invest in with declining real yields? With semantic liberty and as Mr. McQuire in the Graduate points out:
Mr. McGuire: I want to say one word to you. Just one word.
Benjamin: Yes, sir.
Mr. McGuire: Are you listening?
Benjamin: Yes, I am.
Mr. McGuire: Commodities.
Benjamin: Exactly how do you mean?
Mr. McGuire: There's a great future in commodities. Think about it. Will you think about it?