Today I would like to show you some more charts on some if the different stock market indices we looked at in the last Weekend Report. Last weekend we looked at a lot of the bull market uptrend channels that are still in place since the 2009 crash low. Its always important to keep an open mind no matter how strongly we believe things to be when it comes to the stock markets. Everyone cant get in at the bottom and everyone cant get out at the top and then there is the consolidation phase that trips up both the bull and the bears alike.
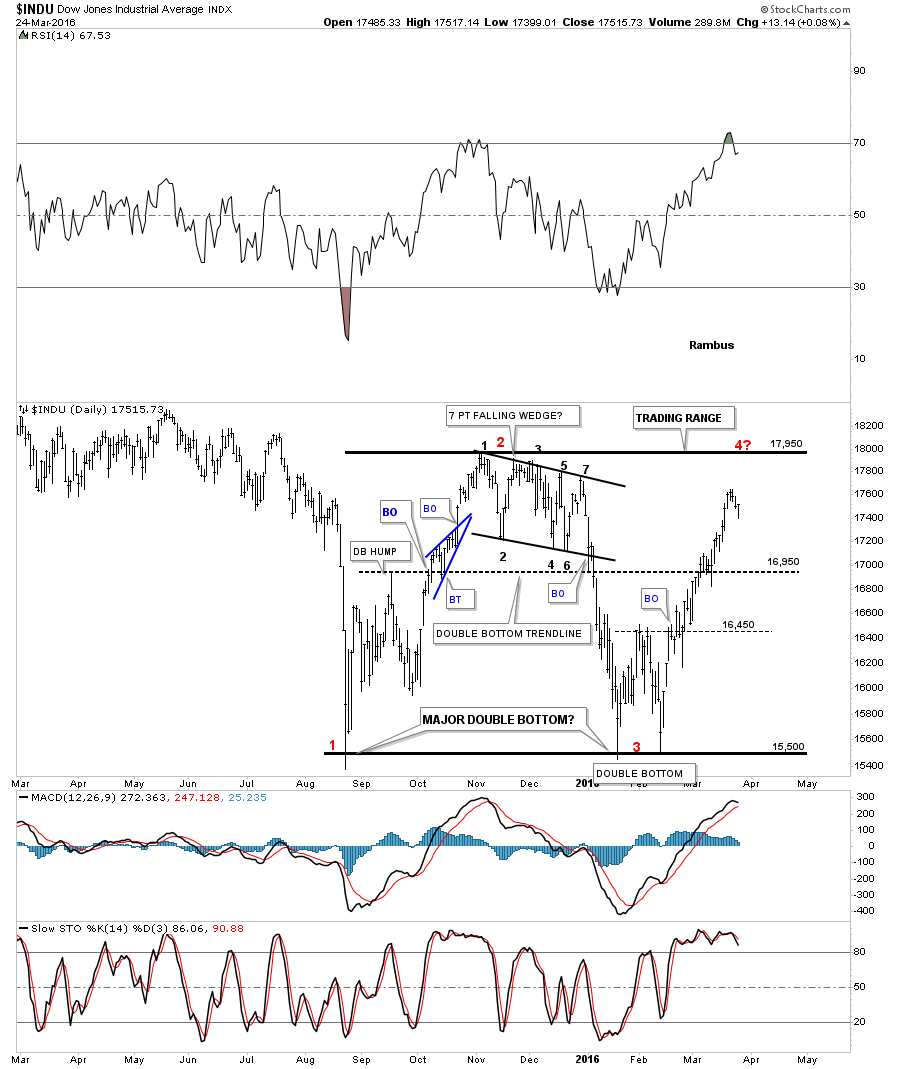
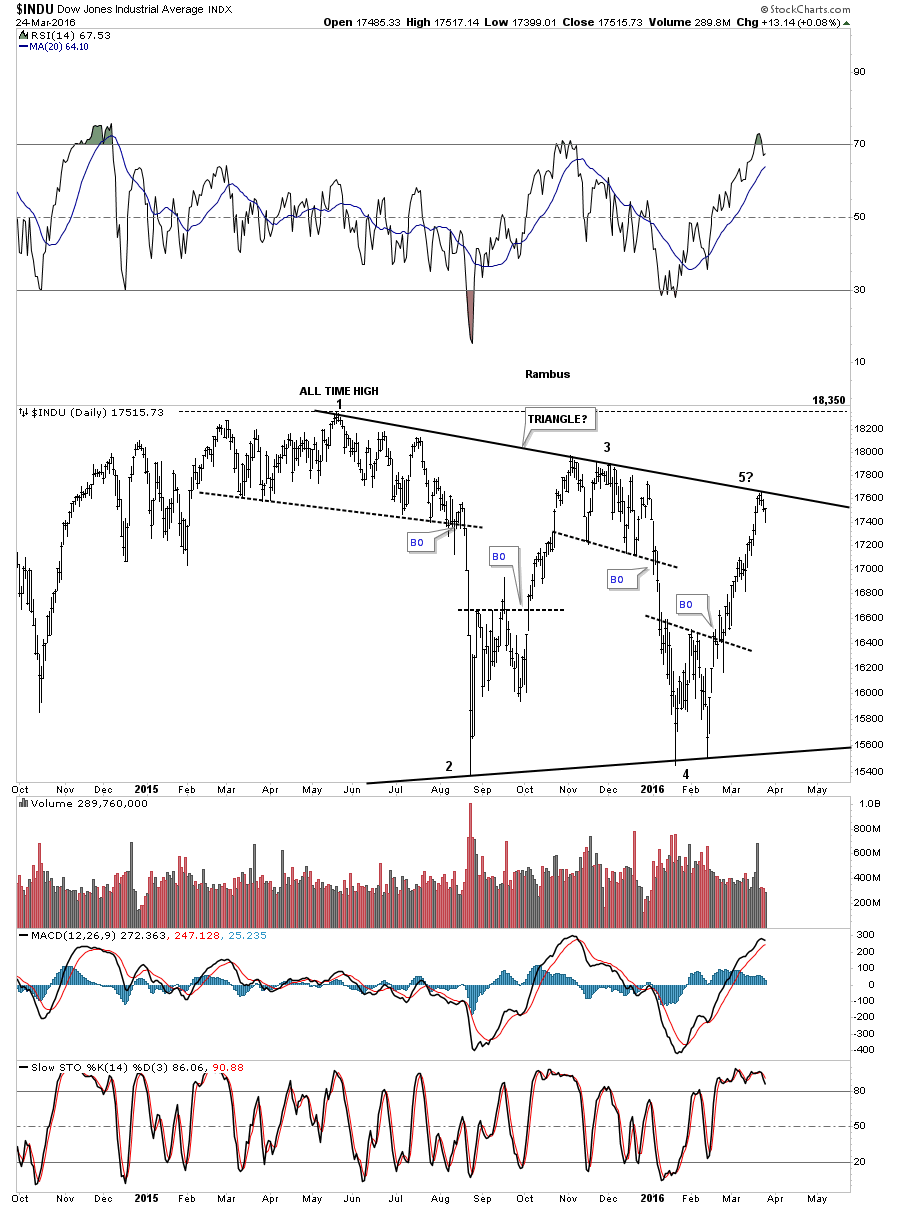
Lets start with a daily chart for the INDU which Im showing a large trading range that began during last Augusts big decline labeled with the red #1. The INDU then rallied back up to the 17,950 area, red #2, and started to form that seven point bearish falling flag which I thought was going to be a bull flag until the price action broke below the bottom rail which led the second low in January and February of this year which formed a double bottom, red #3. The INDU has rallied strongly again and is within 435 points of reaching the top of the trading range again. Just for argument sake, if the INDU reaches the top of the trading range it will have completed the third reversal point at 17,950 which would be an odd number of reversal points creating a possible big double bottom. Keep in mind this is only one scenario at this time and there is a lot of work to do before we can even begin to call the price action a double bottom.
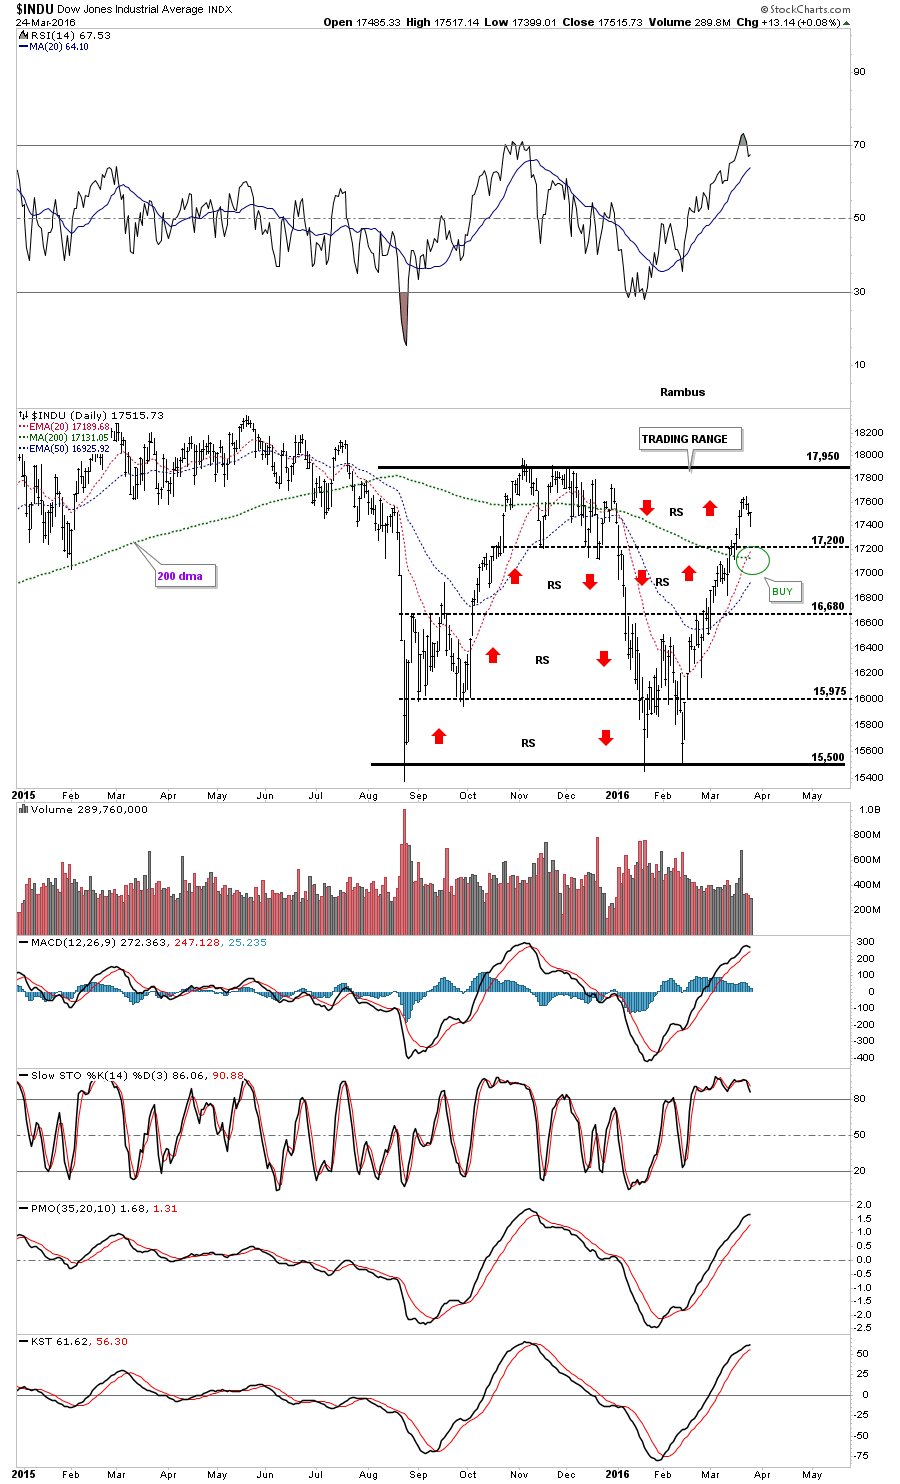
Below is basically the same chart as the one above which has the moving averages on it. This past week the 20 day ema crossed back above the 200 day simple ma with the 50 day ema now rising strongly. During big trading ranges like this its not uncommon to see them cross back and forth before either the bulls or the bears setup the next impulse move out of the trading range. Once that happens they will get a nice alignment to them that will show the impulse move.
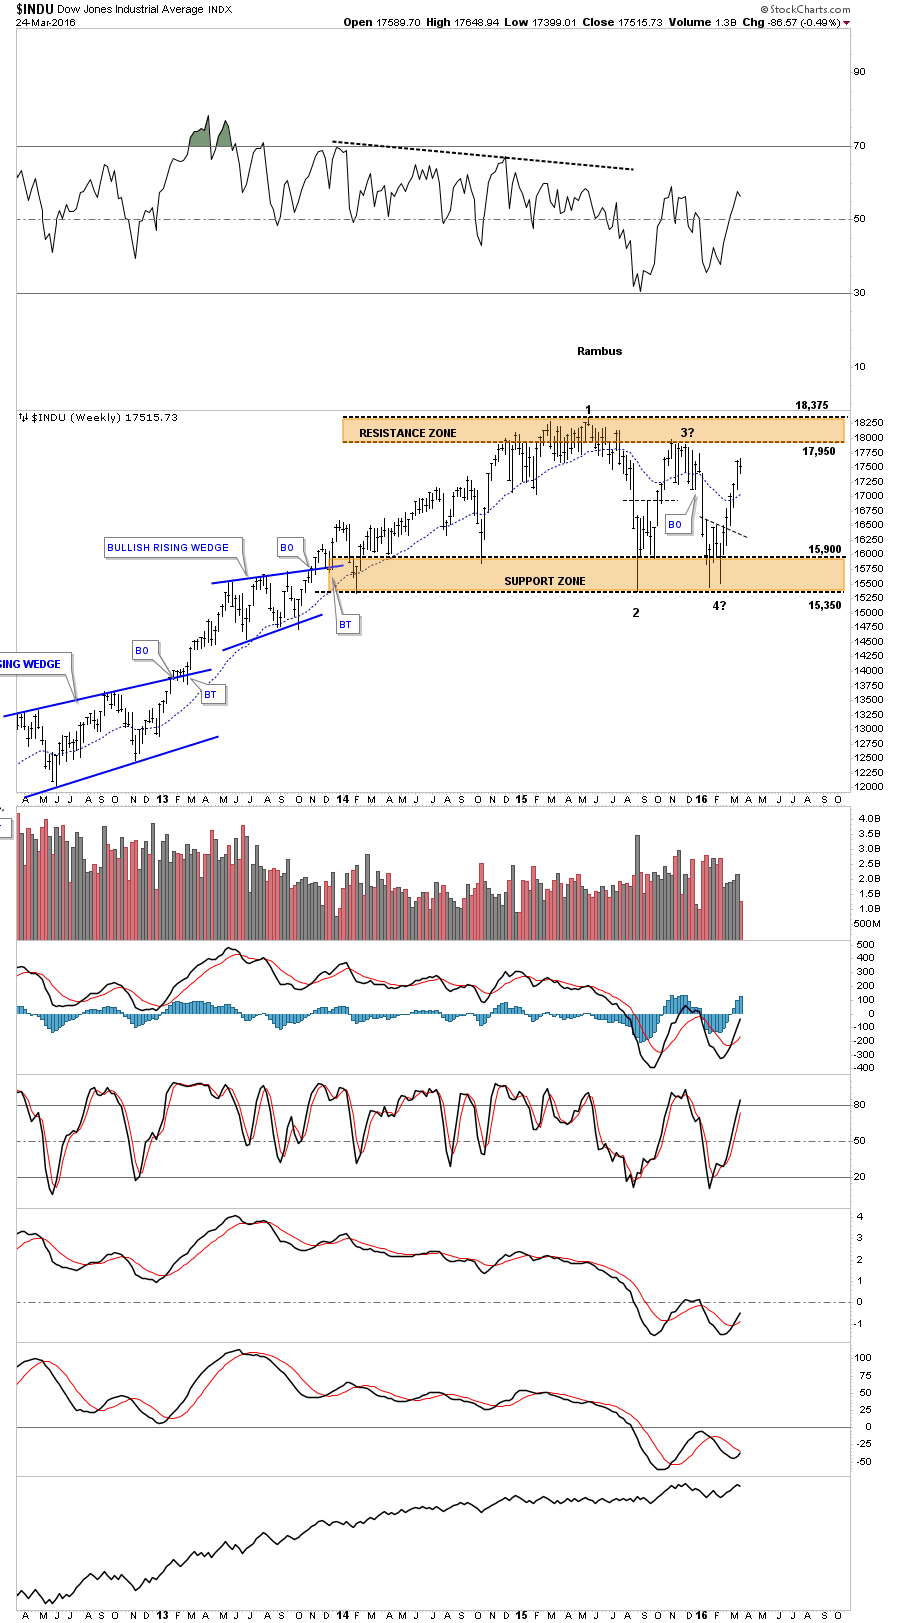
This next chart is a weekly look at the INDU which shows an even bigger trading range going back over two years. Its not the cleanest trading range Ive ever seen but the brown shaded support and resistance zones, as large as they are, have held on multiple test. As strongly as the bears have tried they have not been able to move the INDU below the bottom of the support zone on numerous occasions starting way back in 2014. No matter how bearish things become, when the price action is trading down in the support zone the bulls manage to find a way to rally the INDU higher. The same thing is happening at the top of the big trading range at the resistance zone. One slight advantage the bears have right now is they have created a lower high at reversal point #3 which maybe deceptive as Ill show you in a minute.
I know many dont see this next daily chart for the INDU as a possible outcome but regardless of what I may think or anyone else for that matter a setup is taking shape that could blow the roof off the INDU. Last week the INDU tested the top rail of a possible triangle consolidation pattern and backed off a bit telling us its hot and to be respected at this point in time. This is a critical inflection point for both the bulls and the bears. The bears need to reverse the price action and create another leg down and complete the 5th reversal point which would make this a triangle reversal pattern to the downside. On the other hand if the bulls are in control they should be able to move the INDU above the top rail creating a triangle consolidation pattern to the upside. Again this scenario is still on the table with no confirmation in either direction yet but it gives us a road map we can follow which is better than no road map at all. This big trading range is going to be one of two things a consolidation pattern or a reversal pattern.
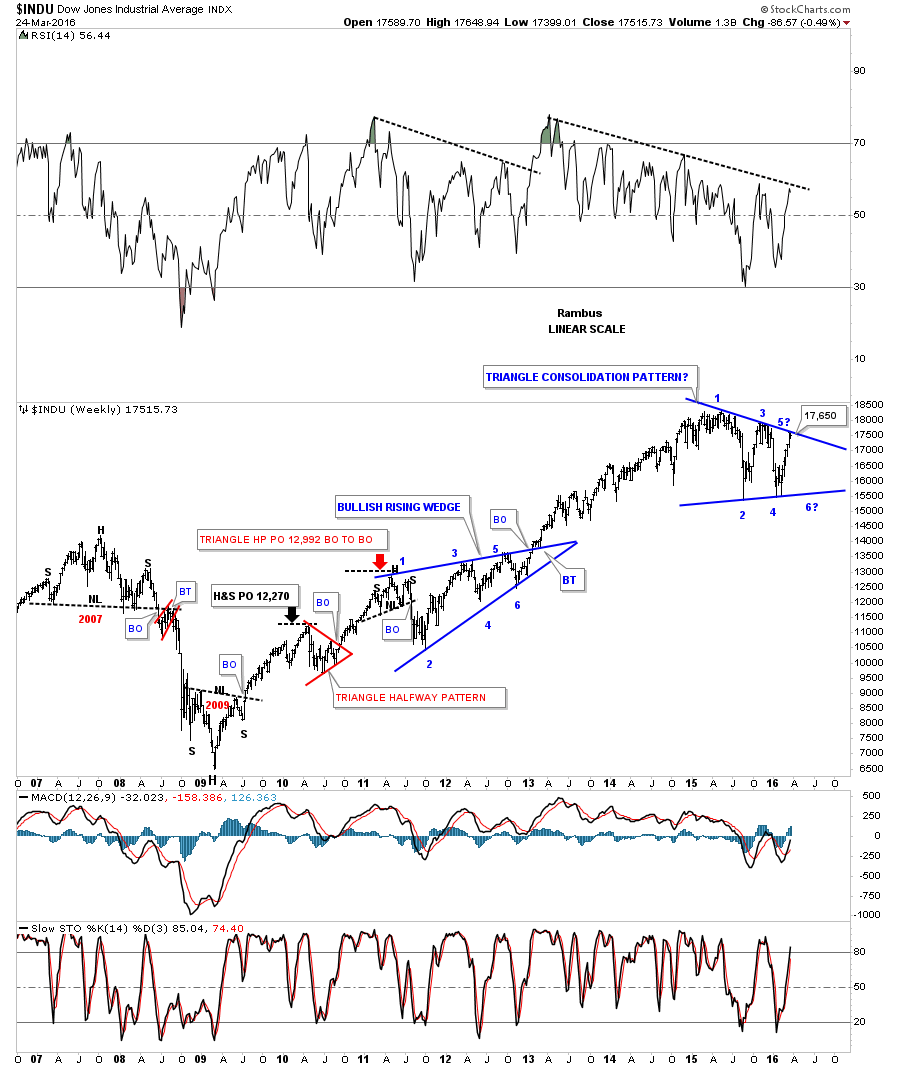
I would like to show you how this possible triangle consolidation pattern fits into the big picture of the bull market that began at the March 2009 crash low. As you can see from this longer term perspective the blue triangle pattern is showing an indecisive trading range with a lower high and a higher low. Until we see some type of reversal pattern form the bull market remains intact. Maybe the 5th reversal point will hold and the triangle will end up being the reversal pattern. But, and there is always a but, since the INDU is in a bull market until proven otherwise the odds favor a breakout to the upside. Its also possible that the INDU declines from this point but finds support on the bottom rail of the blue triangle forming a sixth reversal point similar to the bullish rising wedge which formed between 2011 and 2012.
One thing Ill be watching very closely over the next several weeks will be to see how the price action interacts with the top rail of the blue triangle. The perfect breakout scenario would be to see the price action hit the top rail and have a mild decline. Then if the bulls are truly in charge the next rally attempt would take out the top rail on heavy volume. Then for confirmation I would like to see a backtest of the top rail from above.
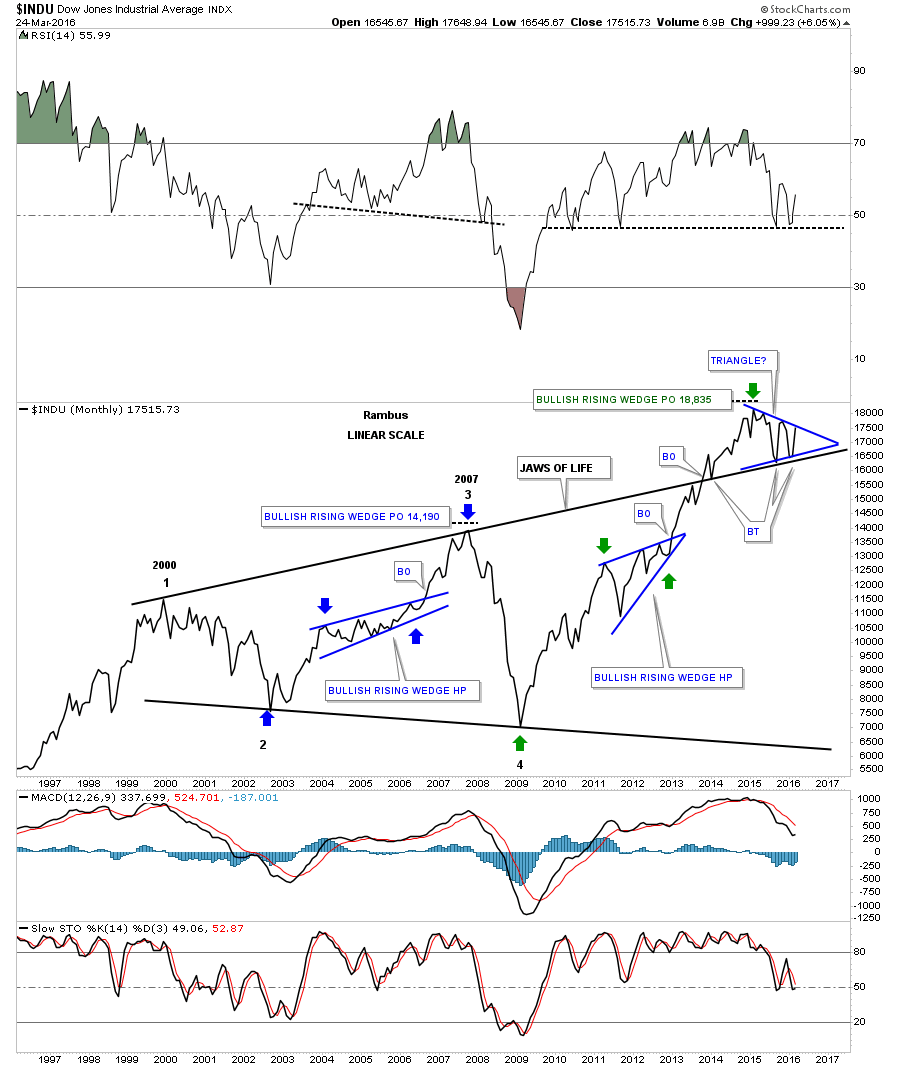
The 20 year monthly chart for the INDU does a good job of showing you the bull market that began in March of 2009. Until we see a reversal pattern form of some kind it is what it is until proven otherwise.
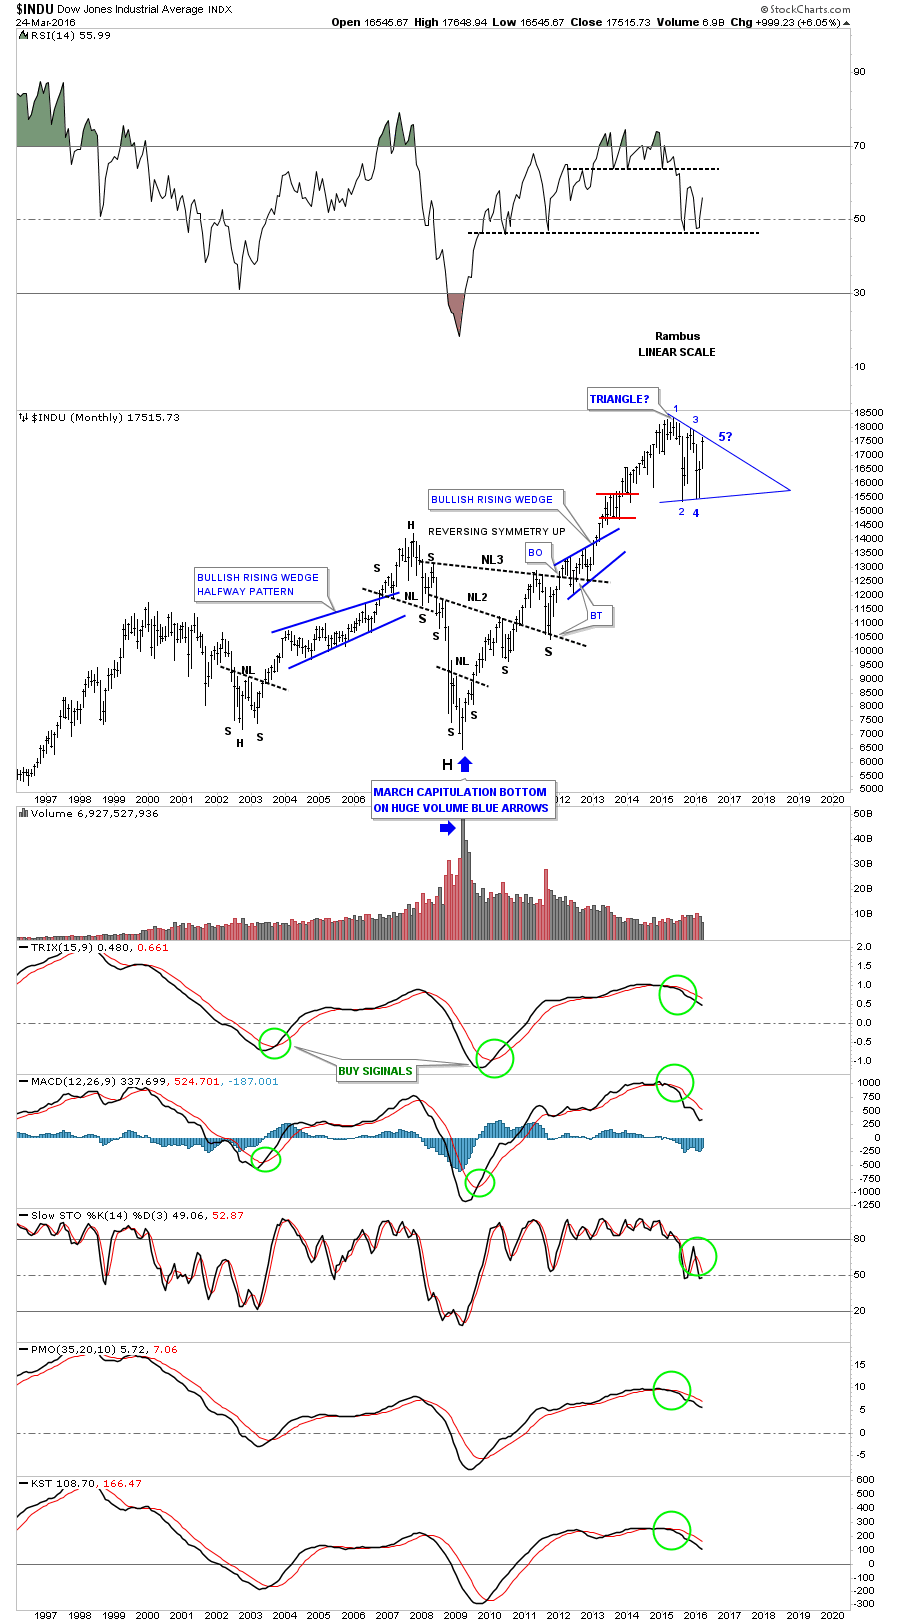
I promised myself I wouldnt post this next long term monthly chart for the INDU as it has been frustrating watching the breakout and backtesting process over the last several years when I first posted the bullish possibility. As long term members know I call this very large pattern on the INDU, THE JAWS OF LIFE, which is the opposite of how most analysis see it. Most call it the JAWS OF DEATH. You can see the blue triangle that is basically forming on the top rail which is generally a bullish development. This is about as clear a picture youll see anywhere on the long term perspective for the INDU.

This last chart for today is the exact same chart as the one above but this time Im showing it as a line chart. I really do know how bearish most folks are on the stock markets right now but when I look at this long term chart for the INDU I cant make a bearish scenario at this very moment. If anything it looks super bullish especially if the blue triangle gets broken to the upside. This isnt my opinion its what the charts are strongly suggesting.
Its time to go out and hide some Easter eggs for the Grand kids. Bottom line, keep an open mind to any eventuality that may arise. All the best Rambus