-- Published: Thursday, 31 March 2016 | Print | Disqus
By Daniel R. Amerman, CFA
Below is the transcript for the video. While the images are included below, the motion graphics and use of a pointer are quite helpful for conveying the information, and these can only be seen by watching the video.
Hello my name is Daniel Amerman, and thank you for joining me.
We are going to take a look using a number of visual images at what has been happening recently with the Federal Reserve, how this integrates with the federal government and the national debt, and the just extraordinary implications when it comes to retirement and other long-term investment decisions.
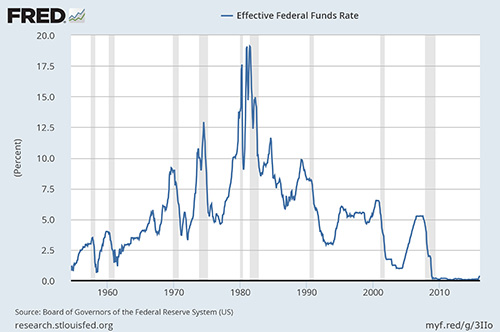
Our starting point is this graph from the Federal Reserve Bank of St. Louis, which shows the effective federal funds rate from July 1954 to February 2016.
As you can see it starts off very low in the 1950s and early 1960s, and then it goes in kind of a medium range, we could call them shoulders, between 1965 and the mid-1970s. There's a sharp peak from 1978 to 1982, and then we're back in that shoulder range from the mid-1980s through the late 2000s.
Then between September and December of 2008 during the very height of the financial crisis the rate plunged to almost zero in the space of four months and it has remained there or very close to there in the more than seven years since that time.
Now let's take a look at the dramatic increase in interest rates by the Federal Reserve that occurred in December of 2015 that has drawn such a tremendous amount of scrutiny and media and investment community coverage. But we're going to have to zoom in a bit to see it at all, because so far it has been so very tiny compared to Federal Reserve actions in previous cycles when they had decided to increase interest rates.
What the Federal Reserve originally communicated was that they intended to raise rates five times at about 0.25% each - four times during 2016 and once in 2015. And altogether those would've brought interest rates up from close to 0% to a little bit over 1.25% over the space of a little more than a year.
Which is still very small, very slow if we look at some recent cycles. The Federal Reserve moved interest rates in terms of the effective federal funds rate from 1.0% in May of 2004, to 5.25% in July of 2006, which was an increase of 4.25% in a little over two years.
The cycle before that, the Fed moved from 3.0% in January of 1994, to 6.0% in March of 1995, which was an increase of 3.0% in a little over a year. And of course if we go back to the mid-1970s and to the early 1980s there were far more dramatic rate increases in those times.
So even if the initial goals had been met that, still would've been a very minor increase by historical standards. However what the Federal Reserve has been most recently saying - and they have been changing their minds on a frequent basis there's no guarantees about this - but their current plans are that they might increase rates maybe twice in 2016, at maybe 0.25% each, and if they do indeed follow through that's still going to leave the effective federal funds rate below 1.0% by the end of 2016.
So why are they being so hesitant in seeking an answer?
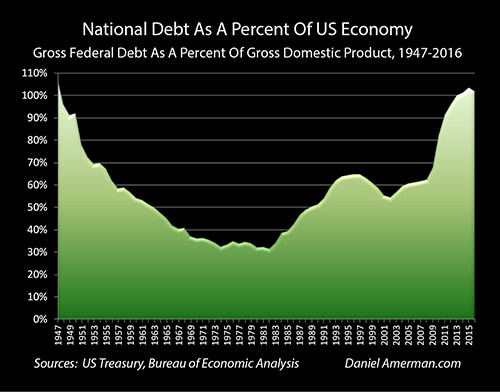
Let's take a look at this graph, which is in many ways the inverse of the interest-rate graph which we just looked at, and I'm going to suggest that that is no coincidence.
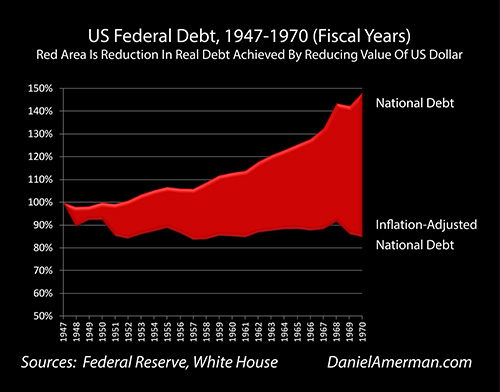
What this graphic shows us is the national debt as a percentage of the US economy. And you can see that it started very high, it was roughly equal to 100% of the US economy back in 1947. It was driven downwards, and as my long term readers know, I have extensive materials on how this happened, but it was driven downwards to below 30% by the early 1970s to the mid-1970sand then it started slowly climbing again.
And then we hit the financial crisis of 2008 and the deficit exploded relative to the ability to pay for it - which is relative to the national economy - as attempts were made to contain the economic damage from the financial crisis of 2008.
So let's look again at our interest-rate graph, and then our national debt affordability graph, and put them on screen together. There's a little difference in when they start - 1947 versus 1954 - but they are effectively the inverse of each other.
We have exceptionally low interest rates whenever the national debt is very high in real terms, in terms of affordability, in terms of the size the economy. And interest rates are only allowed to go very high when the national debt is comparatively low compared the national economy.
Those are the exact times where because the debt is much less, that higher interest payments on that debt become affordable.
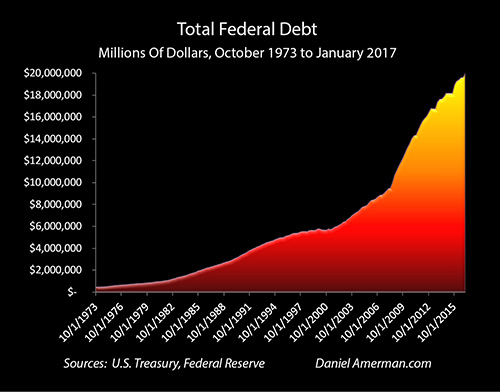
Now let's take another look at the total federal debt - just in dollar terms, we're not looking at compared to the economy anymore, and we see that explosion upwards in debt. Now shouldn't we be seeing an explosion upwards in interest payments on that debt?
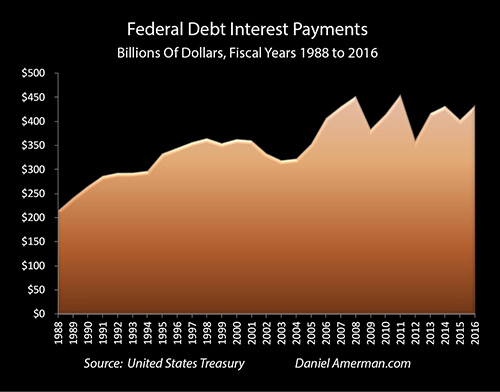
But when we look at this next graphic that isn't what is happening at all. Interest payments on the national debt stopped growing, and even went down in some years.
Now let's put both of them up on screen. How could interest payments stay flat or even decline while the national debt was exploding at the fastest rate in US history (outside of a major war)?
This is how!
When we add our third graph of the effective federal funds rate, and move back and forth between them, then we can really start to see what is happening here.
The debt exploded.
Interest rates plunged.
The increase in interest payments that would've otherwise sent the annual budget deficit in the early 2010s up to over $2 trillion year - was cut off and prevented from happening by the Federal Reserve.
So what would happen to annual deficits and the total federal debt if interest rates were to return to more historically normal levels?
The really important relationship to understand is that the United States government currently does not have enough income from taxes to make interest payments on the federal debt, not after paying for everything else in the federal budget. So what the US government does each year is it borrows the money to make those interest payments.
And that has in recent years been the single largest source of the annual deficit for the US government, which has been making interest payments on that very large national debt.
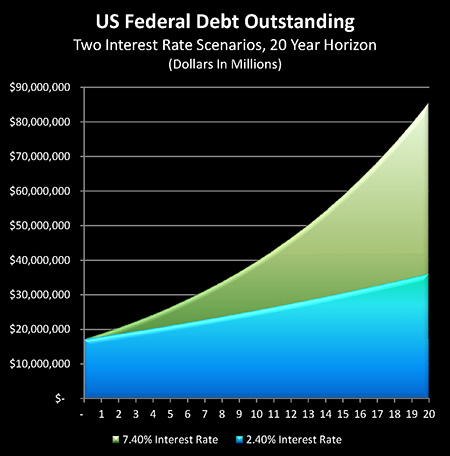
And if we look at this graphic we have two different interest rate levels that are being shown.
The blue area takes a look at what happens if our current interest rate levels stay the same indefinitely. The average interest rate that the US government pays on the federal debt is just a little over 2.4%, and because those interest rates are so low, the interest payments are very low.
And the national debt grows at a much slower pace, we're still up to $30 trillion - which is a big increase from today - by the time we're 20 years out but it is not just explosive.
However if we return to more historically normal interest rates, then we would have to borrow almost another trillion dollars a year to make interest payments, on let's say a 7.4% average interest rate on the federal debt. Which would be much more historically average if we're looking back let's say from today back to the 1950s.
And each year that we borrow that additional trillion dollars to make the interest payments, then our debt rises very rapidly, and the US government - as I've written about in some other articles - very rapidly develops a compound interest problem. So if we were to return to normal historic interest rates, instead of being above $30 trillion in 20 years, we would be above $80 trillion, and we would've passed the point of affordability long before then.
But that is far from worst-case scenario. What happens if the federal government really loses control of interest rates and we experience something like happened in the 1970sand 1980s?
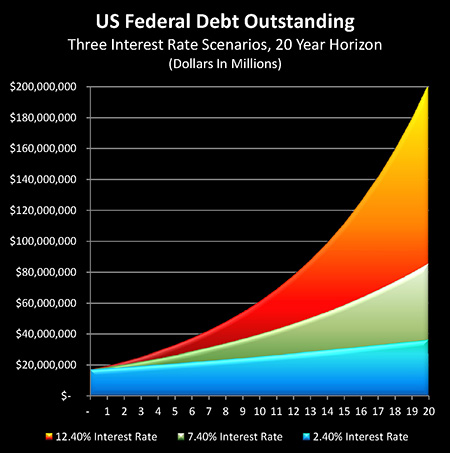
Well if we go up to a 12.4% average interest rate on the national debt, that sets off a compounding of interest that means the national debt explodes upwards to over $200 trillion in the next 20 years!
How do we avoid getting the national debt to $80 trillion, or to $200 trillion?
We come right back to what the Federal Reserve is doing right now. Which is keeping the explosion in the national debt from occurring, by keeping interest rates at very, very low levels, these low levels. Oh, they may issue press releases saying it's about economic growth - and that's a factor - but it isn't happening in isolation.
What the Federal Reserve and the federal government are doing, is the same thing they were doing the late 1940s and through the 1950s and 1960s, is keeping interest rates very low. Which keeps the national deficit from exploding.
However there is a very powerful effect on retirement investors, because the interest rate levels paid by the US government help determine interest rates in all categories for investors in the United States (and in other nations with their own national governments).
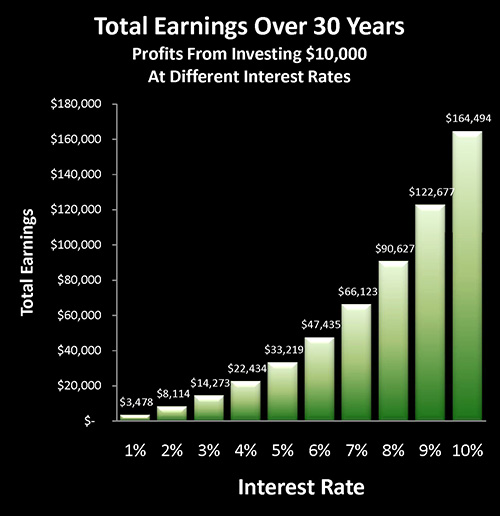
Now as we can see here, if we have a 5.0% interest rate and someone is investing $10,000, then they would expect to earn $33,000 in income over the 30 years. They start with the $10,000, they would earn the $33,000, they would have $43,000 available at the end of 30 years.
If we had 6.0% interest rates their income would be $47,000.
If we had 7.0% interest rates, like we have seen so much of recent decades, they could earn $66,000 in income.
However that's not where current interest rate levels are. We need to move way over to the left on this graph because interest rates are so much lower than they were.
If we go down to a 1.0% interest rate, which is still quite a bit higher than what you're going to earn let's say on a money market fund these days, or a very short term high quality instrument, an investor would only earn $3,478 off that $10,000 investment over a period of 30 years.
Let's go back and forth and examine what's going on here.
Because the national debt is so high as a percentage of the US economy, if we had a return to the historic interest rate levels that retirement investors are counting on, that would send the federal debt explosively upwards. Which is why it is highly unlikely to happen.
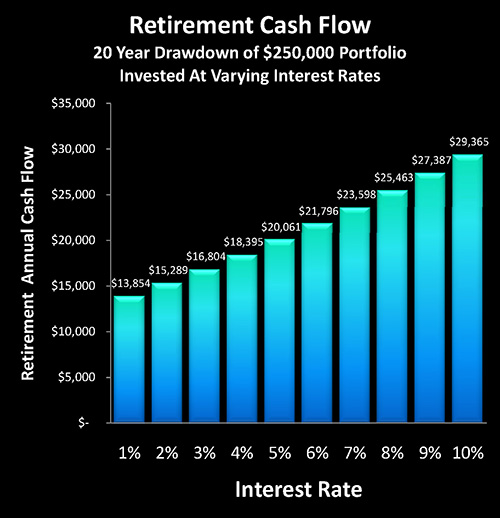
And if we're looking at someone who is already retired and is drawing down their retirement savings over time - and in this example were looking at a $250,000 portfolio being drawn down over an expected 20 year retirement with a more historically normal, even a little bit low 5.0% interest rate - they would be able to withdraw a little bit over $20,000 a year.
With a 7.0% interest rate it would be $23,000 a year.
With a 9.0% interest rate this retiree would have $27,000 a year in income to live off.
But if there's any possible way of preventing that from happening - that's exactly what the Federal Reserve and the federal government will be doing, because of the otherwise catastrophic effect on a heavily indebted US government.
And that means they want keep it down to let's say the 1.0% range, remember that the expected hikes if they occur at all in 2016 still don't get us to one percent.
Well with 1.0% we only have $13,800 a year available to pay our expenses in retirement and at 2.0% we only have $15,200 a year.
And when we look at that difference between the little bit less than $14,000 a year at a 1.0% interest rate, and the $20,000 a year that would be available with a 5.0% interest rate, that makes a tremendous difference when it comes to the standard of living in retirement as well as our financial security in retirement.
I think these issues are vital and that people need to understand them. But all too often retirement and other long-term investing is treated as existing in almost a separate world from what the federal government is doing, from what's going on the national debt.
Most people don't even consider factors like that when their drawing up financial plans.
But in fact there is just one world. There's not one world for retirement investors and there's not another world for the national debt.
And when we save for retirement, and we have expectations about what kind of financial outcomes are reasonable for us to achieve in the future, I think it's critical to keep in mind where we are in the national debt supercycle, why interest rates are so very low, and the reasons why the Federal Reserve is behaving in an entirely different way than it has in recent decades. And that's because we are in an entirely different position than we used to be.
 What you have just read is an "eye-opener" about how everything changes when we take a holistic look at the future, and consider how financial planning can be changed by including the effects of a heavily indebted government and aging society.
National debts have been reduced many times in many nations ─ and each time the lives of the citizens have changed. The "eye-opener" linked here reviews four traditional methods that can each change your daily life, and explores how governments use your personal savings to pay down their debts in a manner which is invisible to almost all voters.
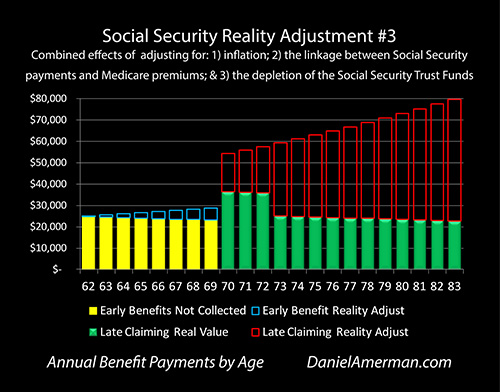
A routine retirement planning mistake can be found when we look at the way most retirement calculators treat the decision about what age to begin collecting Social Security benefits. Seemingly precise and authoritative calculations are made based on scheduled benefits but even the government says the scheduled benefits will likely not be paid in full. When we take a holistic look which includes the depletion of the Trust Funds, as well as inflation and the linkage with Medicare premiums, then the decision on what age to begin collecting Social Security can turn upside down, as explored here.
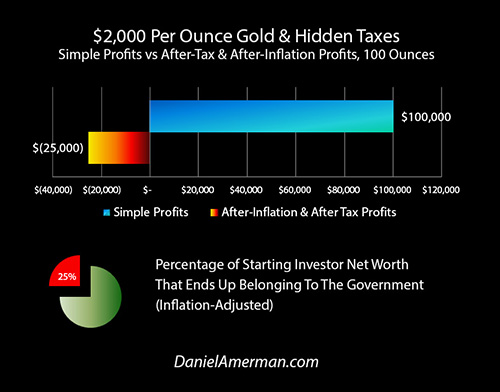
Another "eye-opener" tutorial is linked here, and it shows a quite different redistribution of wealth, which is how governments use inflation and the tax code to take wealth from unsuspecting precious metals investors, so that the higher inflation goes, and the higher precious metals prices climb - the more of the investor's net worth ends up with the government.


If you find these "eye-openers" to be interesting and useful, there is an entire free book of them available here, including many that are only in the book. The advantage to the book is that the tutorials can build on each other, so that in combination we can find ways of defending ourselves, and even learn how to position ourselves to benefit from the hidden redistributions of wealth.
Contact Information:
Daniel R. Amerman, CFA
Website: http://danielamerman.com/
E-mail: dan@danielamerman.com
This article contains the ideas and opinions of the author. It is a conceptual exploration of financial and general economic principles. As with any financial discussion of the future, there cannot be any absolute certainty. What this article does not contain is specific investment, legal, tax or any other form of professional advice. If specific advice is needed, it should be sought from an appropriate professional. Any liability, responsibility or warranty for the results of the application of principles contained in the article, website, readings, videos, DVDs, books and related materials, either directly or indirectly, are expressly disclaimed by the author.
| Digg This Article
-- Published: Thursday, 31 March 2016 | E-Mail | Print | Source: GoldSeek.com


