-- Published: Tuesday, 19 April 2016 | Print | Disqus
By: Cipher Research
In this series we turn our attention to growth in the gold mining sector, the most active of which, occurs at the Mid-Tier level.
We study the growth of eight Mid-Tier gold mining companies: B2Gold (TSX:BTO), New Gold (TSX:NGD), Endeavour Mining (TSX:EDV), Oceana Gold (TSX:OGC), Primero Mining (TSX: P), Newmarket Gold (TSX:NMI) , Teranga Gold (TSX:TGZ), and Alamos Gold (TSX:AGI).
In The Real Cost of Growth for Gold Miners Part 1 we measured and compared the cost of growth of the companies in the peer group. In Part 2 we captured the market value of growth. In Part 3 we turned our attention to the operational health of the eight Mid-Tier miners.
In the final part 4 we present the approach Cipher takes in valuing the Mid-Tiers.
OUR VALUATION APPROACH
In the most basic terms, the value of a gold mineral project is equal to the number of ounces in the ground that will be potentially extracted times the value or price of an ounce in the ground.
Value = Price X Quantity
Establishing Price
To derive the value of an ounce of gold in the ground (Reserves & Resources) we divide the Enterprise Value of a company by the total number of Reserves and Resources (EV/Total Reserves + Resources) and take the average for all companies and all years to use as a benchmark of what an ounce of gold in the ground is worth as a percentage of the price of gold.
The following tables show the historic EV/oz Reserve & Resource and average value of gold in the ground as percentage of the market price of an ounce of gold for our peer group:
EV/Total Reserves + Resources ($/oz)
Company | Current | Q3 2015 | 2014 | 2013 | 2012 | 2011 | 2010 | 2009 | 2008 | 2007 | 2006 | Ave |
GOLD | 1,075 | 1,166 | 1,266 | 1,411 | 1,669 | 1,572 | 1,225 | 972 | 872 | 695 | 603 | 1,139 |
Primero | 122 | 167 | 268 | 310 | 241 | 237 | 206 | N/A | N/A | N/A | N/A | 222 |
Newgold | 79 | 94 | 125 | 139 | 222 | 222 | 182 | 73 | 140 | N/A | N/A | 142 |
Alamos | 52 | 83 | 65 | 115 | 205 | 212 | 209 | 145 | 110 | 143 | 188 | 139 |
B2Gold | 69 | 87 | 121 | 127 | 89 | 259 | 164 | 83 | N/A | N/A | N/A | 125 |
Teranga | 27 | 32 | 39 | 37 | 114 | 189 | 221 | N/A | N/A | N/A | N/A | 94 |
Endeavour | 52 | 44 | 66 | 82 | 133 | 135 | N/A | N/A | N/A | N/A | N/A | 85 |
Oceana | 50 | 55 | 63 | 61 | 96 | 77 | 72 | 49 | 63 | 83 | N/A | 67 |
NewMarket | 21 | 22 | 21 | 18 | 67 | 42 | 62 | 33 | N/A | N/A | N/A | 36 |
Average | 59 | 73 | 96 | 111 | 146 | 172 | 160 | 77 | 105 | 113 | 188 | 114 |
EV/Total Reserves + Resources (% of Gold Price)
Company | Current | Q3 2015 | 2014 | 2013 | 2012 | 2011 | 2010 | 2009 | 2008 | 2007 | 2006 | Ave |
GOLD | 1,075 | 1,166 | 1,266 | 1,411 | 1,669 | 1,572 | 1,225 | 972 | 872 | 695 | 603 | 1,139 |
Primero | 11% | 16% | 25% | 29% | 22% | 22% | 19% | N/A | N/A | N/A | N/A | 21% |
Newgold | 7% | 9% | 12% | 13% | 21% | 21% | 17% | 7% | 13% | N/A | N/A | 13% |
Alamos | 5% | 8% | 6% | 11% | 19% | 20% | 19% | 13% | 10% | 13% | 17% | 13% |
B2Gold | 6% | 8% | 11% | 12% | 8% | 24% | 15% | 8% | N/A | N/A | N/A | 12% |
Teranga | 3% | 3% | 4% | 3% | 11% | 18% | 21% | N/A | N/A | N/A | N/A | 9% |
Endeavour | 5% | 4% | 6% | 8% | 12% | 13% | N/A | N/A | N/A | N/A | N/A | 8% |
Oceana | 5% | 5% | 6% | 6% | 9% | 7% | 7% | 5% | 6% | 8% | N/A | 6% |
NewMarket | 2% | 2% | 2% | 2% | 6% | 4% | 6% | 3% | N/A | N/A | N/A | 3% |
Average | 5% | 7% | 9% | 10% | 14% | 16% | 15% | 7% | 10% | 11% | 17% | 11% |
Based on the results, our peer group benchmark becomes 11% of the price of gold. Currently this equates to about $115/oz per ounce of gold in the ground.
The next step in our valuation is to measure the debt leverage of each company. The debt measure we use is simplified. We divide market capitalization by enterprise value - a numbers close to 1.0 means the company has little or no net debt; above 1.0 mean more cash than debt on the balance sheet.
Multiplying the Cash Adequacy Ratio by the Debt Measure gives us what we call Operational Health Factor The higher the number, the healthier the company.
The following is a chart of the average ratios for each mining company for the period 2013-2015 along with their current discount to the benchmark $115/oz in the ground. A good way to think of this chart is to view it like a Health Chart.
Health Chart 2013-2015
Company | Cash AR | Debt Measure | Operational Health Factor | Premium (Discount) to Benchmark |
Primero | 0.88 | 0.88 | 0.77 | 116% |
Alamos | 1.01 | 1.19 | 1.20 | 24% |
Newgold | 0.81 | 0.71 | 0.58 | 4% |
B2Gold | 0.74 | 0.83 | 0.61 | (3%) |
Endeavour | 0.80 | 0.47 | 0.37 | (44%) |
Oceana | 1.10 | 0.88 | 0.97 | (48%) |
Teranga | 0.99 | 0.75 | 0.74 | (69%) |
NewMarket | 1.17 | 0.64 | 0.75 | (82%) |
Average | 0.94 | 0.79 | 0.75 | (19%) |
Operational Health vs Premium (Discount) to Benchmark for the period 2013-2015
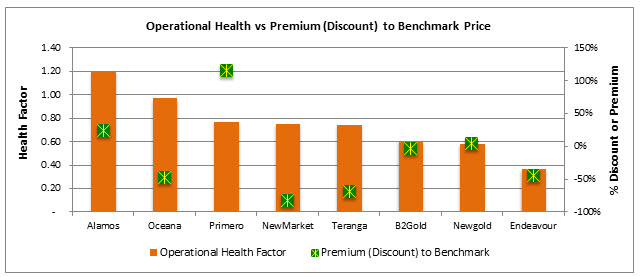
Generally the higher the Operational Health Factor the higher EV/oz with the exception of Oceana, Teranga and NewMarket. Note however that these three companies are underperforming in terms of R&R growth number of ounces and speed of growth.
Operational health is an important determinant of market value however size of R&R has an overwhelming significance. In fact growth in R&R can make up for below average operational health. This again confirms that size of R&R is essential to the market valuation the companies receive.
An important point to make is that Operational Health Factors have to be reviewed within the context of the companies corporate development. Short-term decline in operational health might not be a bad thing if it would lead to a longer-term benefit.
For instance the operational health of B2Gold appears relatively low in the last 3 years however this is the case because a significant amount of their cash is committed to the development of the Fekola Mine in Mali which according to company guidance would nearly double their production by the next 2 years. Once operational, the Fekola Mine is operational we expect to see a considerable increase in B2Golds Operational Health Factor.
CONCLUSIONS
In summary the key findings in the series are:
· To capture The Real Cost of Growth for Goldmines be sure to pay attention to the Full Shareholder Dilution to date and in the presence of streaming & royalty agreement, include forecasted dilution.
Major market value drivers for mid-tier gold miners are:
· Size of R&R
· Speed of growth
Other market value drivers for Mid-Tier gold miners are:
· Operational health
o Cash adequacy
o Debt level
· Production volumes
· The Benchmark value for EV/oz for mid-tier mining companies is $115 or 11% or the spot price of gold
Group Average | | Comments |
R&R (Mio z) | 14.11 | Ranges from 4.24 to 29.10 (Smallest major has ~40 Mi oz) |
Production (oz/yr) | 345K | Ranges from 187 to 506K (Smallest major has ~800K) |
Speed of Growth Mio z/yr) | 1.60 | Ranges from 0.37 to 4.12 |
CAR | 0.94 | Ranges from 0.74 to 1.17 (on average they are not generating positive cash flows) |
Net Debt | 302 | Ranges from 29 to 1,130 Mi |
Debt Measure | 0.69 | Ranges from 0.50 to 0.92 |
Op Health Factor | 0.66 | Ranges from 0.40 to 1.01 |
Delta to Benchmark | (49%) | Ranges from -82% to 6% (benchmark is US$115/oz) |
Primero | | Comments |
R&R | 4.24 | Over ½ is P&P, lowest of peer group |
Production | 215K | Near lowest in peer group, more risk to price drops |
Speed of Growth | 0.59 | One acquisition over 6 years |
CAR | 0.88 | Relatively low CAR |
Net Debt | 152 | Below average |
Debt Measure | 0.71 | Close to average |
Op Health Factor | 0.62 | Below average |
Delta to Benchmark | 6% | Very highly valued relative to peers and for existing R&R and cash flows |
New Gold | | Comments |
R&R | 29.1 | Highest in group, No growth since 2013 |
Production | 405K | Range from 380-405 since 2010 |
Speed of Growth | 4.12 | Started with 9.8 Mi in 2008 |
CAR | 0.81 | Low CAR well below average |
Net Debt | 1130 | Very high debt especially given low CAR |
Debt Measure | 0.51 | Lowest in group |
Op Health Factor | 0.41 | Lowest in group |
Delta to Benchmark | (31%) | Valued above average appears high relative to health of the operations |
B2Gold | | Comments |
R&R | 20.8 | Well above average |
Production | 500K | Highest in group Fekola to add nearly 400K by 2018 (close to major status) |
Speed of Growth | 2.97 | Started with 3.0 Mi in 2009 |
CAR | 0.74 | Lowest in group due to investment in the development of new mine in Mali (expected on-line in 2018) |
Net Debt | 452 | Moderate to high debt |
Debt Measure | 0.69 | Average for group |
Op Health Factor | 0.51 | Low health due to ongoing investment in Fekola mine in Mali |
Delta to Benchmark | (40%) | Reasonable value at present, Mali mine production should significantly increase value |
Alamos | | Comments |
R&R | 19.8 | Well above average, questionable economics on pre-production resources |
Production | 370K | Merger with Aurico more than doubled production |
Speed of Growth | 1.87 | Started with 3 Mi in 2005 fairly consistent growth |
CAR | 1.01 | Company had very high CAR prior to merger may not be able to sustain post merger |
Net Debt | 227 | Debt a result of the merger with Aurico |
Debt Measure | 0.78 | Well above average |
Op Health Factor | 0.79 | Reasonable health but to maintain will need higher gold prices |
Delta to Benchmark | (55%) | Recently discounted value |
Endeavour | | Comments |
R&R | 10.9 | Moderate R&R |
Production | 506K | High production relative to R&R |
Speed of Growth | 1.42 | Started with 5.2 Mi in 2011 |
CAR | 0.80 | Below average CAR |
Net Debt | 287 | Moderate debt |
Debt Measure | 0.50 | Lowest in group |
Op Health Factor | 0.40 | Lowest in group new mine in Burkina Faso will need to perform well or higher gold price to improve value |
Delta to Benchmark | (55%) | Discounted slightly higher than average |
Oceana | | Comments |
R&R | 11.9 | Moderate R&R all from producing mines |
Production | 353K | Average production relative to peers no new production immediately planned |
Speed of Growth | 0.41 | Started with 8.6Mi in 2007 |
CAR | 1.01 | Very good CAR |
Net Debt | 49 | Very low debt |
Debt Measure | 0.92 | Very good debt measure |
Op Health Factor | 1.01 | Highest in group |
Delta to Benchmark | (57%) | Moderate to highly discounted would greatly benefit from acquisitions |
Teranga | | Comments |
R&R | 8.42 | Low R&R |
Production | 187K | Production to increase through 2016 as new mine brought on-line in late 2015 |
Speed of Growth | 1.08 | Started with 3 Mi in 2010 |
CAR | 0.99 | Very good CAR |
Net Debt | 91 | Very low debt |
Debt Measure | 0.60 | Low debt measure result of low market capitalization |
Op Health Factor | 0.60 | Low health result of low M/C, Stream could further impair health |
Delta to Benchmark | (77%) | Highly discounted, proof of health or acquisitions should help value |
NewMarket | | Comments |
R&R | 7.71 | Less than 650 K oz P&P at existing operations means mine life in question. Significant grade drop to M&I at Fosterville (50% of production) Will require increase IMP to upgrade M&I |
Production | 225K | Stable production needs new mines for increase |
Speed of Growth | 0.37 | Started with 5.5 Mi in 2009, All attributed to increase in Au price used for calculations |
CAR | 1.17 | Excellent rating can it be sustained |
Net Debt | 29.0 | Very low debt |
Debt Measure | 0.82 | Dragged down by low MC |
Op Health Factor | 0.96 | Very good, higher M/C would help |
Delta to Benchmark | (82%) | Highest discount of group. Limited upside with current projects. Needs acquisitions to demonstrate long-term viability |
http://www.cipherresearch.com/
About Cipher Research
Cipher Research Ltd. is an independent research and analysis company covering Metals and Mining markets. We develop comprehensive valuation models applying the disciplines of Geology, Economics, Statistics and Finance ("Geonomics"). Our valuation models have proven to be successful in generating investing and trading strategies.
Disclaimer
Cipher Research Ltd. is not a licensed broker, broker dealer, market maker, investment banker, investment advisor, analyst, or underwriter and is not affiliated with any. There is no assurance the past performance of these, or any other forecasts or recommendations in the reports, will be repeated in the future. These are high-risk securities, and opinions contained herein are often time and market sensitive. No statement or expression of opinion, or any other matter herein, directly or indirectly, is an offer, solicitation or recommendation to buy or sell any securities mentioned. While we believe all sources of information to be factual and reliable; we in no way represent or guarantee the accuracy thereof, nor of the statements made herein. We do not receive or request compensation in order to feature companies in this publication. We may, or may not, own securities and/or options to acquire securities of the companies mentioned herein. This document is protected by the copyright laws of Canada and the U.S. and may not be reproduced or for other than for personal use without prior, written consent. This document may be quoted, in context, provided that proper credit is given.
| Digg This Article
-- Published: Tuesday, 19 April 2016 | E-Mail | Print | Source: GoldSeek.com


