-- Published: Friday, 29 April 2016 | Print | Disqus
By: Arkadiusz Sieron
The CoT report enables investors to peek behind the scenes of the gold futures market and to better understand the psychology of the marketplace and, thus, get a better idea of futures moves on the market. This is because the COT report shows the net long or short positions of different types of traders. The knowledge of how traders are positioned is useful, but what really matters are changes in their positions. Knowing that, for example, non-commercials have 175,000 contracts long is meaningless without the supplementary information whether they are accumulating more or starting to unload contracts over time.
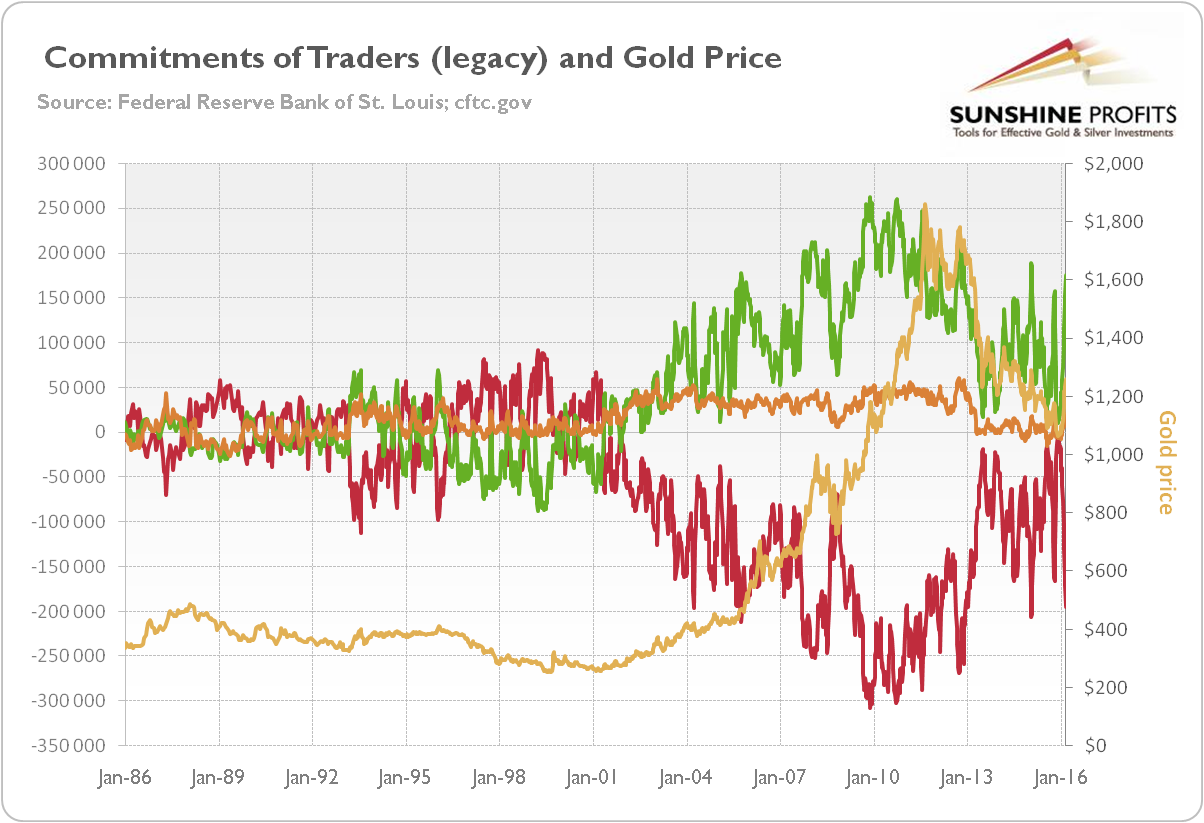
Therefore, lets analyze the long-term trends in traders positioning and the link between them and the gold prices. The chart below shows the historical price of gold and the net (i.e., long minus short) positions of gold traders in Comex taken from the legacy version of the report.
Figure 1: The price of gold (yellow line, right axis, London P.M. fixing), the net position of commercials (red line, left axis), the net position of non-commercials (green line, left axis) and the net position of non-reportables (orange line, left axis) from 1986 to March 8, 2016.
What immediately strikes us is that commercials (red line) are usually net short they are mostly hedging while non-commercials (green line) are usually long, because they use their positions for speculative purposes and take the opposite sides of the trades (they offset the price hedging requirements of commercials). Actually, the line reflecting the non-commercials net positions mirror the line representing the commercials net position. Therefore, the non-commercials are positively correlated with the gold prices, while the commercials move inversely with the price of gold. The former are trend-followers. They increase their net long position when prices rise and scale it back when prices decrease. For example, when a 2000s bull market continued, non-commercials were adding more net long trades. Consequently, close to the end of that rally, they had their most bullish positions. In other words, non-commercials are generally on the right side of the market, but they tend to become overextended near peaks and bottoms.
Conversely, commercials actively buy (reducing their short positions) when the market goes down and actively sell when the market goes up (increasing their short positions). For example, commercials were systematically adding short contracts during the 2000s bull market.
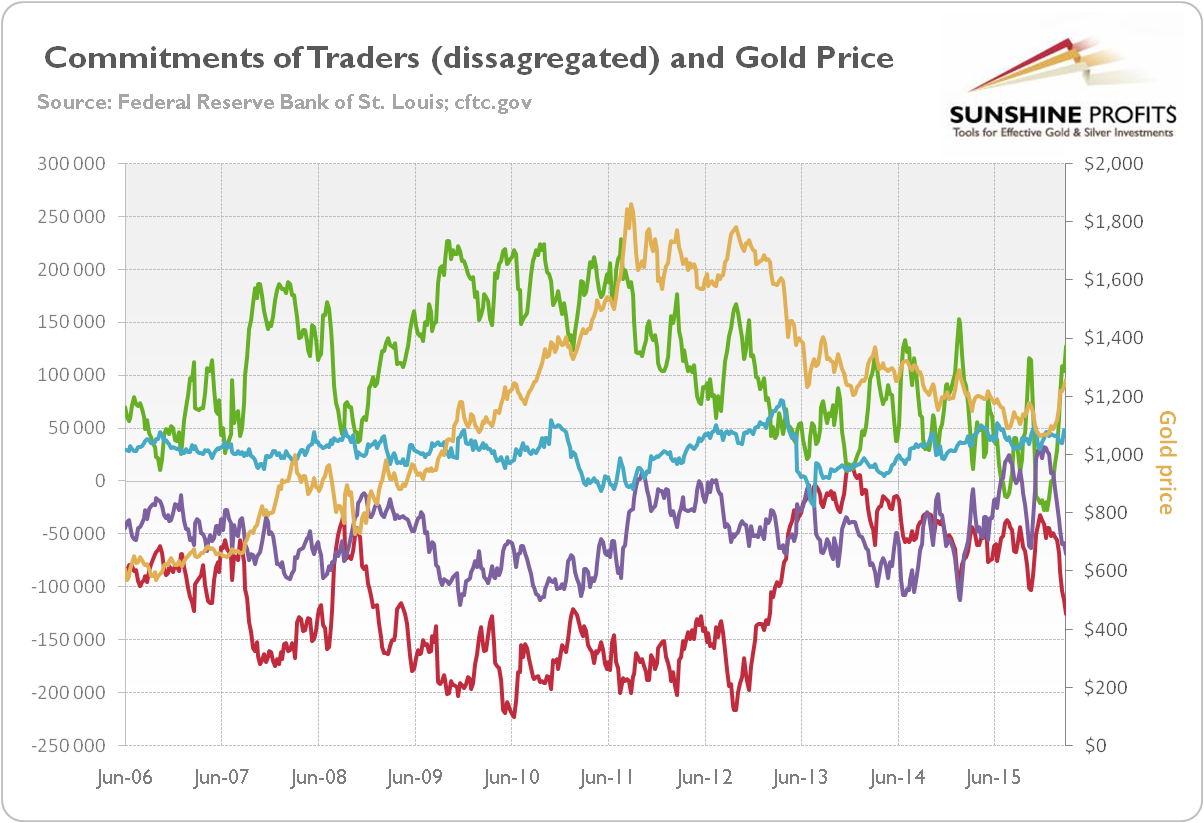
Regarding non-reportables, or small speculators, they typically move together with non-commercials, or large speculators (and, just like them, tend to be wrong at critical turning points) this is why they often form one category of speculators. Given their relative weak position on the market (low number of open contracts) we will not analyze their behavior in a more detailed way. Instead, we will take a look at the chart showing the price of gold and disaggregated trading positions in the Comex.
Figure 2: The price of gold (yellow line, right axis, London P.M. fixing), the net position of producers (red line, left axis), the net position of money managers (green line, left axis), the net position of swap dealers (purple line, left axis) and the net position of other reportables (blue line, left axis) from 2006 to March 8, 2016.
As one can see, the money managers (green line) and other reportables (blue line) are usually net long and tend to follow gold prices (although it is more clearly visible in the case of money managers), while the producers (red line) and swap dealers (purple line) are generally net short and move in the opposite direction to the gold prices (although it is more clearly visible in case of producers).
How to use the CoT report for trading purposes? Investors can, for example, monitor speculators (either large or small, but large should be better), as they tend to be most bullish just prior to significant price tops and most bearish before the significant price bottoms. Given that the net positions of commercials reflects net positions of non-commercials, investors may also watch them, as they tend to be most bearish just prior to significant price tops and most bullish just prior to significant price bottoms. This is why data from the CoT reports can be used as a sentiment indicator in the gold market. However, investors should use it just as such, not as a timing indicator, as there are no absolute benchmarks of bullishness or bearishness which could trigger investment decisions (for example, commercials are often on the long side of the market before a major rally begins). Moreover, the correlation between commercials, non-commercials and gold prices may break down during the small lag, so there is a risk of significant changes in positioning between the period covered by the report and the date of its publication. Moreover, there is another much simpler way to see when gold is overbought or oversold without examining the CoT numbers. Therefore, using them might be helpful, but not necessary when using tools that help detecting the same situations.
The content on this site is protected
by U.S. and international copyright laws and is the property of GoldSeek.com
and/or the providers of the content under license. By "content" we mean any
information, mode of expression, or other materials and services found on GoldSeek.com.
This includes editorials, news, our writings, graphics, and any and all other
features found on the site. Please contact
us for any further information.
Live GoldSeek Visitor Map | Disclaimer
The views contained here may not represent the views of GoldSeek.com, Gold Seek LLC, its affiliates or advertisers. GoldSeek.com, Gold Seek LLC makes no representation, warranty or guarantee as to the accuracy
or completeness of the information (including news, editorials, prices, statistics,
analyses and the like) provided through its service. Any copying, reproduction
and/or redistribution of any of the documents, data, content or materials contained
on or within this website, without the express written consent of GoldSeek.com, Gold Seek LLC,
is strictly prohibited. In no event shall GoldSeek.com, Gold Seek LLC or its affiliates be
liable to any person for any decision made or action taken in reliance upon
the information provided herein.