-- Published: Thursday, 19 May 2016 | Print | Disqus
By Steve St. Angelo, SRSrocco Report
Very few precious metals investors realize how recent trend changes will greatly impact the gold market going forward. The reason many investors fail to grasp the huge change in the gold market is that they look at data or information on an individual basis. To really understand what is going on, we must look at how all segments of the market compare to each other… a BIRD’S EYE VIEW.
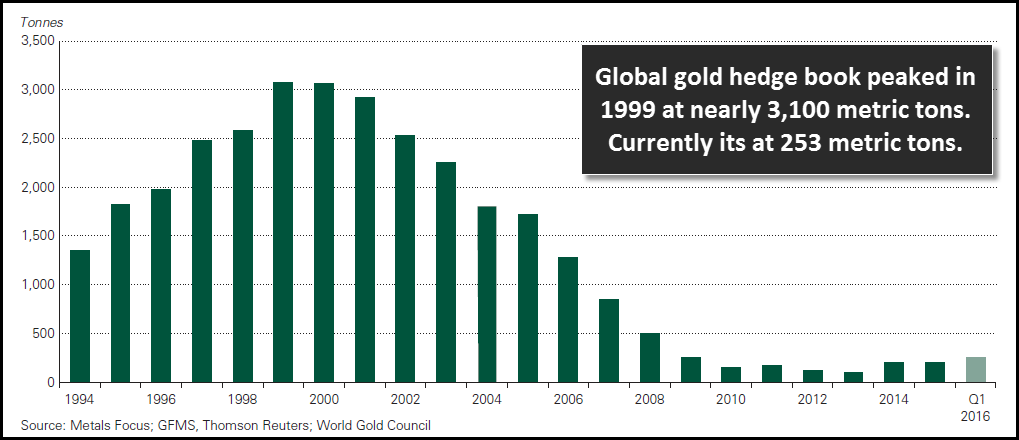
Let’s start off with one segment of the gold market that has changed significantly in the past 15 years. The Global Gold Hedge Book hit a peak of nearly 3,100 metric tons (mt) in 1999:
(chart courtesy of the World Gold Council)
Here we can see that after the Global Gold Hedge Book peaked in 1999, it fell to a low at a little more than 100 mt in 2013. Not only was this a significant change in the hedging strategy of the gold mining industry, it also was impacted by the price change from an average price of $279 in 1999 to $1,411 in 2013.
So, as the price of gold jumped five times from 1999 to 2013, the Global Gold Hedge Book fell 96%. Even though it increased a bit in the first quarter of 2016 to the present 253 metric tons, it’s still a fraction of the massive hedge book the gold industry held in 1999.
Now, if we add another segment of the gold market, we will see another large trend change. Global Gold Bar & Coin demand increased significantly since 2000. In 2000, total Global Gold Bar & Coin demand was 166 mt. However, this hit a record high of 1,705 mt in 2013:
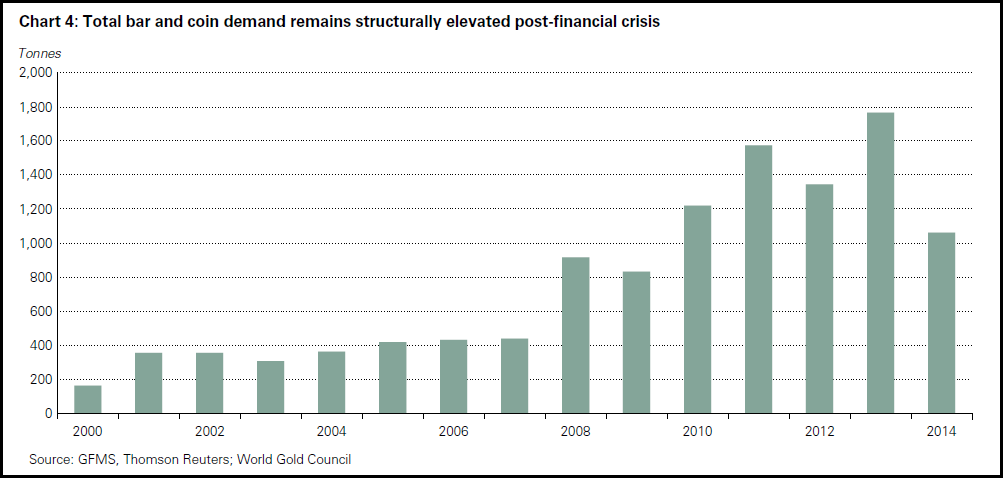
If we were to super-impose the Global Gold Hedge Book chart with the Gold Bar & Coin chart, we would see an interesting trend. As the gold industry’s hedge book fell to a low in 2013, Global Bar & Coin demand hit a peak. Furthermore, if we consider the net change in Central Bank Gold purchases, it’s even more interesting:
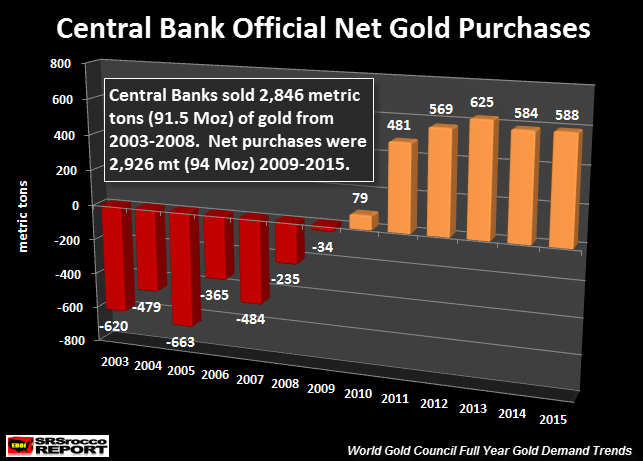
When the gold industry held a very large gold hedge book, Western Central Banks were dumping gold on the market HAND-over-FIST. I imagine this was a two-tiered approach in controlling the gold price. We can see that in 2003, Central Banks dumped 620 mt of gold into the market and another whopping 663 mt in 2005. However, this all turned around in 2010, when (Eastern) Central Banks became net buyers of gold at 79 mt.
Moreover, Central Bank gold purchases also hit a record 625 mt in 2013 along with Gold Bar & Coin Demand of 1,705 mt. These two record gold demand figures took place the very year the Global Gold Hedge Book fell to a record low.
While these three different segments of the gold market provide the investor with a different understanding when we look at them all together, there is another factor that is even more compelling.
Global Gold ETF Demand Is The Major Trend Changer
Even though investors don’t trust a lot of the figures coming out of the Gold ETF market, it is by far the most critical factor in the gold market going forward. Why? Because this is where the Main Stream Investors enter in BIG NUMBERS.
This chart shows the change of Gold Bar & Coin demand versus Gold ETF demand in the past two quarters:
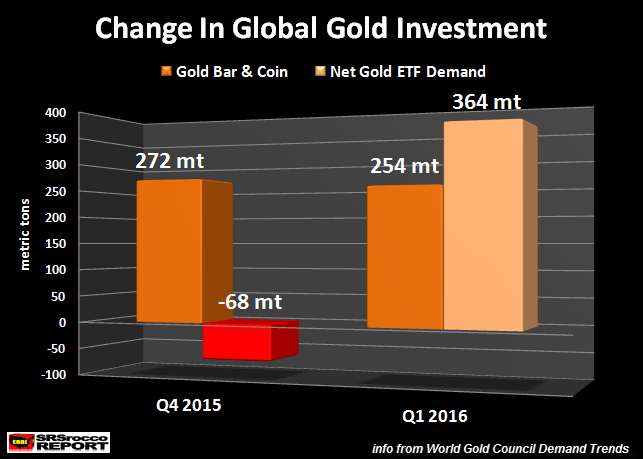
Even though gold went up $200 in the first quarter of 2016, Gold Bar & Coin demand actually declined from 272 mt (Q4 2015) to 254 mt (Q1 2016). However, Global Gold ETF’s saw a huge spike in demand from a negative 68 mt in Q4 2015 to 364 mt in Q1 2016. While Gold Bar & Coin demand fell 7% in Q1 2016 compared to the previous quarter, Global Gold ETF’s experienced a huge 300+% increase.
Okay, I realize many investors don’t trust the data put out by the World Gold Council, but its the best we can go by. Even if the data is manipulated or under-reported, the trend changes discussed here are important to understand. Furthermore, if the figures are manipulated, then the trend changes are even more severe and bullish for the gold investor going forward.
Regardless, the big change of Global Gold ETF demand will be the major factor to focus on in the future. It won’t matter if the GLD ETF has all the gold it states, spiking demand in this sector will be the factor that overwhelms the entire market. Again, if we look at the chart above we can see that Gold Bar & Coin demand did not really increase during the $200 gold price increase. Which means, the 1% of investors who have been acquiring physical gold for years didn’t feel motivated to buy much more.
On the other hand, FEAR entered into the Main Stream Investor as the broader stock markets were crashing during the first quarter of 2016. This was the motivation of the main stream investor to get into the safety trade of gold. I see this segment of the gold market surging as the Dow Jones finally falls off a cliff.
Lastly, the gold market was in serious trouble at the end of 2012 when the price of gold hit an average high of $1.669. This is why the gold price was knocked lower in 2013 and lower still over the next two years. This forced gold out of the Global Gold ETF’s. This last chart represents Net Global Gold Investment since 2013:
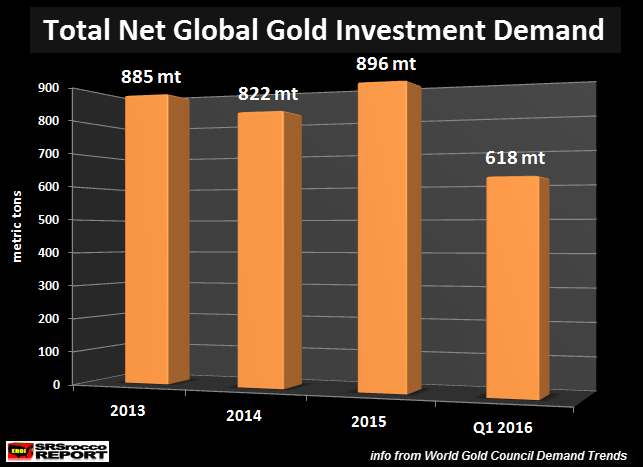
Even though total Gold Bar & Coin demand for 2013 was 1,705 mt, when we subtract out the outflows from Global Gold ETF’s, total net gold investment was only 885 mt. This figure does not include Central Bank purchases. By pushing the price of gold down for the past three years, gold was taken out of Global Gold ETF’s to supplement the market.
However, this all changed during the first quarter of 2016 as Global Gold ETF demand surged to 354 mt versus a negative 68 mt in Q4 2015. Thus, total gold investment for Q1 2016 is already 618 mt. What happens for the next three-quarters?
Take a look at Global Gold Holdings over the past 10 days:
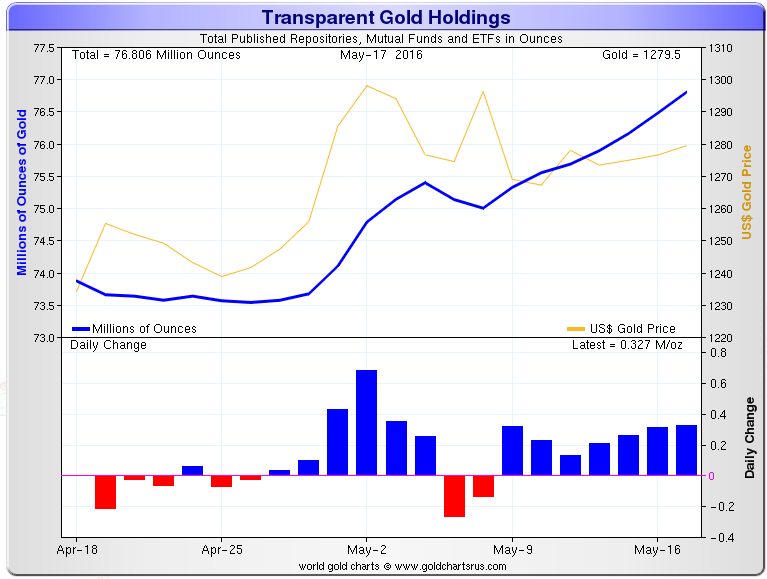
What is interesting here is as the price of gold declined from $1,289 on May 6th to $1,277 on May 17th, total Global Gold Holdings increased 1.8 million oz (shown on the dark blue line). Basically, Gold ETF’s, similar products and exchanges total inventories increased from 75 million oz to 76.8 million oz as the price of gold declined.
This means investors are still highly concerned about the economic and financial markets to move into gold investments as the price declines.
Keep an eye on Global Gold ETF demand going forward. This will be the key that totally overwhelms the gold market in the future.
Check back for new articles and updates at the SRSrocco Report.
| Digg This Article
-- Published: Thursday, 19 May 2016 | E-Mail | Print | Source: GoldSeek.com

