As we move rapidly through the spring of 2016 and with summer less than a month away, I thought it would be a good time to revisit the main markets that dwell on my financial radar screen (gold, silver, gold and silver equities, and the S&P 500) because there has been a fairly sizable shift in market tectonics, particularly in gold and perhaps more ominously in silver over the past month.
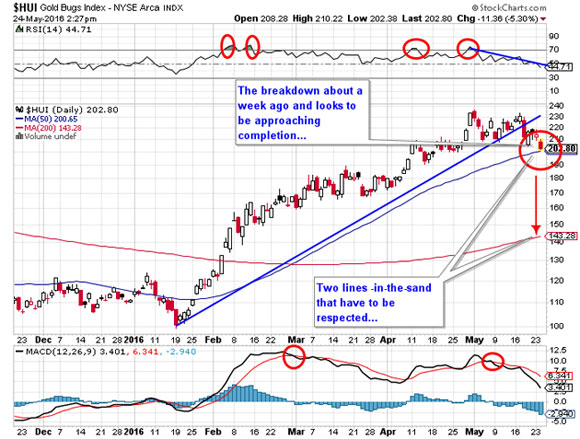
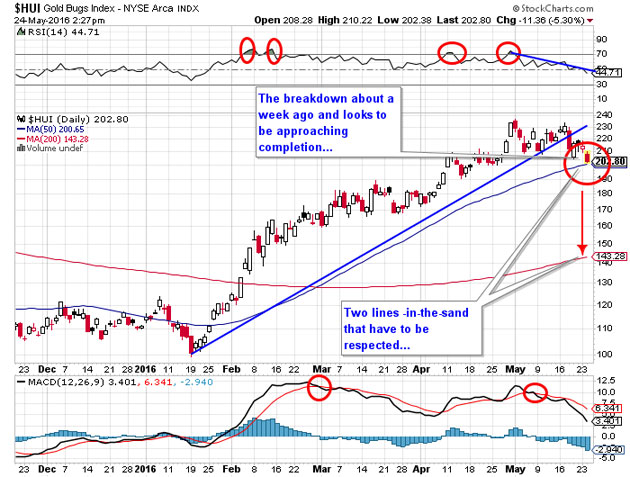
Call it deterioration in momentum or correction; the NYSE.Arca Gold BUGS Index (HUI) is off 10% from its top at 236.23. I am almost afraid to mention the term Commitment of Traders or the word Commercials because everyone from Dennis Gartman to "kitchen chair financial planners" have now become "COT experts," pointing fingers and resurrecting archived blog posts from the last 10 years to prove their exclusive ownership of "COT analysis."
This humble scribe only learned about the COT some 10 years ago but cast it aside as a play toy for "eccentric gold traders" until 2015 when, thanks to my good friends at Gold Anti-Trust Action Committee (GATA), I started reading interpretations by the likes of Bill Murphy. Taking his lead, I delved deeper into the role of the bullion banks and why it was that, unlike every other market in the world, technical support and resistance levels were meaningless. I discovered that the only way one could monitor the activities of those banks that act and execute for the Exchange Stabilization Fund (another topic for another day) was to monitor the very banks that show up in the Participation Rate survey and which are represented as "Commercial Traders" in the COT.
So, if the guys painting the tape to create false breakouts and false breakdowns RELIGIOUSLY, time after time, are the same guys that can sell infinite amounts of synthetic "metal" represented as a keystroke entry on a inventory spreadsheet with ZERO correlation to actual vault inventories, then I better damn well USE that data as a rudimentary "tracking bracelet" of the Crimex criminals. Could the data be cooked? Of course, but I take the attitude that this is a data set designed not for the public but for the other bullion banks to check up on one another to see who is cheating and who is singing the proper words from the "hymn sheet."
Needless to say, the last four months of action in the metals has been bizarre. While there is "no fever like gold fever," that the gold market traded up $250 in the first quarter with the Relative Strength Index (RSI) peaking on Feb. 7 at 86.75 (above 70 is a "sell") at $1,263 was certainly enough to give us a short, sharp correction to $1,190 (for about a half a minute) and then despite waning RSI, waning Moving Average Convergence/Divergence (MACD), gold actually powered higher to an intraday level of $1,306 before succumbing to profit taking. Silver made its run to $18 as gold was dancing, but as I ponder the charts and breathe in the air of sentiment from the caverns of Bay Street, I get the sense that bullish sentiment has resumed as if 2011–2015 never occurred.
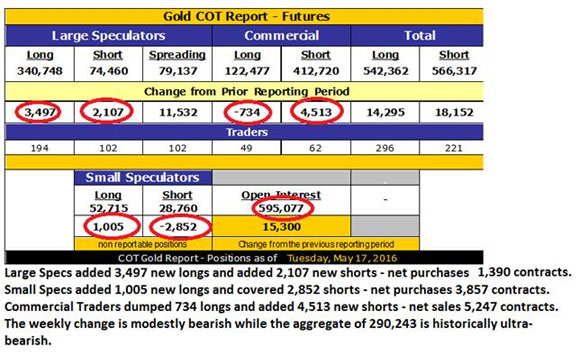
It took almost a decade for the Commercial Traders to amass a net short position of nearly 300,000 contracts, culminating in the 2011 top after a 766% advance in gold prices. It has taken a mere four months to repeat the drill. FOUR MONTHS! Friday's COT showing a 290,243-contract short position against total open interest at nearly 600,000 means that gold has gone from the dark depths of bear market misery with Commercials short a paltry 2,911 contracts back in early December to the exalted peak of bull market euphoria not seen since 2011 at 290,243, while the cycle of extremes took 1/33 of the time. That, my friends, is either a testimonial to the raw power of this new Golden Bull or it's a classic case of "Too far, too fast" and we are headed lower.

Which camp should we be in? Better still, how do we play it out? Now, coming from the "analyst" that called the bottom in early December, be it known for the record that I exited the leveraged ETFs (Direxion Daily Gold Gold Miners Index [NUGT] and Direxion Daily Junior Gold Miners Index Bull 3X [JNUG]) and then a bit later the Market Vectors Gold Miners ETF (GDX)—at huge profits—way too early when the COT report showed Commercial shorts at a 12-month high north of 166,000. My thinking was that there would be an initial pullback after the mindboggling rally that saw RSI for the HUI hit 86.75, and MACD and the Histograms all confirming wildly overbought conditions in both the metals and in the shares.
Furthermore, last Friday, I had the Market Vectors Junior Gold Miners (GDXJ) May $35 puts I owned expire, so I replaced the May hedge with the GDXJ June $37 puts for $2.30. Mind you, I did not touch my massive aggregation of junior explorer/developers all of which have done exceedingly well. However, what to do now is difficult because while I have been forecasting a "correction that will rip your face off," it was the action in the gold-to-silver ratio that gave me encouragement that perhaps the Commercials would indeed get "theirs." Having shorted the gold-to-silver ratio above 80, it traded down to 72.95 recently, but in the past few weeks has reversed back up ward (75.96) and as I have babbled on about ad nauseum for years, you aren't going to sustain a gold rally with silver underperforming. Lately, silver has been doing just that and that ain't good.

All of this cyber-jabbing that I read, as bloggers and newsletter writers engage in gold authority one-upmanship be it through podcasts or YouTube or FaceBook, is really akin to having a cocktail party debate amongst home security experts about which system one should install as a thief sneaks into your upstairs bedroom and removes all the valuables from the safe. Suddenly the party is over and you won the debate but all your valuables are gone. As we all talk up our books and go back out on speaking tours (now that someone actually cares), the bullion bank behemoths have actually entered your upstairs bedroom AND your office and taken your goodies AND installed listening devices. These cretins are now short as much synthetic gold as at any point since Gordon Brown dumped the U.K.'s gold holdings at the exact bottom in 1999. How on earth can one carry a gold or silver or GDX/GDXJ position without being hedged?
Calling for a correction since March-April has allowed me to seesaw back and forth but as we have all been arguing and sniping and chirping over the next $100 move, the gold price has moved sideways in perhaps a $50 band while the bankster banditos have raided the vault. With gold printing $1,235 this morning and the Commercials short roughly 300,000 contracts, on a notional basis, every $10 down move is a $300 million improvement on a marked-to-market basis. More importantly, support lines on everybody's charts are breaking like wind at a bean-eating contest, so this week could easily be a nasty one.
The "Fido Indicator" worked like a charm; two weeks ago with gold at nearly $1,300, he was a goofy, tongue-hanging-out, tail-wagging fool of a dog all happied up and snoozing on my feet under the desk; today with gold at $1,235, he is nowhere to be found. along with the other inhabitant of this house, which means the dog will be eating steak somewhere tonight while I am dining on Alpo Fettucine with a fine Chianti and some fava beans. . .
Originally trained during the inflationary 1970s, Michael Ballanger is a graduate of Saint Louis University where he earned a Bachelor of Science in finance and a Bachelor of Art in marketing before completing post-graduate work at the Wharton School of Finance. With more than 30 years of experience as a junior mining and exploration specialist, as well as a solid background in corporate finance, Ballanger's adherence to the concept of "Hard Assets" allows him to focus the practice on selecting opportunities in the global resource sector with emphasis on the precious metals exploration and development sector. Ballanger takes great pleasure in visiting mineral properties around the globe in the never-ending hunt for early-stage opportunities.


