-- Published: Thursday, 9 June 2016 | Print | Disqus
By: Nadeem Walayat
 One of the primary drivers for triggering the EU Referendum Is immigration and more specifically EU immigration that many deem to be out of control as membership of the European Union means free movement of workers which has prevented the UK from controlling its borders now for over a decade as the UK is buffeted by waves of ever escalating migrant flows from Europe each year. All adding to those that came before with total immigration from the EU since 2000 now having passed the 5 million mark. All whilst both Labour and then the Conservative governments promises to be bring immigration under control having amounted to nothing, as the government has NO control over EU migration, which thus continues on an accelerating trend trajectory. Therefore voting to REMAIN within the EU ensures EU migration will continue to increase putting added pressure each year on housing, jobs and social services such as schools, NHS and the benefits system, virtually all of which are already at critical breaking point levels.
Whilst the REMAIN in the EU campaign tends to highlight the positive aspects of EU migration such as approx 1.2 million Brit's living, working and studying within the EU, with millions more visiting each year, and that the UK is not part of the Schengen free movement area and that even if the UK left the EU would likely still have to accept free movement of workers as a condition for gaining full access to the single market.
Therefore this in-depth analysis takes a detailed look at immigration to determine what has exactly transpired to date, and where immigration is likely to trend towards over the coming years.
To best understand whether Britain is experiencing an immigration crisis then one needs to look at what the levels of immigration were BEFORE Tony Blair's Labour government came into power in 1997, soon opening up Britians' borders to migration across the world and European Union under the assumption that newly arrived migrants would tend to be more likely to vote Labour, the traditional political party for immigrants and thus improve the Labours election prospects.
Immigration 1970 to 1983 (14 years)
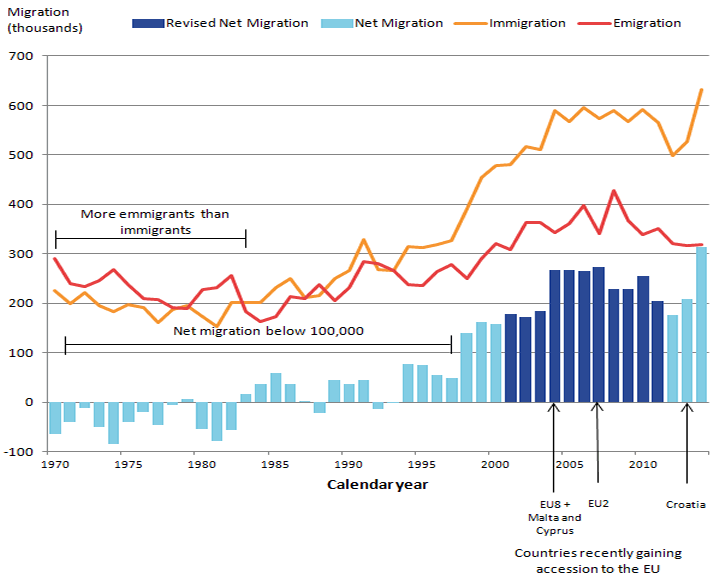
The key indicator to focus upon is net migration (grey bars) that show the difference between those emigrating and those immigrating into the UK, is the fact is that between 1970 and 1983 the UK experienced net EMIGRATION i.e. more people LEFT the UK than ARRIVED for settlement.
| UK Immigration 1970-1983 | |
| Average annual Immigration | 188k |
| Average annual Emigration | 227k |
| Average Net Emigration | -38k |
The immigration facts of 1970 to 1983 are that on average 38,000 more people Emigrated from the UK than Immigrated into the UK. Whilst average annual Immigration was 188k against average annual emigration of 227k. Therefore the UK clearly did NOT have an immigration problem during this period instead the UK could be said to have had an Emigration problem, i.e. a brain drain as a consequence of high taxes and socialism such as heavily subsidised dieing industries such as steel, coal and auto's.
Immigration 1984 to 1997 (14 years)
| UK Migration 1984-1997 | |
| Average Immigration | 269k |
| Average Emigration | 234k |
| Average Net Migration | +34k |
For the next 14 years upto Labour taking power in 1997, average annual immigration was 269k against average annual emigration of 234k resulting an average net migration of +34k. Therefore during the period upto Labour taking power in 1997 the UK did NOT have an immigration crisis or problem, with average net immigration at well below 50k per annum, and with the figure of 48k for the year Labour took office.
1998 to 2015
The labour years soon saw net migration first break above +100k and then as free movement was opened up to the eastern europe, immigration leapt by another +100k per annum averaging during the mid 2000's at 213k per annum, and only starting to dip after Labour left office in 2010.
When David Cameron took power in 2010 he promised that he would cut net immigration by 2015 to the tens of thousands from the then disastrous annual figure of 205,000 - "Overall, net immigration would be kept in the tens of thousands, rather than the current rate of hundreds of thousands. - David Cameron 2010
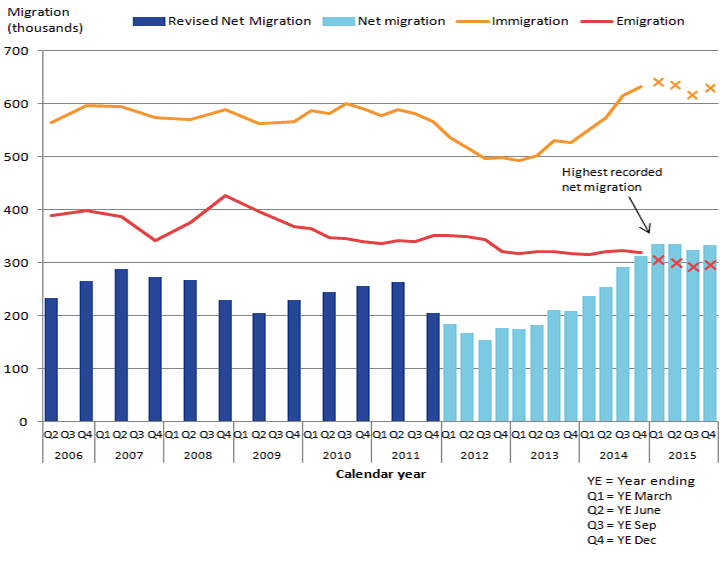
For the first 2 years of the Coalition it appeared that the government was on target to achieve its election pledge to some extent. However the trend soon sharply reversed as another lot of impoverished eastern european states joined the EU such as Romania, Bulgaria and Czech and Slovakia were allowed free movement for work and benefits in the UK that sent immigration soaring into the stratosphere setting a new high of 323k for 2015.
| UK Migration 1998-2015 | |
| Average Immigration | 543k |
| Average Emigration | 377k |
| Average Net Migration | +206k |
UK net migration has been running at an average rate of +206k per annum against an average of +34k per annum during the preceding period (1984 to 1997), or at SIX TIMES the previous rate. However the last data in this series of a net 323k is near NINE TIMES the preceding average and is an harbinger of a crisis that is literally exploding higher.
| Total Net Migration | |
| 1970- 1983 (14 years) | -533k |
| 1984- 1997 (14 years) | +480k |
| 1980- 1997 (18 years) | +308k |
| 1998 - 2015 (18 years) | +3.7 million |
The total net migration figures further illustrate that the last 18 years have seen unprecedented and literally out of control immigration that resulted in a net 3.7 million net migrants, (total of 9.8 million) taking up residency in the UK which compares against just 308k during the preceding 18 years (1980 - 1997). Or at TEN TIMES the previous rate. So has Britain had an immigration crisis during the past 18 years ? The answer most definitely is YES! And what's worse is that the last figure in this series for 2015 is showing net migration accelerating to a new extreme level of 323k which implies that if urgent action is not taken then the UK could look forward to far higher net migration over the next decade, i.e. to at least DOUBLE the average rate of the past 18 years of 206k.
Latest ONS Migration Statistics and Consequences
The latest ONS data release continues to show an ACCELERATION in the rate of immigration into Britain with net migration of +333k in the year to December 2015 added to Britain's population, an INCREASE of 20k on the preceding year which illustrates that immigration is STILL ACCELERATING. Which literally translates into a DAILY flood of near 1000 people turning up on Britain's shores and demanding housing, education, school places, jobs and benefits such as tax credits, housing and child benefits, health & social services that have been buckling and breaking as illustrated by social housing that in most cities has been in a state of total paralysis for many years now.
The impact of out of control immigration is all persuasive from jobs, to housing to health. For instance call your local NHS dentist up for an appointment after a while and they will likely tell you that you are no longer registered even though your last visit was less than 2 years ago! As since without any knowledge of registered patients the Dental practice has CHANGED its registered patients rule from 2 years to 15 months ultimately down to 12 months. Which effectively means that an increasing number of British people are no longer able to see ANY NHS dentist! As they are no longer taking new patients. This is just ONE REAL WORLD example of the consequences of out of control immigration.
The Conservative governments failure to control immigration for the past 6 years is just a continuation of the Labour immigration catastrophe that set in motion a 18 year long immigration mega-trend for importation of 10 million people (total immigration) where approx 90% of the adults were expected to vote Labour of which at least 90% are on benefits such as tax credits as the following graph illustrates, that immigration really IS OUT OF CONTROL!
At the current trend trajectory UK net migration could hit 400k within three years. Remember this is ACCUMULATIVE 330k+360k+400k, would total a net immigration population increase of +1.1 million in JUST 3 YEARS! Which would be in addition to natural population growth running at about 230k per annum.
The bottom line is that UK governments demonstrably have NO CONTROL over Britain's borders whilst remaining within the EU, which means that out of control immigration WILL CONTINUE TO PERSIST and the trend for which is BOTH EXPONENTIAL and UNSUSTAINABLE.
The immigration statistics further break down into the following facts:
| Total immigration Year to Dec 2015 | 630k |
| Total emigration Year to Dec 2015 | 297k |
| Net immigration Year to March 2015 | 333k |
| | |
| Total Immigration since 2000 | 8.2 million |
| Total Emigration since 2000 | 5.5 million |
| Net Immigration since 2000 | +3.4 million |
| | |
A key point that the mainstream press has apparently missed is that the net figures mask the reality of what the gross immigration figure of 630k implies, which effectively means that the impact of immigration is DOUBLE to that which the headline figure of 333k suggests i.e. in terms of social cohesion and housing and services for those pockets of the UK most effected by immigration namely London, the South East and other inner cities. Immigration is also one of the driving forces for the buy to let sector as foreign born populations are three times more likely to rent than UK born people, which in large part is due to the benefits system i.e. migrants greater propensity to claim housing benefit.
EU Migration
This graph illustrates accelerating waves of EU migration as each group of accession states were granted free movement for work residency and benefits within Britain. The most recent surges came from EU2 (Romania and Bulgaria) and EU15 (Western and Southern Europe) in the wake of the financial crisis. Whilst EU8 (Poland and Eastern Europe) have remained consistently high for over a decade.
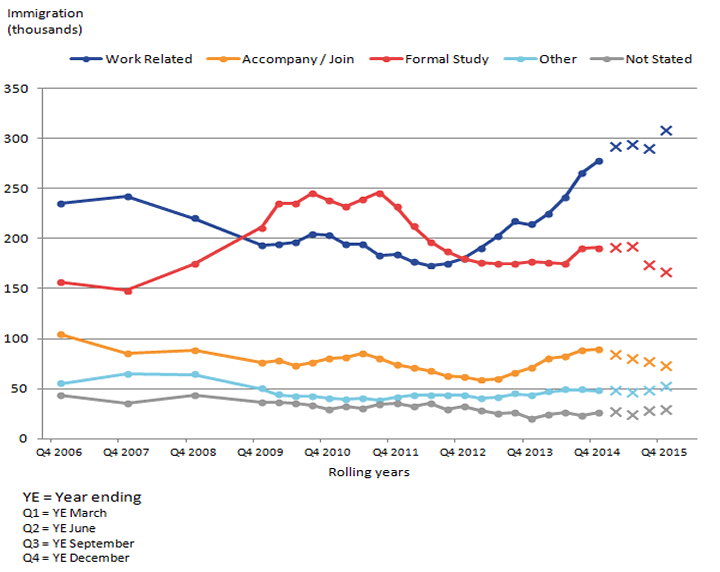
NON EU Migration
Annual Immigration of non-EU citizens is 277k compared with 287k the previous year. Whilst outside EU migration is controlled, generally requiring visa qualification for entry clearance, nevertheless the UK has been experiencing a persistent surge in immigration from mainly China and India which comprises 65% of the total immigration from outside of the EU the reasons for which I will cover in Part 2 of this analysis.
The rise in outside of EU migration has prompted the Conservative Government over the past 5 years to tighten immigration requirements that is resulting in a falling overall trend from 340k per annum 5 years ago to 277k per today which is set against EU migration that has soared from 170k 5 years ago to 270k today, up from 264k the previous year. However as the following NINO analysis will illustrate that actual EU migration is far higher, perhaps DOUBLE the official ONS statistics due to near total lack of control of EU migration into the UK.
ONS Statistics Could be Under Reporting REAL Immigration by 50%!
The mainstream press has belatedly been waking up to the fact that the UK governments official migration statistics compiled by the ONS under report real permanent immigration from the EU by at least 50% per year! For instance ONS EU immigration stats since 2011 saw a net 1.1 million european union migrants permanently settle in the UK. However during this same time period 2.2 million National Insurance numbers were issued to european migrants. I have been flagging this huge persistent disparity in numbers for several years now that illustrates that the official immigration statistics just cannot be trusted!
The most recent ONS release further illustrates this huge continuing disparity as whilst the ONS states 270,000 EU migrants settled in the UK in the year to March 2016. However, during the same time period, 630,000 EU nationals applied for National Insurance numbers, necessary to claim in work and other benefits which is nearly 2.5X the headline ONS statistics!
To further breakdown the ONS statistic so as to get a truer sense at the scale and source of continuing mass immigration reveals that Eastern Europe still accounts for the bulk of mass immigration, then Southern Europe (PIGGS) and then nation's outside of the EU.
The top 5 EU nations NINO total for the year to March 2016 is 443, against an outside EU total of 83k, therefore EU migration comprises 84% of real mass migration underway, and illustrates the magnitude of the crisis.
So Why the Discrepancy Between NINo and Official Statistics?
It all boils down to the Mr bean-esk methodology for measuring immigration 'The Passenger Survey'. Which basically samples passengers entering the UK at its main airports and asks them if they are coming to the UK to visit or to stay and that is how the ONS arrives at its magic fantasy number for the number of migrants permanently entering the UK as those who say they are entering the UK for less than 12 months are NOT COUNTED. So it is becoming apparent that most visitors from the EU tend to state that they are only visiting i.e. for less than 12 months, but instead end up settling permanently given the huge disparity in wages and benefits between Britain and the whole of eastern europe, and thus the official statistics under report real permanent immigration into Britain from the EU by at least 50%!
Even Channel 4 news has belatedly jumped onto the erroneous migration statistics bandwagon by showing permanently settled Polish migrants stating that if they had been asked at the airport whether they were coming to the UK to settle or just visit then they would have said NO they are not coming to the UK to permanently settle, despite having done so (you may be able to see the story on their youtube channel)
John Redwood commented: The fact is over a five year period 1.2million additional people came here, got a job and got an NI number and obviously lived here for a considerable period of time even if some of them have now departed.
And they needed to attend doctors surgeries, to have school places for their children and so forth.
If we look at the figures for GP registrations we see that in the last two years alone an additional 1.1million people have registered for GP services implying that the NI numbers are closer to the truth and implying we need to look at the NI numbers as well as the formal migration numbers when planning public provision.
Whilst Iain Duncan Smith commented to the BBC - "They come in, they do hot bedding in bed and breakfasts and things like that, they then take jobs at much lower rates,"
"This has forced the salaries of people in low-skilled and semi-skilled jobs down so they have suffered directly as a result of uncontrolled borders with short-term migration.
"I'm astonished that a government, my government, can sit here and say we had a pledge to bring down migration to tens of thousands but it's all right then because it doesn't matter how many people come in as long as they don't stay more than 52 weeks."
And to make matters worse, the NI numbers don't include the self employed i.e. all those polish builders. So the true extent of mass EU migration could easily be running at 100k per annum higher even then that which the NINo suggests.
The bottom line is that ONS's migration statistics are not fit for purpose as I have been warning of for some years now. So instead of the most recent ONS statistics implying that net migration is running at 333,000 per annum, the truth could be closer to near twice that number as the NINO number of 630k implies! Which translates into an extra 2.5 million mouths to feed by 2020 as the UK population homes in on 70 million with dire consequences for all aspects of life in Britain from employment, to schooling to social services such as health and not forgetting the housing crisis.
Why People are Migrating to the UK
Contrary to press stories of civil wars, most of the migration (90%) into the UK has been purely economic that includes to study, many of whom turn out to be bogus students who instead are here to work illegally and for permanent settlement.
Which illustrates the fact that approx 60% of all new jobs created have gone to migrant workers, most of whom will be claiming in work benefits such as tax credits that amounts to fraud on the British tax payers, which typically means that for every pound a low income migrant family earns in income then they tend to receive an equal or greater amount in benefits as the following example illustrates:
Family of 6, with both parents working for minimum wage, each earning £8k per annum.
| Employment | £16,000 |
| Tax & NI Paid | £0 |
| Tax Credits Received | £12,448 |
| Child Benefit | £2,892 |
| Housing Benefit | £6,600 |
| Total Benefits | £21,940 |
| Total Income | £37,940 |
| Services (School and Health etc) | £25,000 |
| Total Cost to Britain of EU migrant family | £46,940 |
So a family of six with BOTH parents working will receive approx £22k in benefits ON TOP of their £16k earnings, for a total income of £38k. However on top of this would be in receipt of services of at least £25k per annum i.e. £5k per school place and £5k healthcare costs. THIS illustrates the magnitude of what to all intents and purposes is FRAUD perpetrated on British tax payers as most migrant workers tend to take FAR MORE in benefits than they actually receive in wages whilst paying virtually NO taxes.
Whilst a 3 child family would receive approx £18.5k in in work benefits and a 2 child family £15k which makes a mockery of the claims of hard working migrant families contributing more than they take which is JUST NOT TRUE! And this does not include benefits taken by non working migrant families that are capped at £20k per annum (outside London).
Illegal Immigration
It should be noted that the official ONS statistics exclude ILLEGAL IMMIGRATION. The ONS made the following statement in response to a request for statistics on illegal immigration -
By its very nature it is impossible to quantify accurately the number of people who are in the country illegally. For this reason ONS does not produce estimates on the size of the illegal migrant population.
Whilst my earlier analysis of April 2015 estimated illegal immigration totaled at least 800k (15 Apr 2015 - UK House Prices, Immigration, Population Growth and Election Forecast 2015), which would translate into average annual net migration being between 15% and 20% higher, i.e. rather than net migration of 333k, instead it is probably already running at over 400k per annum and this is before the NINO discrepancy is taken into account.
UK Housing Crisis Consequences
In terms of the impact of out of control EU immigration on the housing market, Channel 4's series 'How to Get a Council House' has done an excellent job of demonstrating the real world impact on the housing crisis, of how the mass migration statistics translate into real world examples of what is taking place right across Britain.
The latest episode to air which is still available online for another 25 days once more demonstrates how out of control EU migration is having a disastrous impact on Britain's housing market. For instance a Romanian family of 7 ( 2 adults and 5 children) is shown arriving into the UK at Hounslow's housing department demanding that they be housed, and after tooing and froing for a couple of weeks for the cameras, are then within 2 weeks housed in a 4 bedroom house in Birmingham at a cost to the tax payer of £750 per month! And in total will likely be in receipt of over £60k in benefits per year! (includes £25k cost for schooling 5 children).
The episode continues with other recent migrants such including a single adult from Bermuda, who expected to be housed, and a family of 3 from Poland and Africa, again expecting to be housed and granted housing by the end of the episode.
Towards the end of the episode the housing support officer is asked "Do you think they should have been housed", to which he answers -
"I think it's a yes, no answer, it does not always seem fair and in this case I think the verdict will be open, there will be some of you who will think, we'll were glad for them. Others might think here's another case of the system being exploited. "
Whilst the romanian male of the family of 7 is asked "Do you know there is a housing shortage here in Britain?" to which he replies -
"I didn't know that, maybe I was one of the lucky ones"
The episode ends with a dire statement from Hounslow's Director of Housing - "We are seeing an increase in applications from overseas. We do not have the supply, we do not have the homes to put them in. The situation can only get worse and we will expect to see those numbers simply grow and grow."
The reality is apparent that eastern europeans know exactly what they are doing to jump the housing queue so as to achieve what British born people are unable to despite waiting for literally decades on worthless housing waiting lists. So when people say that migrants are being given priority over British people, well it is true for EU migrant families at least, for being HOMELESS WITH CHILDREN, means that they are treated as PRIORITY CASES, which is why the housing waiting lists that British born people have been patiently sat on for 20+ years, waiting to be re-housed are FROZEN. And if Brit's make themselves homeless so as to put pressure on the Council, then the Council tends to turn around and inform them that they cannot be helped because they have INTENTIALLY made themselves homeless! Whilst virtually ALL europeans migrating to Britain WITH children are being given housing within 2-4 weeks, and this is the nature of Britain's decade long building housing crisis that has long since passed the critical point. Against which Vote REMAIN's madness is for an unsustainable business as usual!
I have covered the consequences of out of control immigration on Britain's housing market many times over the past few years as illustrated by the following video:

This analysis continues in part 2 that will take a detailed look at what Britain can expect over the coming decades in terms of population growth and the drivers for mass migration such as wars, climate change and the ongoing global population explosion that has seen the worlds population rise from 4 billion in 1974 to 7.4 billion today and on a trend trajectory to hit 10 billion by 2060, and that the high immigration numbers from China and India are a warning of. So ensure you are subscribed to my always free newsletter to get this in-depth analysis and detailed forecasts in your email in box.
EU Referendum - British People vs Establishment Elite
One of the latest propaganda cards played by the Remain in the EU establishment camp was of George Osborne calling on his good buddy, Jamie Dimon, the head of JP Morgan to come to Britain and do his best to scare the British people into voting to REMAIN within the EU on June 23rd as being in the best interests of the British establishment who OWN Britain. So Jamie acted out the role of being the fourth horseman of a Brexit financial apocalypse that would see Britain's financial sector evaporate. Though maybe not on par with the last financial apocalypse that the likes of JP Morgan helped bring about in 2008. That saw the world's governments blackmailed into bailing out the banks to the tune of $trillions of dollars. Where even little old blighty was forced to cough up over £500 billion to bailout Britain's banks, and then had a £4 trillion noose of banking sector liabilities put around the necks of the British tax payer or else face financial armageddon...

https://youtu.be/vKozK4htua4
VOTE FOR FREEDOM June 23rd - BrExit Campaign
There are now just over 2 weeks to go and with the opinion polls (for what they are worth) neck and neck on 45%, it's a case of now or never, the final push to secure freedom for Britain.

By Nadeem Walayat
Copyright © 2005-2016 Marketoracle.co.uk (Market Oracle Ltd). All rights reserved.
Nadeem Walayat has over 25 years experience of trading derivatives, portfolio management and analysing the financial markets, including one of few who both anticipated and Beat the 1987 Crash. Nadeem's forward looking analysis focuses on UK inflation, economy, interest rates and housing market. He is the author of five ebook's in the The Inflation Mega-Trend and Stocks Stealth Bull Market series that can be downloaded for Free.
Disclaimer: The above is a matter of opinion provided for general information purposes only and is not intended as investment advice. Information and analysis above are derived from sources and utilising methods believed to be reliable, but we cannot accept responsibility for any trading losses you may incur as a result of this analysis. Individuals should consult with their personal financial advisors before engaging in any trading activities.
| Digg This Article
-- Published: Thursday, 9 June 2016 | E-Mail | Print | Source: GoldSeek.com


