-- Published: Tuesday, 14 June 2016 | Print | Disqus
By Plunger
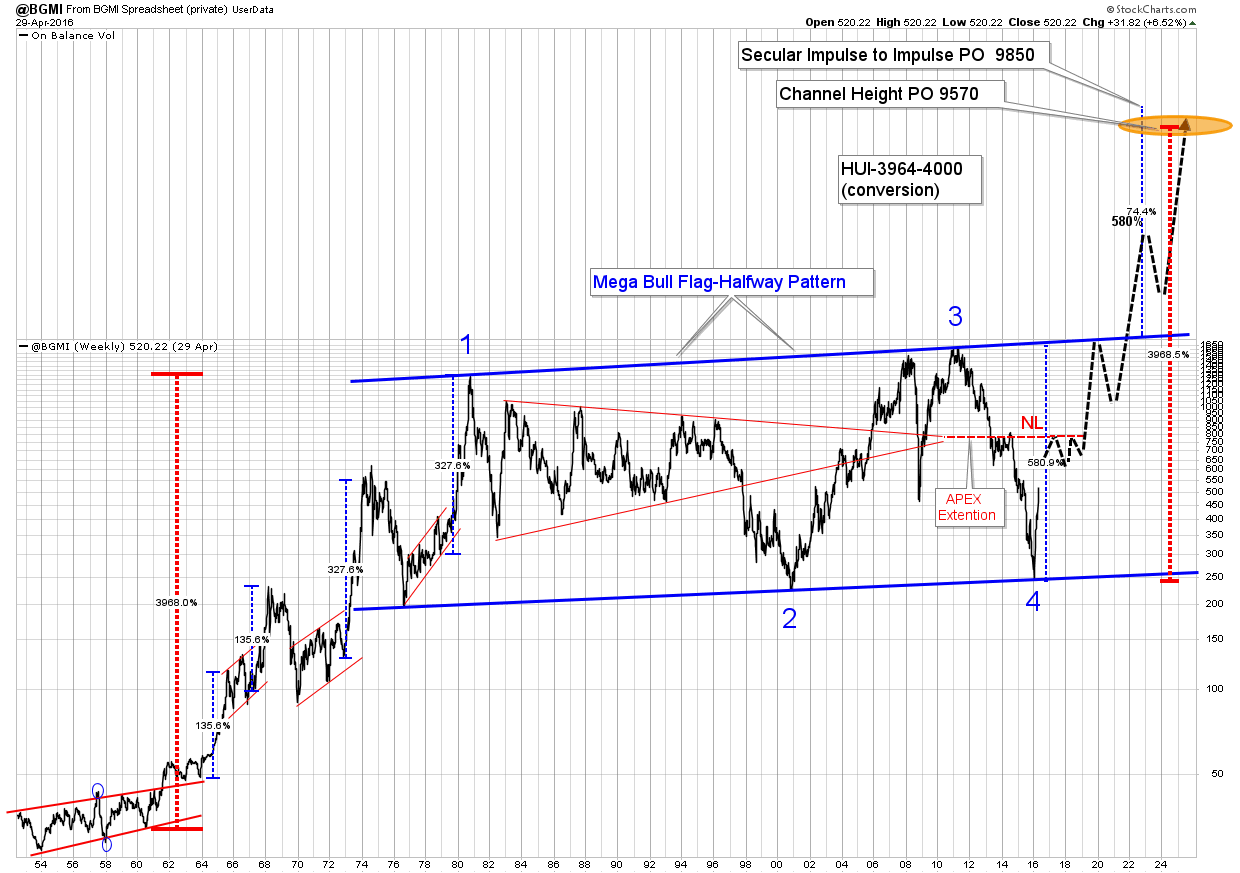
The worlds monetary system is in a slow motion train wreck! In response gold is emerging from the shadows to become the worlds premier currency once again, and gold stocks are the best proxy to capture this trend. How high could the precious metals stocks go? Shockingly high is what the Barrons Gold Mining Index (BGMI) is indicating. This index goes back to 1939 and is setting-up for the final leg in the great secular bull market in gold stocks which began in 1960. This long term bull trend really got in gear in 1964 when the US government removed silver from its circulating currency. All silver coins were recalled and replaced with tokens resembling the traditional metal coins. The PM equities were not fooled however, as they responded by embarking on a powerful secular impulse move that lasted until 1980. Bull markets progress through developing stages powered by themes often unforeseen at the beginning of the bull. These newly recognized forces propel them to higher heights as time goes on. In 1971 Nixon and the treasury department reneged on Americas venerated monetary covenant with the world, euphemistically calling it the closing of the gold window. Once this sacred standard was gone, the difference between money and credit became blurred and the amount of credit increased in the US by over 50 times within the next 40 years.This article makes the case that the BGMI is signaling a 17X move from current price. This price objective may seem impossible so I develop big picture case that will drive price to this new order of magnitude. The BGMI is an index dating back to 1939 composing of senior gold and base metal producers. Because of its base metal component. it tends to be more conservative than todays HUI and GDM, therefore the BGMI actually understates performance relative to the HUI in a gold bull market. Nevertheless, price conversions from the BGMI into the HUI are simply astounding. Below is the period from 1953-current with its price objectives of both the BGMI and HUI. The HUI is projected to reach an objective of 3964-4000. That is a 17 fold return from todays price.
The Technicals
The above chart encapsulates a giant 50 year secular bull market in the gold stocks with a mega-sized bull flag dominating the majority of the range. Its initial impulse began back in 1960 and had a 20 year 40X run. It then underwent 36 years of consolidation while building out a massive bullish flag formation. It is my working hypothesis that this bull flag is actually a half-way pattern to the much larger complete secular move. If this is so we can expect an impulse move starting at point 4 of equal size as the move from 1960-1980. The implications of this sized move point towards gold playing a role as an anchor in the next monetary system. So far the gold price has not reflected the 50 times increase in credit and base money since the end of Bretten Woods I in 1971. Any new monetary regime that allows the gold price to parallel the growth in credit over the past 40 years would propel the gold stocks well above this bull flag. This monetary development would be the force behind the BGMI completing a measured move of 40X from its early 2016 lows. Gold would be revalued by an order of several magnitudes possibly to $5,000 to $10,000. Later on we will chronicle the macro environment which could lead to this outcome.
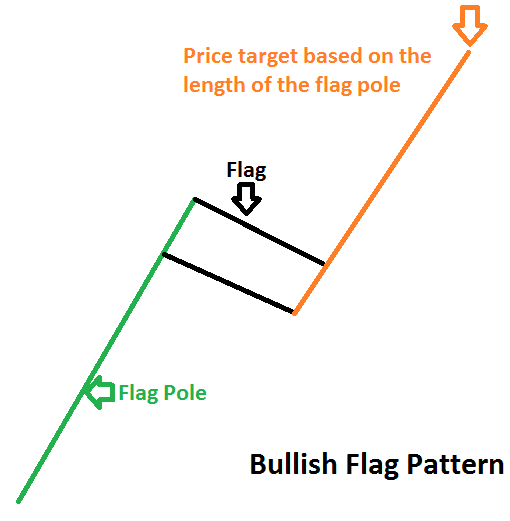
The Principle of the Flag Pole and Measured Move
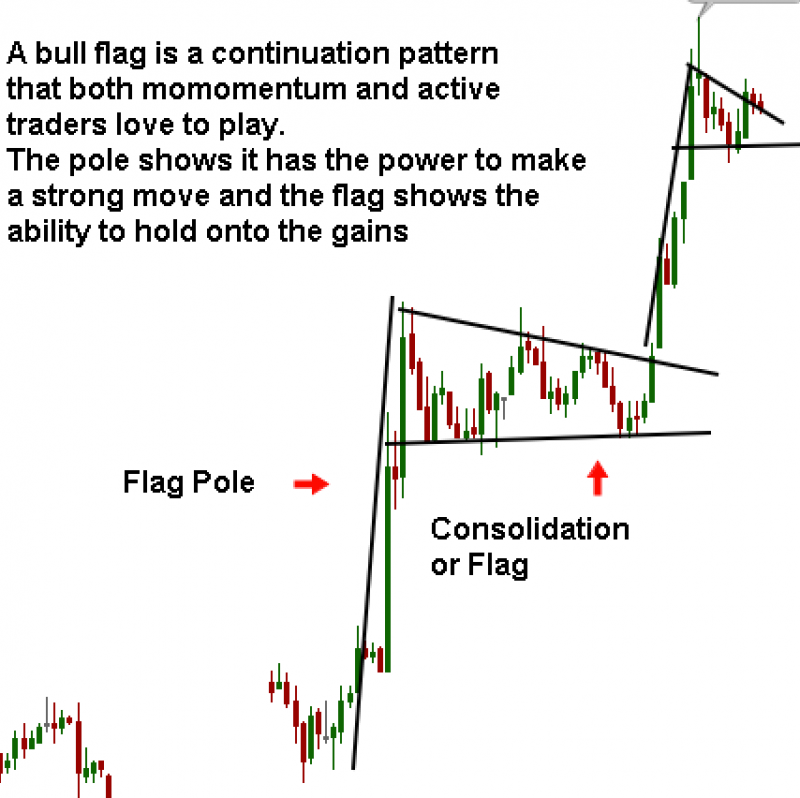
A Bull Flag is a technical pattern designating a strong uptrend. The pole is the impulse move and the flag is a period of consolidation of the move. The bullishness comes from the underlying psychology where despite the strong vertical rally of the pole, price refuses to drop back to the beginning of the pole. Once the consolidation of the flag is over price rises in a powerful move higher measuring the length of the prior flag pole. Below are two examples of this principle. The first is the idealized model and the second is an example from the real world.
We use this model to forecast the price objective of the BGMI.
The First Leg Up 1960-1980
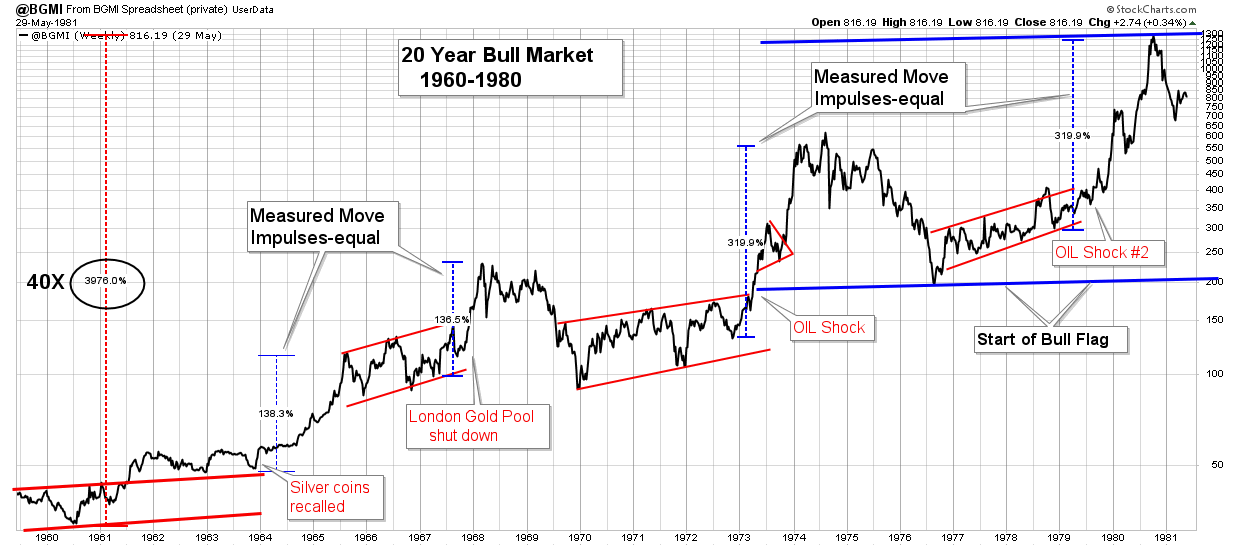
Lets drill down and look at the 20 year bull market that makes up the flag pole in the first chart. The period from 1960-80 encompassed several events all related to the unleashing of gold. In 1954 the Swiss removed the price ceiling on gold traded in Switzerland, meanwhile the free market also opened in London in that year. Monetary expansion occurred surreptitiously throughout the 1940s-1950s despite the US fixing its gold price. Eventually this created an upward force on gold. As a result, in 1961 eight of the most powerful central banks created the London Gold Pool, with the intent to cap the price at $35. This was an open and admitted operation to prevent the price of gold from rising by selling real bullion into the market.
Meanwhile monetary expansion continued throughout the decade of the 60s with the US paying for the Vietnam war and social programs on its credit card. In 1964 the US felt the need to remove silver from its circulating currency due to silvers sensitivity to inflationary forces. In recognition of this, the BGMI underwent a 138% impulse move over the next 18 months accommodating this inflationary event. By 1965 the London Pool began feeling the pressure of increased demand and over the next 4 years efforts to cap the price became more and more desperate. By 1966 the Russians ceased selling into the market, followed immediately by central banks having to sell from their national reserves to maintain order in the market. Speculative fever by private buyers increased, causing extraordinary measures to be adopted by central banks to continue the price suppression. By 1968 this system further broke down resulting in the Pool being dissolved and the institution of a two-tier pricing system with the US drawing down its massive gold reserve to settle official settlements between nations at a fixed $35 while the second tier allowed private purchases to seek a free market level. This ability to arbitrage the price of gold by private interests only fueled speculation and directly led to the USA removing itself from the last remnants of the gold standard in 1971.
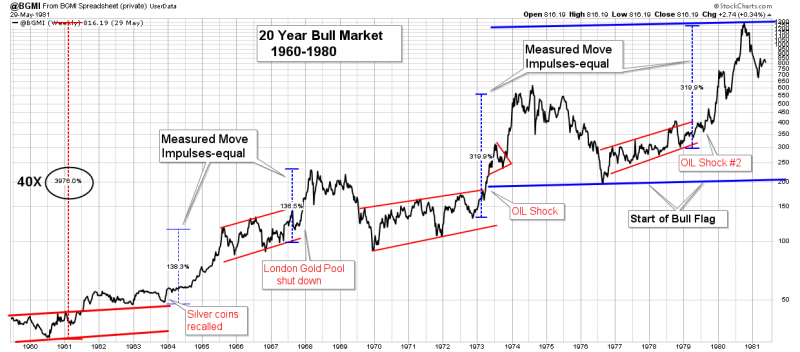
After America reneged on its gold covenant to the world, the USD no longer had any tethers and credit began a 50X expansion over the next 40 years. Once gold became removed from the system oil, another real asset, became a proxy reflecting the rise of monetary aggregates. The two oil shocks of the 1970s resulted in the oil price bounding upward. These price increases were really just a real asset playing catch-up to the rise of base money and credit in the system. The BGMIs two impulse moves of the 1970s. were made in sympathy to the rise in the oil price. These two impulse moves were of a higher order than the 60s version, but also equal in size and duration to each other. The chart above chronicles these events and shows the gold stocks accurately responding to them,
36 Year Consolidation and a Measured Move
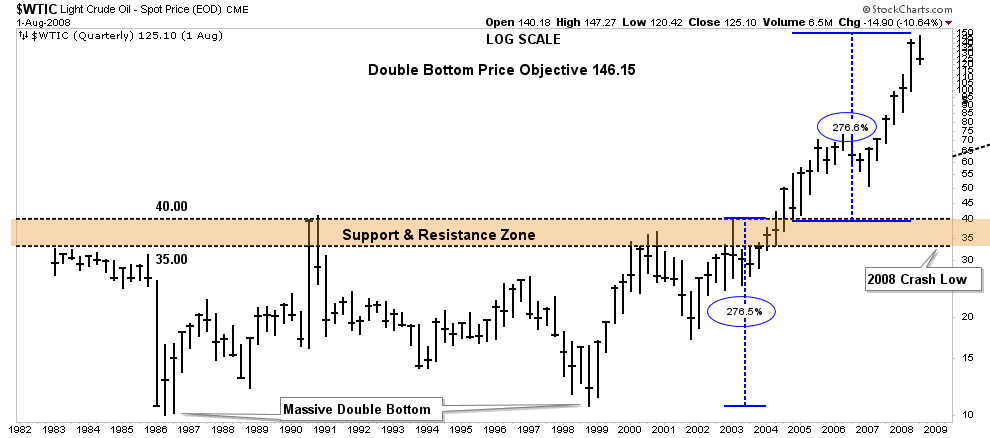
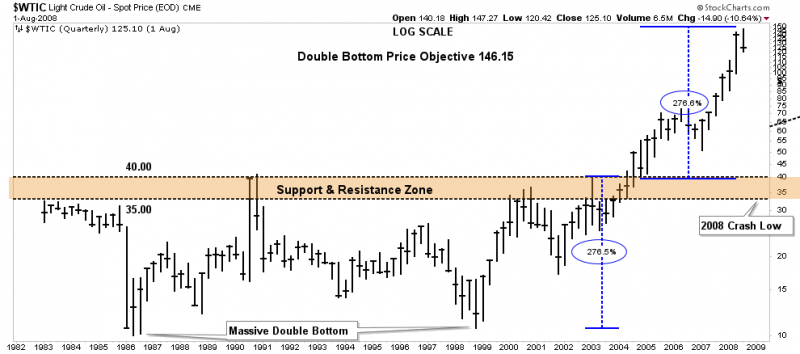
Since 1981 the BGMI has been consolidating the flag pole gains of the previous 20 years from 1960-80. After such large gains markets typically take a prolonged period to digest them. Once this process is complete the market will be ready to break out of its consolidation and advance to the next level. Referring back to the first chart, we are able to project a measured move using two techniques, an impulse to impulse move and a channel height measured move. Both of these methods achieve similar price objectives. The bull flag traces out a 4 point continuation pattern over a 36 year period. This pattern projects an upside measured move equal to the length of the impulse of the flag pole from 1960-80. Secondly, the 36 year channel height projects a move to virtually the same objective as the impulse method. Here we stack the width of the channel on top of the upper boundary to achieve our price objective. An excellent example of this occurred with the long term price breakout in the oil market in 2004. After a 30 year $10-40 consolidation range oil broke out and traveled the width of its channel to a perfect measured move objective. The pole leading into this channel beginning in 1974 went from $1.85 to $40 bbl. This was such a huge percent move that it took 30 years to consolidate, similar to the BGMI. Once this consolidation was complete it broke out and began a 3 year impulse move to $147. Amazingly, this was the same percent move as its channel height which had contained it for 30 years. This move is shown in the chart below and this same technique measures the BGMIs ultimate price objective to 9570.
So using these two methods we can project an upside price objective of the BGMI. To estimate an equivalent level in the HUI I have used a linear conversion to the BGMI. This is a conservative approach, so it is actually erring to a lower objective, but achieves an HUI price objective of 3964-4000.
Getting your Head Around Gold Price Suppression
We must discuss gold price suppression if we are to understand the upcoming impulse force driving the gold stock price. I understand people dont want to go there because people fear mainstream thinkers will tag them as a nut job, but we have to do it. Sorry to have to burst your bubble, but gold price suppression is real, and it exists in the center of monetary power. Dont take my word for it, read the words of Larry Summers written before he became associated with the US Government or became an acting monetary authority. In the early 1980s he wrote Gibsons Paradox and the Gold Standard which explains why governments need to keep control of the gold price. He stated that gold is the determinant of currency values, government bonds and interest rates. In fact a free gold price is the determinant of all economic values on earth. Summers argues that interest rates and thereby bonds are inversely correlated with gold. The implication is that for governments to achieve high bond prices, and thereby fund the expansion of government they require maintenance of a lower gold price.
This knowledge is the key to the kingdom in understanding why it is in the interest of monetary authorities to have a low gold price. Because gold is potentially the worlds independent currency and government largess is a function of maintaining a low gold price it is essential for entrenched powers to keep control of the gold price. Lets boil it down to one truism: Control of the gold price is control of the world.
Managing the Gold Price From Overt to Covert
The London Gold Pool operating from 1960-68 was an overt campaign to suppress the gold price using actual physical metal sourced from sovereign vaults to sell directly into the market. This worked for around 10 years but finally ended as governments were no longer willing to throw scarce gold down a bottomless pit to halt the rise in price. Something else needed to be done. For the next 20 years that solution was the rise of the Petro dollar. On the advice of Assistant Sec of State Thomas Enders, Henry Kissinger negotiated and achieve an exclusive oil invoicing system with OPEC. Going forward all oil would be invoiced only in the USD and no longer in a basket of various currencies. In return, the US would guarantee the security of the Saudi royal family and its national borders. This arrangement solidified immense power in the US by securing a permanent demand for the USD as long as the world consumed oil. The USD was now a hard currency, it had become the Petro-Dollar. This arrangement calmed the worlds monetary system for the next 20 years. Ultimately however, it set the stage for wanton money printing and its abuse awakened gold by 2001 thus igniting the next leg of the secular bull market in gold.
Throughout the 1990s central banks engaged in an ongoing messaging campaign to manage the gold price. Central bank sales were publicly announced in advance to knock down the gold price. Often these were canards and never made good, just words. Finally, with their gold coffers empty and gold advancing in 2001 a new strategy was in order. It was now time for suppression to go from overt to covert. ETF gold investment vehicles were created as a proxy for real gold. These ETF paper contracts serve to absorb massive amounts of demand without effecting the gold price. The mechanism for this is the gold which backs it can be hypothecated and re-hypoticated multiple times. These gold shares have been vastly over subscribed and are very convenient for market rigging purposes. In addition to absorbing gold physical demand into a paper contract they can be used to short gold. Gold, a scarce asset can now be shorted in unlimited quantities as long as physical repatriation is not demanded. The obvious purpose is to be a tool to put a cap on golds price. For anyone doubting the true intent of these ETFs and whether they act in your best interests as a fiduciary securing your investment, I refer you to this line in the prospectus under the section Risk Factors:
These subcustodians may in turn appoint further subcustodians, but the Custodian is not responsible for the appointment of these further subcustodians. The Custodian does not undertake to monitor the performance by subcustodians of their custody functions or their selection of further subcustodians. The Trustee does not undertake to monitor the performance of any subcustodian. Furthermore, the Trustee may have no right to visit the premises of any subcustodian for the purposes of examining the Trusts gold bars or any records maintained by the subcustodian, and no subcustodian will be obligated to cooperate in any review the Trustee may wish to conduct of the facilities, procedures, records or creditworthiness of such subcustodian.
So the point of this review is to show how over a period of 65 years we can see that monetary authorities have employed various methods to manage the gold price. In the early years, when ample reserves existed, bullion itself was simply sold into the market to manage price. Once these reserves were exhausted the efforts became covert and the ongoing campaign to manage price became subterranean and complex. This campaign could likely continue on for a considerable time, however we may be coming to a point where it no longer serves the purpose of the financial establishment to continue the suppression. Enter deflation.
Deflation-The Neutron Bomb that ends the game
The 50 fold increase of credit since the end of the Bretton Woods system artificially stimulated economies far beyond the natural order of a sound monetary system. A sound economy is not simply a matter of borrowing and spending, it is a matter of spending wisely. Through mal-investment we have built up an edifice of non-productive debt which is the type that makes us weaker not stronger. So we have now reached the end of the debt super cycle and are one knot above stall speed. We have attempted to support the system with QE, however its great deception is that it was never about jobs or stimulating the economy, but it was about supporting the collateral of all these debts. The purpose of QE was to prevent rates from rising and allowing price discovery. Government bonds are the collateral which support the huge column of debt throughout the world. If sovereign bonds were allowed to fall it lights the fuse leading to collapse. With interest rates now near zero economies are now trapped by the math. The treasury game is over, they cant increase in price, therefore bonds cant support a further increase in debt. Enter Gold.
Fed governor Lyle Gramley stated before his death, that if gold was revalued from the official on the books price of $42 the FEDs balance sheet would be a lot better. In fact he hinted that a big upward revaluation of gold may figure heavily in the future. A gold price of $10,000 would balance the supply of base money to our reported gold stock, however $5,000 may be more politically acceptable. This would greatly diminish the burden of debt and becomes more and more acceptable as our debt levels rise. This will not occur however, until all the major players have acquired their agreed upon stores of gold. We know China has been in a frantic rush to obtain their desired allotment, and they are now within a few short years of reaching this.
The individual citizen is beginning to discern gold is not just an inert asset, but is a solution to their fears. This picture has been slowly developing and the public is now seeing it come into focus. From 2011- 2015 gold declined reflecting renewed faith in the monetary system and the FEDs ability to manage it. Now however, its becoming slowly evident to the public that the FED is losing control. At some point this understanding will reach a critical mass and there will be a point of recognition and rush into the metal.
The slow motion train of monetary transition is actually speeding up now. As Hemingway answered to how he went bankrupt: Two ways. Gradually, then suddenly. An astute observer can see elements of this process occur regularly. The inflection point could come from anywhere, however a place to watch is China. If we see a resolution between the paper price and physical price from the new Shanghai exchange we will know the end of the game is upon us.
At Chartology we have identified the strategy, come join us, and remember youve got to be in it to win it!
| Digg This Article
-- Published: Tuesday, 14 June 2016 | E-Mail | Print | Source: GoldSeek.com