-- Published: Wednesday, 29 June 2016 | Print | Disqus
By Steve St. Angelo, SRSrocco Report
The collapse of the U.S. economic and financial system accelerated this year, thus pushing the country closer to a third-world status. Most Americans are unaware of the dire consequences facing the nation, so they continue to believe business as usual will continue indefinitely.
Unfortunately, lousy reporting by the Mainstream media along with the publics denial and delusional thinking is a recipe for disaster for most Americans over the next several years.
The U.S. economy is being propped up by a great deal of monetary printing, Fed stock and bond purchases and extreme leverage in all areas of the market. While these policies have given the ILLUSION of continued prosperity, or at best a sustainable slow growing economy, the debt now in the system is unsustainable.
Still to this day, most investors (including precious metals investors) do not understand the real reason for the massive increase in U.S. Federal debt. They believe the debt was either increased to enslave Americans or to fund continued economic growth. While the second reason is more accurate, they still fail to understand the ROOT CAUSE of the debt increase.
The Massive Increase In U.S. Debt Tied To Falling U.S. Oil Production & Rising Oil Prices
This chart puts the huge increase in total U.S. debt in perspective:
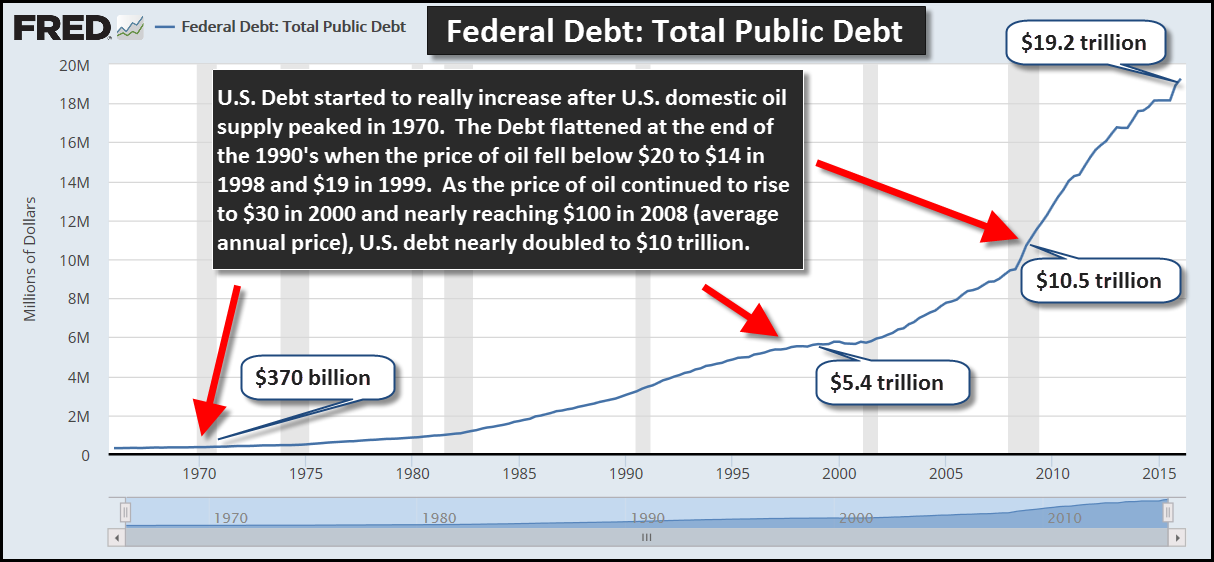
The annual increase in U.S. debt was very small up until the 1970s. This was due to the peak of cheap U.S. domestic oil production. U.S. oil production peaked in 1970 at about 10 million barrels per day (mbd). That year, total U.S. debt was $370 billion. Thats hilarious, because the annual deficits today are larger than the entire U.S. debt in 1970.
As the oil price increased in the 1980s and as U.S. oil production declined, total U.S. debt continued to increase. However, in the late 1990s, the U.S. debt leveled off. This was due to the price of oil declining below $20, reaching $14 in 1998 and $19 in 1999. In 1999, U.S. debt had increased to $5.4 trillion.
Then as the price of oil increased from $30 in 2000 to nearly $100 in 2008, total U.S. debt nearly doubled to $10.5 trillion. In addition, U.S. domestic oil production declined nearly 4 million barrels per day from 1985 to 2008. This also had a negative impact on U.S. debt levels.
While its true that the cost of energy is only a small part of U.S. GDP, its impact is multiplied when the U.S. economy and government try to provide the same standard of living as it did prior to 1970. Furthermore, the EROI- Energy Returned On Invested of U.S. oil production declined significantly since the 1950s. The EROI of U.S. oil and gas production in 1970 was 30/1, however shale oil comes in at a low EROI of 5/1.
Thus, the falling EROI means less profitable barrels to provide the same (higher) standard of living as Americans enjoyed before 1970.
The U.S. Economy Is Propped Up By Massive Govt Spending
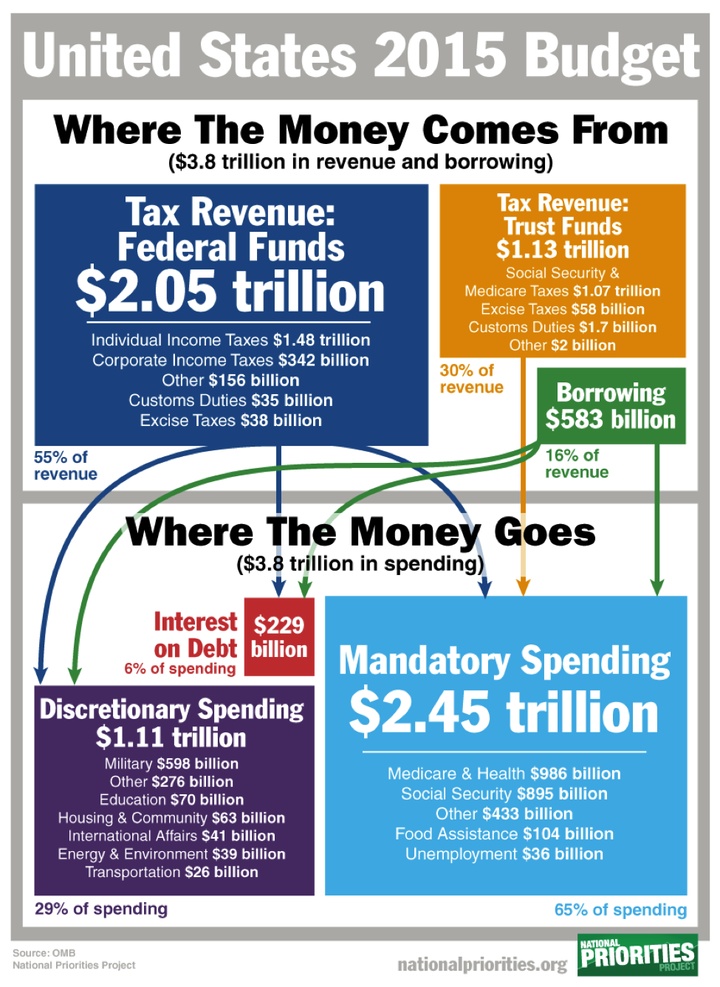
In fiscal 2015, the United States Govt. (supposedly) spent $3.8 trillion on mandatory, discretionary funding and interest on the debt. Total revenues were only $3.18 trillion, so the U.S. Govt had to borrow $583 billion to pay its bills:
These next two charts break down the Mandatory and Discretionary spending:
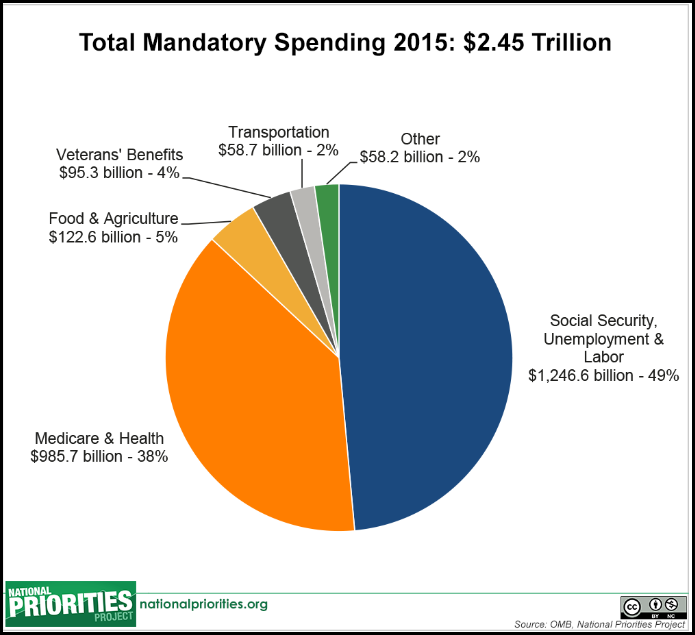

The $3.8 trillion in U.S. Govt spending is 21% of total U.S. GDP for fiscal 2015. Even though the U.S. Govt spends a lot of money on many different areas, lets focus on Social Security and Medicare-Health. These two parts of the mandatory spending equal $2.2 trillion of the $3.8 trillion total Federal budget. This is nearly 58% of the total budget.
That $2.2 trillion spent in the U.S. economy has a MULTIPLIER EFFECT. This is the reason the Fed and U.S. Govt wont allow a collapse in stock, bond or real estate values. The revenues collected by the U.S. Govt depend on elevated stock, bond and real estate prices. Once these start to collapse, then revenues plummet causing the annual budget deficit to balloon higher. If the budget deficit was $583 billion (thats what the Govt reports) in 2015 ,then what happens when the market cracks and highly inflated stock, bond and real estate prices collapse?
Well, we already experienced that in 2008. Here is the most recent update of the U.S. Retirement Market as of Q1 2016:
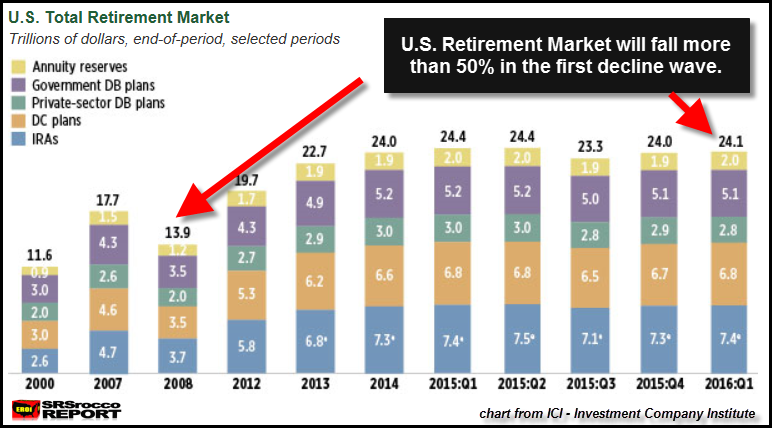
The total U.S. Retirement Market collapsed 21% from 2007 to 2008 ($17.7 trillion down to $13.9 trillion). The current U.S. Retirement market is valued at $24.1 trillion. When the U.S. broader markets finally crack, I forecast a 50% decline in the U.S. Retirement market in the first wave. This could take place over a few years. A 50% decline would put the U.S. Retirement market at $12 trillion, a little less than what it was in 2008.
This is highly likely as the markets have been propped up with a lot of leverage since 2009. A 50% decline in the stock and real estate prices will cause serious trouble to the entire U.S. economy and financial system.
THIS IS THE CRASH WE NEVER COME OUT OF.
U.S. Financial & Economic Market Suffered Two Big Blows
As I mentioned in the beginning of the article, ENERGY has been the key in pushing the U.S. debt to record levels. Now, you would think that the huge increase of domestic U.S. shale oil production would have helped stabilize the annual increase of U.S. debt
.. IT DIDNT. Actually, it did the opposite.
Unfortunately, the addition of U.S. shale oil production came at a huge cost. It only added more overall debt to the system. Even though the price of oil remained above $100 for three years, most of the shale oil companies made no real profit. Which means, the increase of U.S. domestic oil production from 5 mbd in 2008 to a peak of 9.6 mbd last year, did nothing to keep the U.S. debt from rising.
This was due to two reasons:
- The U.S. Govt continued to print money while suffering even larger annual budget deficits to provide a standard of living for Americans that it really couldnt afford.
- The EROI- Energy Returned On Invested of U.S. shale oil production of 5/1 was way too low to sustain our modern economy that needs something north of 12/1.
While the situation for the United States became even worse as domestic oil production surged higher, the consequences will be even more dire as oil production plummets over the next several years.
Top Two Shale Oil Fields Suffer Hugh Production Losses
The top two shale oil fields in the U.S. suffered huge production losses over the past year
especially over the last six months.
The Bakken Oil Field in North Dakota was touted to make the U.S. energy independent. While the author of this article never believed the hype by the U.S. Energy Industry, many Americans fell for this delusion. As the price of oil declined on top of exceedingly high decline rates, Bakken oil production has dropped significantly.
How much??
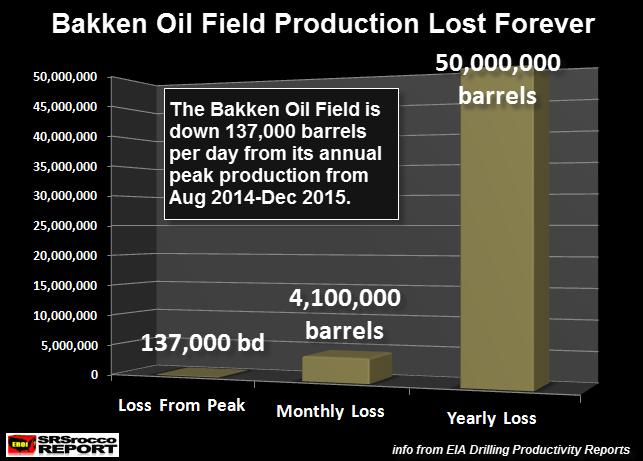
If we go by the minimum production between August 2014 and December 2015, the Bakken is down 137,000 barrels per day (bd). While the Bakken achieved a much higher production peak, I am going by the minimum oil production achieved in that time-frame.
Thus, the Bakken will now lose 4.1 million barrels of oil in a month and 50 million barrels in a year compared to what it was producing last year. A loss of 50 million barrels in a year from the North Dakota industry is a BIG DEAL. That being said, the Bakken will continue to lose production going forward so the annual production loss will be even greater than 50 million barrels. At $50 a barrel, North Dakota is losing $2.5 billion a year.
NOTE: A small part of the Bakken is located in Montana, but this doesnt really change the overall situation for North Dakota all that much.
Now, if you think the loss of production from the Bakken is bad, you need to take a look at the disaster taking place at the Eagle Ford Field in Texas:
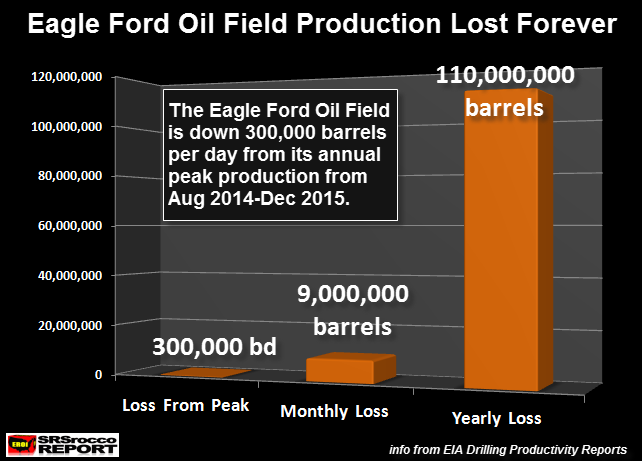
The Eagle Ford has lost 300,000 barrels per day since its minimum production between Aug 2014 and Dec 2015. Thats one hell of a lot of oil. In Dec 2015, the Eagle Ford was production 1,508 thousand barrels per day (1.508 mbd) and is forecasted to decline to 1,212 thousand barrels per day in June. This is a 20% decline in six months.
Thus, the Eagle Ford will now lose 9.1 million barrels of oil per month and a whopping 110 million barrels annually. Again, this is only if production stabilizes. That figure continues to increase as Eagle Ford production continues to decline.
While some individuals believe the decline in U.S. shale oil production was due to falling oil prices, this was only part of the reason. According to the energy analysts that I have been reading, these two shale oil fields were going to peak between 2015-2017, even with higher oil prices. So, yes
the low oil price forced the peak a little sooner than later.
What happens as U.S. shale oil production continues to decline?? Well, it puts more pressure on the U.S. energy sector that is saddled with debt up to their eyeballs. Here is a chart I published in one of my articles a few weeks back:
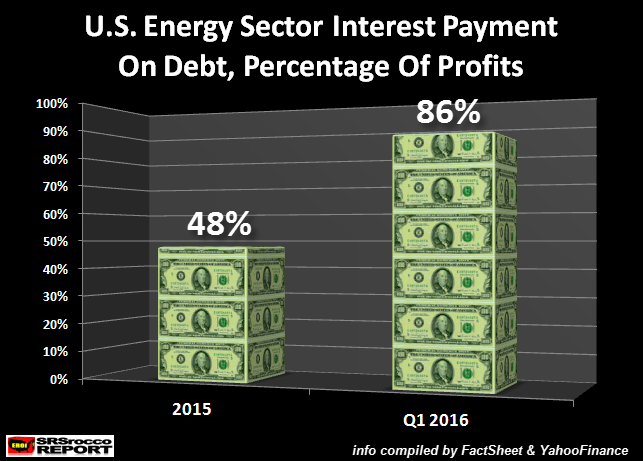
If the U.S. Energy sector is paying about 50% of its operating profits just to pay the interest on its debt (2015)
WHAT HAPPENS AS OIL PRODUCTION DECLINES?? Correct
it just makes a bad situation WORSE.
Americans have no clue the dire situation they face. No longer will we be able to offer U.S. Treasuries in the future for oil. Of course, this wont end overnight, but the trend is not on our side.
The healthy U.S. economy and financial system in the 1950s-1960s was powered by its cheap domestic rising oil production. This is why we were the powerhouse of the world. However, as the years went by and domestic oil production declined as prices increased, we were forced to use the ENERGY CREDIT CARD.
While this worked for many decades, the ENERGY CREDIT CARD BALANCE now is unsustainable. The decline of U.S. shale oil production will speed up the demise of the U.S. economy and empire.
If Americans havent connected the DOTS by purchasing physical precious metals, the majority of their supposed wealth will EVAPORATE into thin air. Even though owning precious metals doesnt guarantee an individual will make it through the coming economic and financial collapse unscathed, it will at least offer better options than 99% of the Americans out there.
Check back for new articles and updates at the SRSrocco Report.
| Digg This Article
-- Published: Wednesday, 29 June 2016 | E-Mail | Print | Source: GoldSeek.com


