-- Published: Sunday, 10 July 2016 | Print | Disqus
By Steve St. Angelo, SRSrocco Report
The top two gold miners burned a record amount of fuel to produce gold in 2015. Even though Barrick and Newmont burned less overall fuel than their operations did in 2013, their consumption per ounce of gold produced was the highest ever.
This is not good news for the gold mining industry as the world has peaked in cheap oil production. While total global liquid energy production continues to be at record levels, the high-value cheap light sweet crude oil peaked several years ago. Furthermore, we are now witnessing the rapid decline of U.S. oil production as many of the shale oil fields go into terminal decline.
As shown in these next two charts, the Bakken and Eagle Ford are forecasted to be down 437,000 barrels per day (bd) from their minimum production between August 2014 and December 2015:
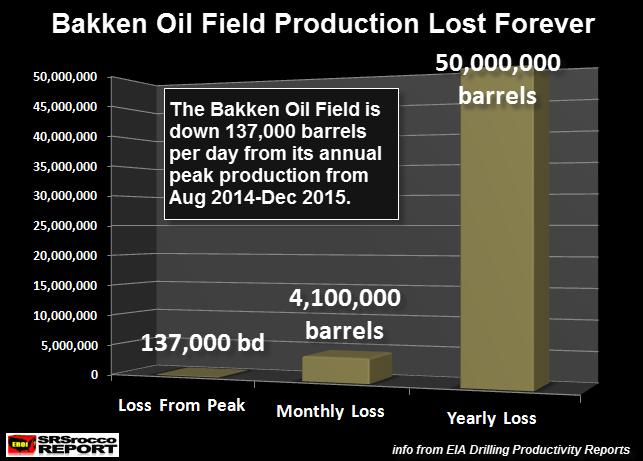
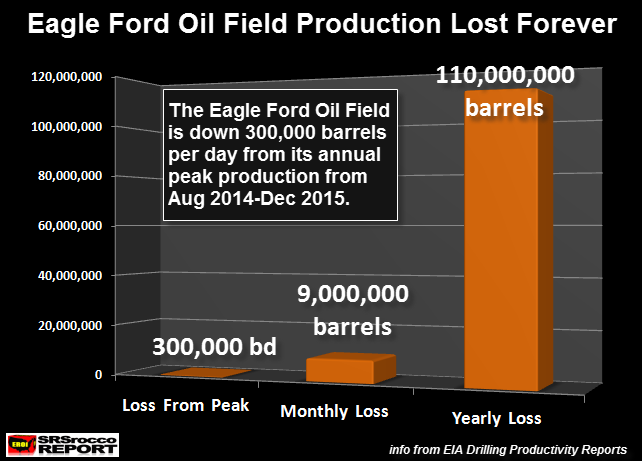
The production loss from these two fields will equal 160 million barrels in a year
and thats if their production doesnt continue to decline. Dont worry
it will. As I have stated in several interviews, I forecast U.S. oil production to decline 30-40% by 2020 from its peak in 2015, and be down 70-75% by 2025. We will also start to see declines in other oil-producing countries throughout the world.
Top Two Miners Burned The Most Fuel Ever In 2015 To Produce Gold
Thats correct, Barrick and Newmont used more liquid fuel than ever to produce an ounce of gold in 2015:
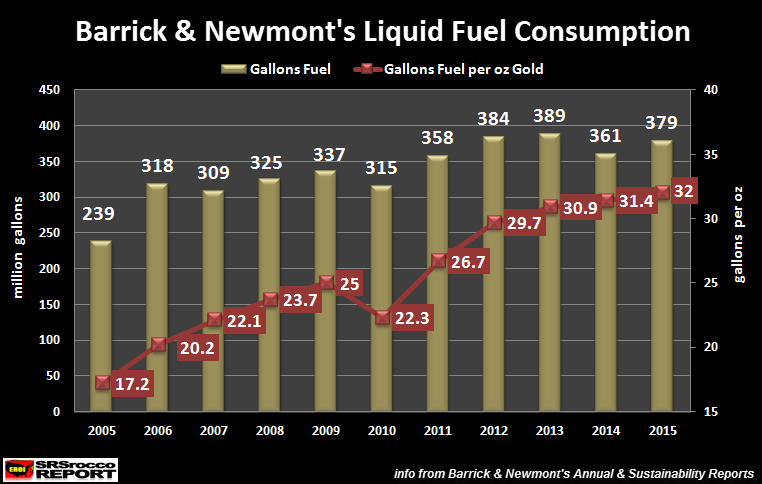
Between the two companies, they burned a total of 379 million gallons of fuel at an average 32 gallons per gold oz produced. Even though Barrick and Newmont burned more fuel in 2013 (389 million gallons), their consumption per gold ounce was less at 30.9 gallons.
Here is the breakdown of the two individual companies fuel consumption:
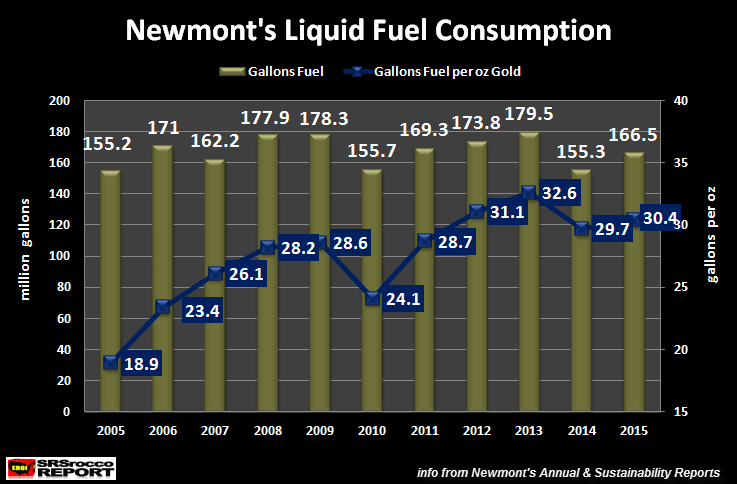
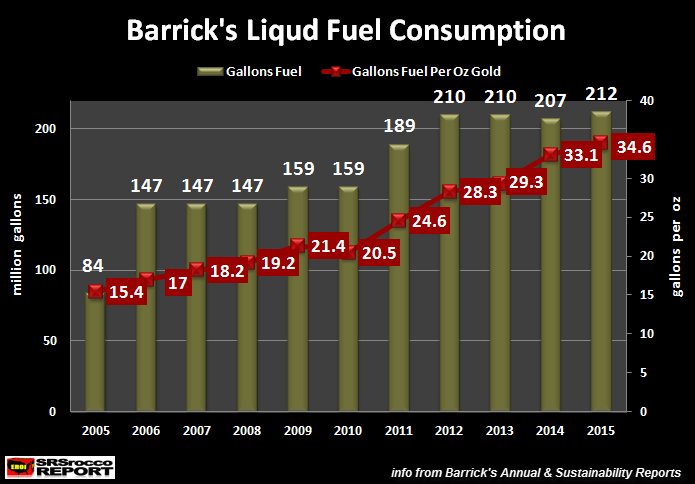
While Newmonts fuel consumption fell to 30.4 gallons per oz gold (gal/oz), from its peak of 32.6 gal/oz in 2013, Barricks increased to a new record of 34.6 gal/oz. The combination of the two in 2015 still reached a new record of 32 gal/oz in 2015.
I have to say, acquiring the information for these fuel consumption figures has become quite difficult and frustrating to say the least. The data for fuel consumption is reported in the companies Sustainability Reports. The information used to be easier to access a few years ago. However, several companies are no longer reporting a breakdown in the different energy sources, but rather list it as Indirect or Direct energy consumption.
I tried to get Goldcorps liquid fuel consumption for 2015, but they no longer report that in their materials part of their Sustainability Report. Instead, they list it as total indirect or direct energy consumption. Indirect energy is purchased grid electric power, while direct energy would be the diesel to run the massive earth moving machines or other energy sources for generators that provide power for their mining operations.
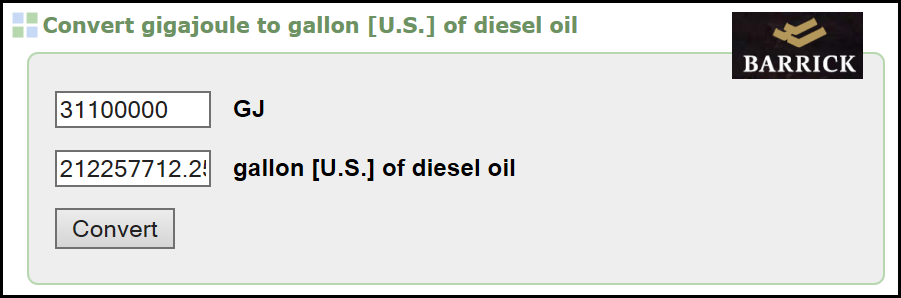
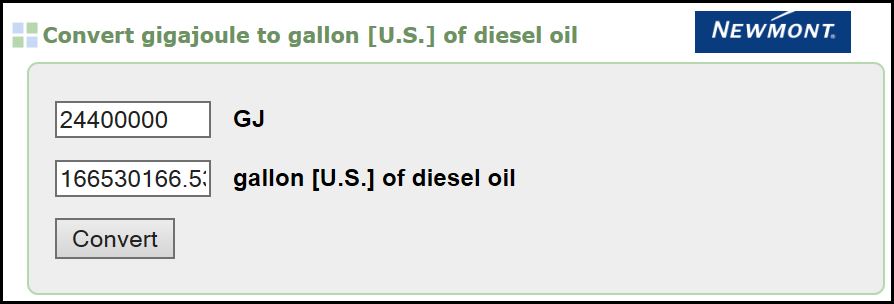
Furthermore, the companies report their figures in all different metrics. Some use Gigajoules, while others use Kiloliters or metric tons for example. So, everything has to be converted to gallons. To show my readers where I get this data and how I convert it so there are no questions
. look at the images below:
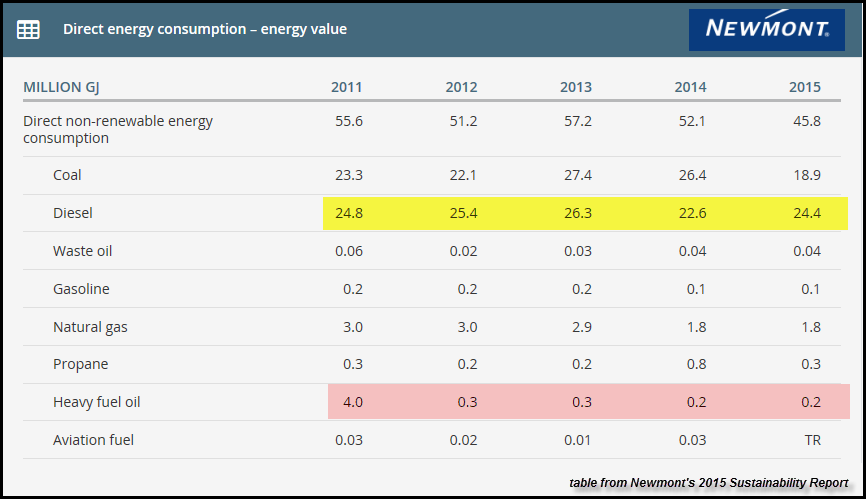
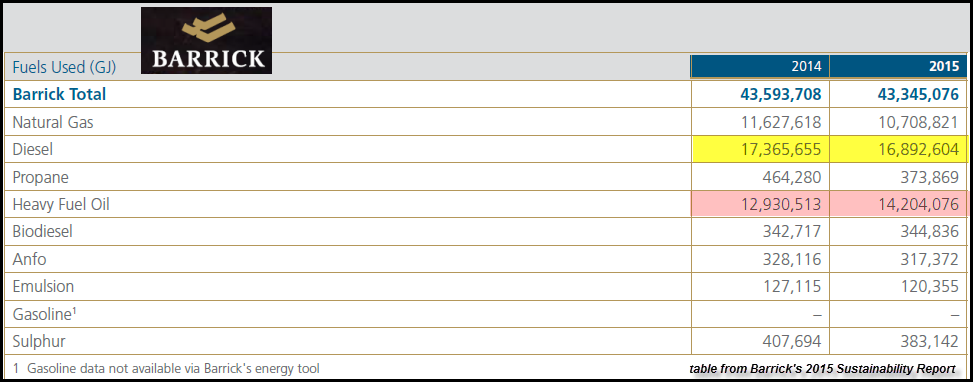
While Newmont burns a lot more diesel to produce their gold, Barrick burns a lot of heavy fuel oil. A percentage of Barricks heavy fuel oil consumption is used to power generators that supply electricity to operations that may be too remote to be able to tie into the countrys electric grid.
Here are the energy conversions for Barrick and Newmont:
To put into perspective the change in fuel consumption per ounce of gold produced by these two companies since 2005, here is the following chart:
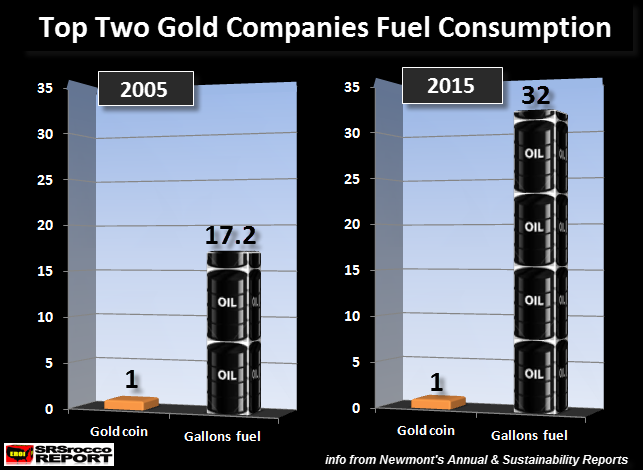
In 2005, Barrick and Newmont burned an average of 17.2 gallons of fuel to produce one gold coin. However, it took the burning of 32 gallons of fuel to produce one gold coin in 2015. Thus, in ten years
these top two mining companies burned an extra 15 gallons of fuel (86% increase) to produce the same ounce of gold that they did in 2005.
The reasons for the increase in fuel consumption at these two mines (as well as the industry as a whole), are falling ore grades and the deepening of the open pit. As ore grades decline, it takes more ore to produce the same gold. Thus, more ore has to be extracted and transported by the massive haul trucks. Furthermore, as the open pit gold mines deepen with age, the haul trucks have to move longer distances (and elevations) to bring the ore to the processing plants.
These mining companies were able to burn 86% more fuel to produce an ounce of gold because the world has brought on more expensive liquid energy supplies. Unfortunately, this will not continue for much longer as the massive amount of debt in the system will likely cause a systemic collapse of the global financial system.
As U.S. and global oil production declines, so will gold production. That being said, world gold production may stay elevated even with peak oil. Why? Because, when the price of the yellow metal heads back up to the $2,000 level (or higher), the mining companies would be able to bring present uneconomic deposits online
thus adding more overall supply.
Investors need to realize the overwhelming cost to produce gold is energy. When I say energy, I mean IN ALL FORMS & IN ALL STAGES. I will be discussing this more in detail in future articles and interviews. However, the raw energy that takes up 20-25% of the total cost to produce gold is only ONE FORM OF ENERGY. Human Labor consumes an even larger percentage of a gold mining companys cost. And we must remember, human labor is a form of ENERGY
. its human energy.
Regardless, the mining companies will finally reach a point where they will not be able to access the liquid energy they need to grow their gold production. Ironically, this will likely come at a time when the global financial system disintegrates, thus pushing the gold price up to much higher levels.
DEFLATION is coming
. just not in the price of gold and silver.
STAY TUNED for the SRSrocco Report Precious Metals Webinar On July 20th
I want all my readers to know about the upcoming SRSrocco Report Precious Metals Webinar on July 20th. I will provide contact information for those who would like to send questions in which we will answer in the second part of the webinar.
Check back for new articles and updates at the SRSrocco Report.
| Digg This Article
-- Published: Sunday, 10 July 2016 | E-Mail | Print | Source: GoldSeek.com


