THE SUBPRIME U.S. ECONOMY: Disintegrating Due To Subprime Auto, Housing, Bond And Energy Debt
-- Published: Friday, 22 July 2016 | Print | Disqus
By Steve St. Angelo, SRSrocco Report
The U.S. financial system continues to disintegrate even though most Americans hardly notice. The system is being gutted from the inside out much the same way a chronic disease weakens a patience even before any symptoms are felt. However, we are already experiencing painful symptoms as U.S. economic indicators continue to weaken.
These are just some of the recent headlines pointing to BIG TROUBLE AHEAD. However, the U.S. financial system is in dire shape due to the SUBPRIMING of the entire economy. Today, anyone can purchase a car for little or nothing down and finance it for 84 months. The U.S. housing market is also in the same predicament.
While the economy and home prices have both rebounded, some people have expressed concern we are headed for a repeat housing bubble. As of January 2016, home prices were rising at a rate twice that of inflation, according to the S&P/Case-Shiller U.S. National Home Price Index.
Whats more, Fannie Mae and Freddie Mac have unveiled programs to allow first-time homebuyers to make a purchase with only 3 percent down. Plus, some lenders are using alternate credit scores, which may make loans available to those who cant get one under conventional credit scoring methods.
So, here we are heading down the same path as we did prior to the 2008 U.S. Investment Banking and Housing collapse. However, this time around its both a Subprime Auto & Housing problem. But, that is just part of the Subprime mess.
In February 2015, the total amount of negative-yielding debt in the world was only $3.6 trillion.
A year later in February 2016 it had nearly doubled to $7 trillion.
Now, just five months later, it has nearly doubled again to $13 trillion, up from $11.7 trillion just over two weeks ago.
Think about that: the total sum of negative-yielding debt in the world has increased in the last sixteen days alone by an amount thats larger than the entire GDP of Russia.
Just like subprime mortgage bonds from ten years ago, these bonds are also toxic securities, since many of are issued by bankrupt governments (like Japan).
Instead of paying subprime home buyers to borrow money, investors are now paying subprime governments.
And just like the build-up to the 2008 subprime crisis, investors are snapping up todays subprime bonds with frightening enthusiasm.
To see total world negative-yielding debt doubling to $13 trillion in just the past six months is a BLINKING RED LIGHT.
So, not only do we have Subprime Auto & Housing we also have to include Subprime Govt Bonds. While U.S. Treasuries and bonds are not yet negative-yielding, I believe it is just a matter of time.
As we can see, the U.S. is now becoming a massive SUBPRIME ECONOMY. Unfortunately, it gets much worse. The factor that most analysts have not yet factored into the subprime disaster is energy.
I would like to remind my readers and new followers that it takes energy to run the Auto, Housing & Bond markets. Yes, it takes the burning of energy to allow the global bond markets to function. Basically, Treasuries and Bonds are nothing more than claims on future economic activity. My sympathy goes out to anyone holding onto 20-30 year bonds until maturity. I highly doubt these bonds will ever make it to maturity.
That being said, lets look at the catastrophe taking place in the U.S. Subprime Energy Industry.
U.S. Shale Oil Companies Saddled With Debt Up To Their Eyeballs
I discussed the big trouble with the U.S. Shale Energy Industry in my recent interview with Dan at Future Money Trends. If you havent yet checked it out, I highly recommend it:
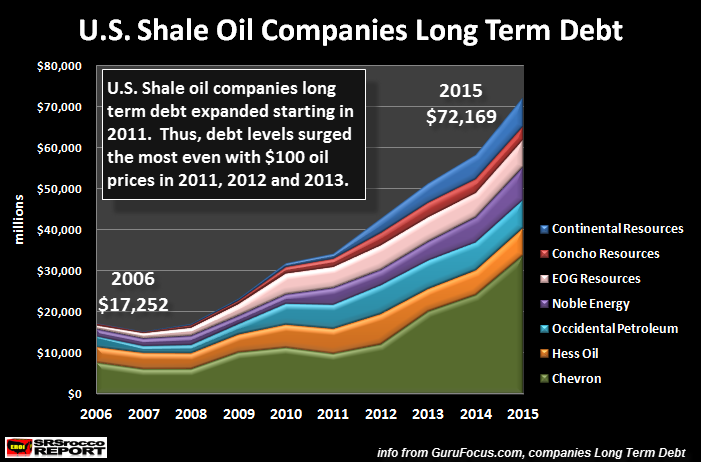
During the interview I spoke about the following chart below. These are some of the top U.S. Shale oil companies. I included Chevron, not because it is a large shale oil producer, but because it is one of the three major oil companies in the United States:
In 2006, these seven U.S. oil companies held $17.2 billion in combined long-term debt. However, by 2015 this ballooned to $72.1 billion. Basically, their debt increased four times in a decade. Now, the interesting thing to understand about this chart is that their long-term debt really started to increase in 2011. Why is this significant?
Because, the price of U.S. oil (West Texas Crude) was nearly $100 for 2011, 2012 and 2013. Which means, the high oil price did nothing to help these companies pay down their debt. Rather, their long-term debt more than doubled in just the past four years.
I hope anyone reading this will realize, SHALE OIL IS SUBPRIME ENERGY that wasnt really economic unless we had zero interest rates and monetary printing. Even though the U.S. Shale Oil Industry brought on a lot of oil in the past decade, they really didnt make any money they just saddled their balance sheets with debt.
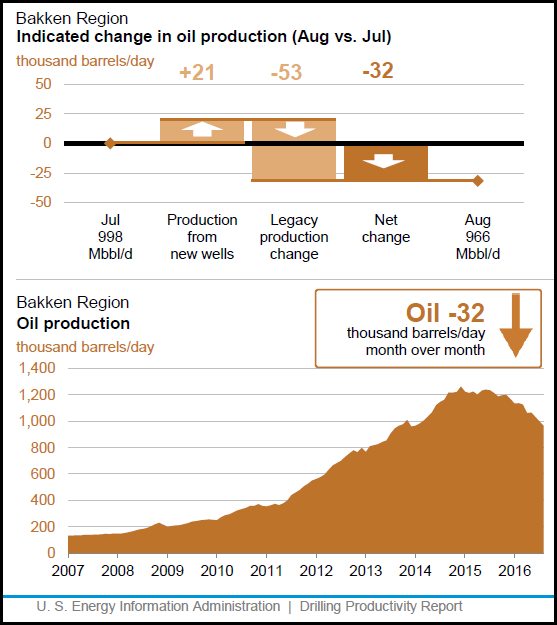
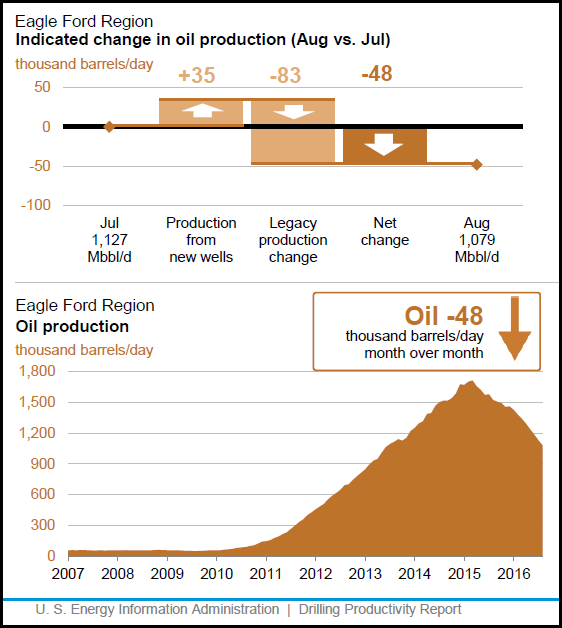
Lets take a look at the most recent data from the top four shale oil fields in the United States. According to the U.S. EIA Drilling Productivity Report released on July 18, the Bakken and Eagle Ford shale oil fields are estimated to suffer large declines in August:
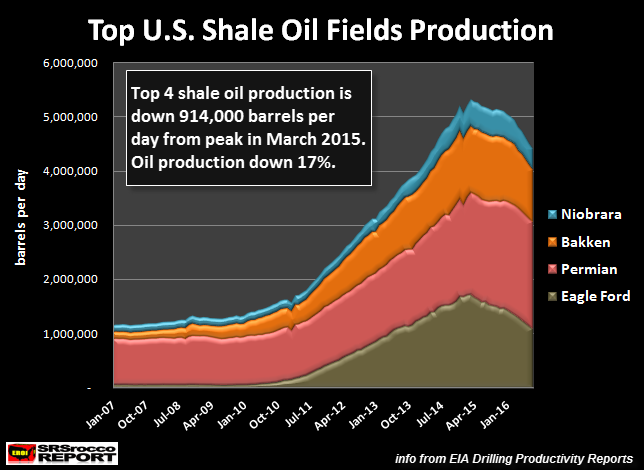
The EIA forecasts that the Bakken and Eagle Ford will lose 80,000 barrels per day in just August. These are BIG NUMBERS. If we look at the actual production figures for the top four shale oil fields, here is the result:
Oil production from the top four shale oil fields has declined 914,000 barrels per day (bd) since the peak in March 2015. This translates to a 17% decline in oil production from these four fields in just 16 months. However, the impact on the U.S. economy is even worse when we look at the figures on a monthly and annual basis.
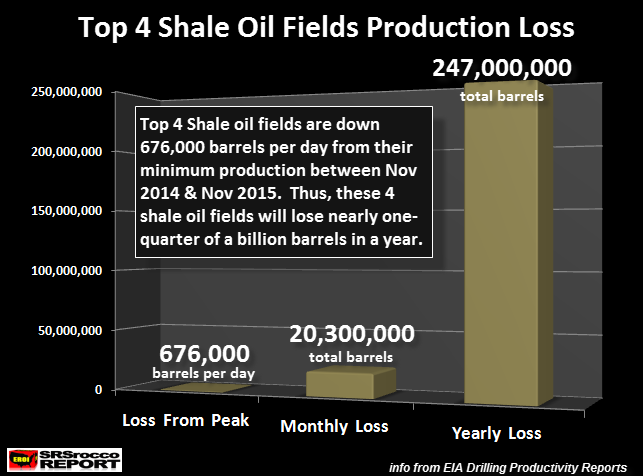
This next chart shows the combined loss of oil production from these top four shale oil fields based upon the minimum production from Nov 2014 to Nov 2015. Let me explain. In Nov 2014, these shale fields produced 5,027,000 bd, peaked in March 2015 at 5,304,000 bd and then fell back to 5,106,000 bd in Nov 2015. So between Nov 2014 & Nov 2015, these fields produced a minimum of 5,067,000 barrels per day.
In August, the Bakken, Eagle Ford, Niobrara & Permian oil fields will be producing approximately 4,390,000 barrels per day. This is a 676,000 barrel per day decline from the minimum production these four fields produced for a year during that Nov 2014-2015 time period.
The reason why I decided to do it this way is to show that these four fields produced at least 5,067,000 barrels per day for an entire year. To show the decline from the high peak is disingenuous because it was only for a brief one month period. This means, these top four fields will lose 20.3 million barrels of oil in a month and a stunning 247 million barrels in a year:
However, it will be much worse than this going forward as U.S. Shale oil production continues to decline. How bad will it be? Well, if these companies received $50 a barrel for oil, it turns out to be a loss of $13.7 billion in a year. But, as I stated, it will be worse as oil production continues to decline.
I published this chart in a previous article, but its important to see again:
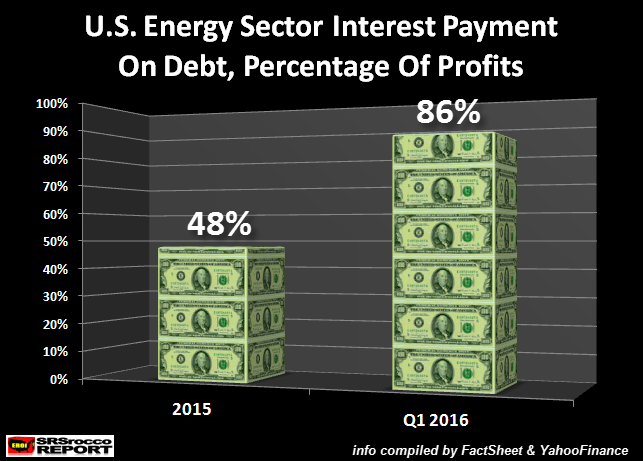
The U.S. Energy Sector is saddled with $370 billion in debt. In 2015, the U.S. Energy Sector paid 48% of their operating profits just to pay the interest on their debt. This ballooned to 86% in Q1 2016 when the oil price fell to $33. If the oil price remains between $40-$50, the U.S. Energy Sector will likely have to fork out 60-70% of its operating income just to service its debt in 2016.
And of course ITS EVEN WORSE THAN THAT LOL. We must remember, for most of 2015, the top shale oil fields were producing 676,000 barrels per day more than they will be this year. Thus, they will have less revenues due to falling oil production.
So, the billion dollar question is this how will the U.S. Energy Sector survive with low oil prices and falling production???
Welcome to SUBPRIME USA.
Unfortunately, the coming collapse of the U.S. economic and financial system will be orders of magnitude greater than what took place in 2008. Why? Because we just had a subprime housing market in 2008, whereas the entire U.S. economy today is SUBPRIME . Subprime Auto, Housing, Bonds & Energy.
Lastly, while some precious metals investors have become a bit frustrated by the low gold and silver prices or the ongoing manipulation of the markets by the Fed and Central Banks, the current system is not sustainable. The doubling of world debt with negative yielding debt in the past six months is a bad sign indeed.
Owning physical gold and silver will provide a lot more options during the next economic and financial collapse than most of the paper assets 99% of the world is invested.
Check back for new articles and updates at the SRSrocco Report.
The content on this site is protected
by U.S. and international copyright laws and is the property of GoldSeek.com
and/or the providers of the content under license. By "content" we mean any
information, mode of expression, or other materials and services found on GoldSeek.com.
This includes editorials, news, our writings, graphics, and any and all other
features found on the site. Please contact
us for any further information.
Live GoldSeek Visitor Map | Disclaimer
The views contained here may not represent the views of GoldSeek.com, Gold Seek LLC, its affiliates or advertisers. GoldSeek.com, Gold Seek LLC makes no representation, warranty or guarantee as to the accuracy
or completeness of the information (including news, editorials, prices, statistics,
analyses and the like) provided through its service. Any copying, reproduction
and/or redistribution of any of the documents, data, content or materials contained
on or within this website, without the express written consent of GoldSeek.com, Gold Seek LLC,
is strictly prohibited. In no event shall GoldSeek.com, Gold Seek LLC or its affiliates be
liable to any person for any decision made or action taken in reliance upon
the information provided herein.