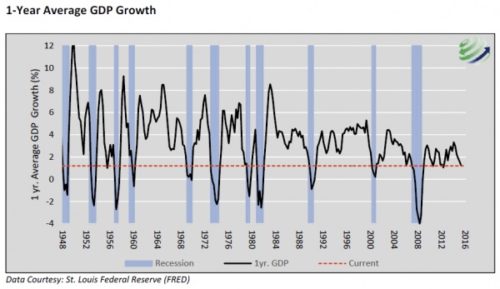
This graph by 720Global shows how spot on my pronouncement of a US 2016 recession is and how precarious the path ahead. In spite of the lack of any official declaration by the US government or its economic priesthood, Ive stated more than once in 2016 that the US is already in recession. Several interesting observations can be made from this graph:
- The red line marks current US GDP (1.2%) as estimated by the US Bureau of Economic Analysis (BEA). At virtually every point in the last seventy years when US GDP hit 1.2%, the US has been solidly in recession (blue areas). In other words, the US was not ABOUT to go in recession at that level of growth, but was IN recession each time
with only three exceptions. Two of those are exceptions that prove the rule (i.e., the very reason these exceptions happened prove how significant the underlying rule or belief is):
- Twice during the years since the Great Recession, GDP touched this low, and we did not go officially into recession, but look at why: In both of those instances the US only averted recession because the Federal Reserve immediately kicked in massive doses of quantitative easing. (The Federal Reserve is not going to do any immediate quantitative wheezing to keep us above the line this time because all of its talk has been about raising interest rates. More wheezing would prove the Fed is unable to raise interest rates (as I said last fall would be the case after made its first raise in December. So, the Fed will only apply QE at this point when it sees for certain that its patient is dying, which will be too late.)
- The graph reminds us of something were all aware of: Based on the average frequency between recessions, the US is due for a recession in 2016 anyway.
- An even more interesting observation to note is the general long-term decline of US economic growth. Seventy years ago, the US emerged from recession with 12% growth in GDP. For the next thirty years, it would emerge with about 8% growth. For the next twenty years after that, the best the US could hope to see was around 4% growth in GDP; and for the past decade, the highest peaks the US can manage in economic growth have been about 3% growth in GDP.
In part, the declining growth rate in GDP could be because it is harder to get as large of a percentage increase as GDP gets larger. (In the sense that it is easier to double your speed at ten miles per hour than it is at fifty miles per hour.)
However, I think it also reflects how, as US national debt has piled up, its ability to achieve growth has significantly diminished because of all the ballast it is carrying. The fact that it has taken enormously greater stimulus to achieve these steeply diminishing returns indicates the severe drag created by this ballast.
One could also blame increasing regulations; but there is one very interesting thing you cannot blame
and that is taxes. We consistently achieved much higher rates of growth back in times when income tax (and especially capital gains tax) was much, much higher (both corporate and individual). So, the growth decline certainly cant be blamed on higher taxes because they arent higher.
It will annoy many Im sure to see that significantly lowering taxes hasnt done anything to boost the US rate of growth. We can dispel the notion for good that we are going to save our economy with anything as simple as tax breaks. Clearly we have a much more significant underlying problem that tax breaks have been unable to overcome, as they have given only temporary boosts and have given much less bang for the buck each time.
One cannot blame free trade for this trend because the worst declines in the growth rate happened long before free trade; but one can also say that free trade certainly hasnt boosted the US rate of growth, just as lowering taxes hasnt.
I think the one thing that is most consistent is the ever expanding chasm of debt that undermines our economy as we attempted to grow without paying for our growth as we went. (Expanding the debt to create stimulus in bad times, but never paying it off in good times. Acting as if debt is forever free.)
Whatever the cause, the US growth rate clearly has become consistently getting weaker for a long time and has now reached a point where economic growth is so elusive that only with extraordinary stimulus do we keep our heads barely above the waterline that is associated with all recessions. While the US did not officially go into recession every time it dipped to its present level of GDP (given the three exceptions, two of which only averted recessions by extreme measures), every recession the US has had in the last seventy years started at or before the point where it dropped to its present level of GDP. Every single one!
The Great Recession rages on as the 2016 US recession unfolds
Recessions, of course, only get officially declared after the fact, never when they first start. By definition, an officially declared recession requires two consecutive quarters of declining GDP. That means recessions can only be officially declared after both quarters have passed and then only after numbers for the second quarter are in. Usually, they dont get declared until the numbers get revised, as all government reporting seems to run optimistic until revised (usually under a subsequent administration).
So, at the earliest, recessions are declared about seven months after they have begun. Often, they are not declared until a year or more after they began. We are practically out of them before we officially know we were in one. (And, if youre Ben Bernanke, you can be standing knee-deep in the middle of one and declare there is none in sight
as far as the eye can see.)
Ive maintained for years that we are still in the Great Recession. The graph shows how the first round of quantitative easing took us out of the belly of the Great Recession and back above the recessionary red line, but also how the US economy immediately dove back to the recessionary redline as that round of QE ended, requiring another shot of QE to keep the economy from going under. The economy relentlessly plunged toward the bottom every time economic stimulus ended. So, without stimulus, the US economy is a zombie that now exists in a perpetual state of recession! It is the walking dead.
Notice how the growth line staggers upward during the last period of QE. Thats because that round was a dosed out in continuing measures of new money (a new shot every month for a couple of years), rather than a single big hit.
Notice how the US maintained a completely steady move down toward the red line again after the last round of continuous quantitative easing (QE3) was terminated in the fall of 2014. I want you to see that because in early 2014 well before QE ended I said exactly that would happen as soon as it did end in the fall of 2014. GDP growth moved steeply downhill ever since this steroid was removed from the economy with NO quarter that was an exception.
As Ive said throughout my years of writing The Great Recession Blog, the economy has only been kept marginally alive by repeated rounds of stimulus upon which it is utterly dependent. This graph shows that better than anything Ive seen.
It has taken repeated doses of the largest money printing in the history of the world AND the lowest interest rates ever known, applied by central banks throughout the world, just to keep the patient artificially alive since the Great Recession sucker-punched the world.
In early 2014, I predicted that, once this massive life support ended, wed find out how dead the patient really is as we sink back into the belly of the Great Recession. This graph shows that we have sunk just as fast every time QE ended and that we are now back at the level of growth that is always associated with recessions; and this time there is no QE to be offered.
That is not to say that, once we go back below the red line, as we are doing, the Fed will not eat its claims of recovery by creating the most massive combination of stimulus ever seen just to keep the patient ever so slightly above the red line of death for a few moments more; but it is to say that the next round of QE will come too late and that no amount will be enough to do the job.
I have said consistently on this blog that 1) there will likely be ONE more desperate round of massive stimulus by the Federal Reserve; 2) it will be applied too late because the Fed needs to prove its recovery has worked so it will be extremely reluctant to apply QE this time; and 3) any amount or kind of stimulus applied will be almost completely ineffective, stirring only a meager bleep of a heartbeat.
Modern economists are the dumbest dinosaurs that ever roamed the earth
Modern economists cannot see a recession coming even when it is about to poke their eyes out.
You cannot beat the Law of Diminishing Returns, but modern economists at the Federal Reserve and in government and on television stopped believing in economic laws long ago. They live in a make-believe, and that is why they create upside-down Wonderland economies.
Thus, a person with no economic background (me) has to school these enfeebled minds in their own field. There has, I believe, in the history of the world never been such a large group of intelligent people who look so consistently dumb in the area of their own expertise and who get so consistently rewarded for looking dumb
as modern economists.
This graph is a photograph of the utter bankruptcy of modern economic belief in a debt-based economy. It is a testimony to economists failed religious faith in central-bank stimulus and their refusal to believe in the ancient, proven Law of Diminishing Return.
The rate at which the benefits of stimulus have diminished over the past decades even while the size of stimulus has exponentially increased shows clearly that the next round (helicopter money that is being talked about all the time now along with negative interest rates) will be the most massive application of life support the world has ever seen and, yet, will result in the patient barely recovering to a comatose state at the edge of the red line. The next does of stimulus may stir a brief heart flutter, but will actually kill the patient. It will drive the zombie economy to a level of death where even artificial life support can no longer make it appear to be alive.
2016, Year of the Epocalypse
And that is why I call this the Year of the Epocalypse the year in which we sink unrecoverably back into the swelling belly of the Great Recession. This is the year in which the greatest rounds of stimulus that will ever be applied only manage to put our heads above the waves long enough to see the next election through. And thats a best-case scenario in light of it being an election year.
Everyone in government (Democrat and Republican
plus our token Socialist) will do anything they can to patch the economy along in order to make sure Donald Trump doesnt get elected. If Trump does get elected so the wizards of false finance give up the battle the day after the election, all hell will break lose on the economy. That will be OK with the high priesthood because they will try to use Trump as a scapegoat, seizing the opportunity to claim their recovery only failed because of the panic that Trumps election caused
if they let him make it that far alive. Worst case scenario, the government and the priesthood in the Eccles Building lose all control before the election happens because even their darkest sorcery might not be enough to keep the zombie economy walking.
You couldnt ask for a more consistent pattern of falling returns from exponentially greater efforts. The graph shows a relentless track into the belly of the Epocalypse round two of the Great Recession
and by far the deeper round. It has a gravity that keeps sucking us in.
The recovery is entirely artificial and unsustainable, and any economist who ever held such a flamboyant disregard for true economics (i.e, who believes in a debt-based economy) has an eggplant for a head. This graph is a testimony to their failure due to the bankruptcy of their beliefs. They are the priesthood of a zombie economy.


