-- Published: Wednesday, 10 August 2016 | Print | Disqus
By Steve St. Angelo, SRSrocco Report
The U.S. and world are heading toward an accelerated breakdown of their economic and financial markets. Unfortunately, the overwhelming majority of analysts fail to understand the root cause of this impending calamity. This is also true for the majority of precious metals analysts.
The reason for this upcoming systemic collapse of the U.S. and Global markets is quite simple when you understand the information and are able to CONNECT THE DOTS. While it has taken me years of research to be able to finally put it all together, new information really put it all into perspective.
Yes… a HUGE LIGHT BULB went off, but unfortunately the realization is much worse than anything I imagined before. I briefly discussed this in my last article, The Coming Global Silver Production Collapse & Skyrocketing Silver Value.
The information discussed in this article makes it abundantly clear that the precious metals will be the GO TO ASSETS in the future. The standard financial practice of investing most of one’s assets in stocks, bonds and real estate will no longer be true. What little investment strategies are left in the future will turn to PROTECTING WEALTH, rather than building wealth. The days of acquiring wealth are coming to and end… and fast.
So, now I will try to lay out all the details in a way that will make this easy to understand. However, I have a word of warning. Those who are able to connect the dots… it’s like taking the RED PILL, you can’t unlearn what you now realize.
The Collapsing EROI Is Destroying Everything In Its Path & Quickly
Americans used to enjoy a much better standard of living when it only took one person in the family to provide the income. This was during the late 1940’s, 1950’s and early 1960’s. However, the situation started to change in the 1970’s.
Not only do both spouses have to earn a living to make it today, health care and college education are becoming unaffordable. I remember back in the 1980’s that most health plans had full coverage with little or no premium. Basically, your health care was free, and all you had to do was pay a small deductible when you went to the doctor. Now, more and more Americans can only afford catastrophic coverage, for an expensive monthly premium with a high deductible.
Many believe this is all due to the corrupt insurance, healthcare and pharmaceutical companies. While they are partly the blame, the majority of the reason is due to the rapidly falling EROI. Furthermore, the falling EROI is making higher degrees of education less affordable to the public.
Before I get into the details here, let me explain the EROI. The EROI stands for Energy Returned On Invested. Basically, its how much profitable energy you get in return from what amount of energy was invested (burned). The EROI has been a guiding principle for humans going back thousands of years when we were hunter gatherers.
Here are some simple EROI for human food production:
Hunter Gatherer = 10/1
Simple Human Farming = 5/1
Human & Animal Farming = 1-2/1
High Tech Modern Food System = 1/10
Data from Thomas Lough/ Energy Efficiencies (EROI) of food procurement strategies/ (page 4)
A typical hunter gatherer only burned 1 calorie of energy to acquire 10 calories of food. You will notice that a hunter gatherer was 100 times more efficient in food production (gathering) than our modern high-tech food system that devours 10 calories of energy to provide 1 calorie of food on the dinner plate.
Our modern food system can waste so much energy growing, harvesting, processing and delivering food because of the high EROI of oil we have enjoyed in the past. Unfortunately, the rapidly falling EROI of U.S. and Global oil will cause serious trouble for food production going forward.
Why the Falling EROI is Causing Havoc To Our Modern Way Of Life
In a recent three-part article by Louis Arnoux, Some Reflections On The Twilight Of The Oil Age, the following chart was posted about the importance of a high EROI for our modern society:
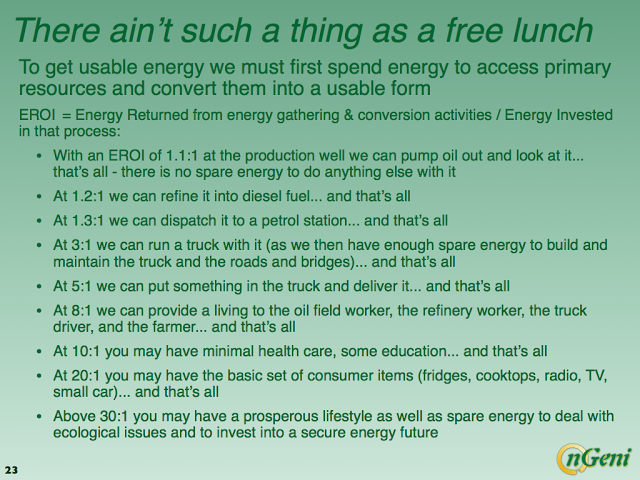
I am going to simply the chart above.
EROI 3/1 = Transportation System: Roads, Bridges & Trucks only.
EROI 10/1 = Transportation System, Agriculture, minimal Health Care & Education.
EROI 20/1 = Transportation System, Agriculture, Basic Living, Health Care & Education along with basic consumer goods
EROI 30/1 = Transportation System, Agriculture, Prosperous Living, Heath Care & Education with advanced consumer goods.
The important thing to understand from these EROI guidelines, is that a minimum value for a modern society is 20/1. For citizens of an advanced society to enjoy a prosperous living, the EROI of energy needs to be closer to the 30/1 ratio.
Well, if we look at the chart below, the U.S. oil and gas industry EROI fell below 30/1 46 years ago (after 1970):
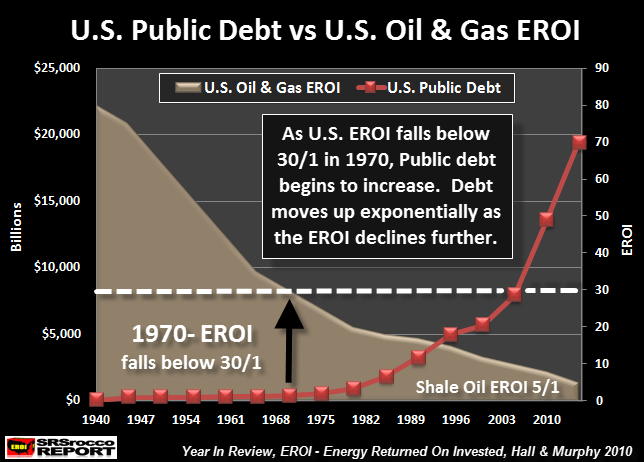
You will notice two important trends in the chart above. When the U.S. EROI was higher than 30/1 prior to 1970, U.S. public debt did not increase all the much. However, this changed after 1970 as the EROI continued to decline, public debt increased in an exponential fashion.
We must remember, to sustain a transportation system with agriculture and minimal health care and education, we must have at least an EROI of 10/1. Well, with U.S. shale oil production that comes in at an EROI of 5/1 (or less), we can no longer afford the basic necessities. Of course, we still have other higher EROI forms of oil production as well as higher imported EROI oil from foreign countries, but these are rapidly falling as well.
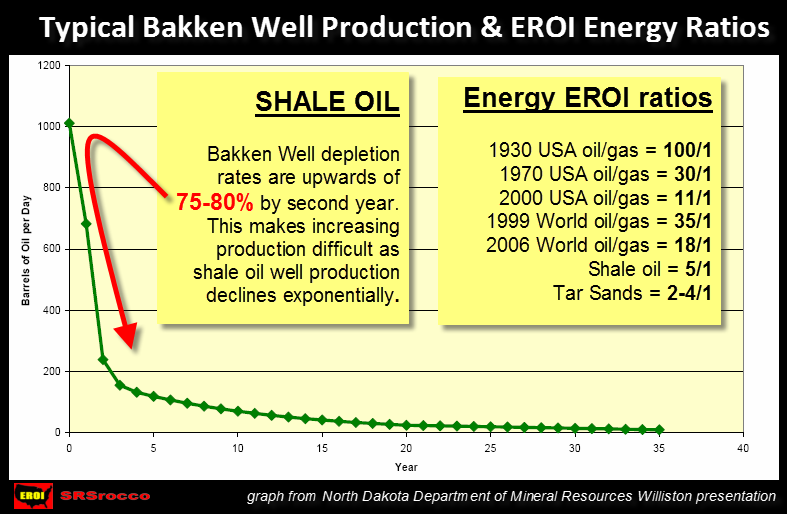
Here is another chart showing the rapidly falling EROI from Louis Arnoux’s article linked above:
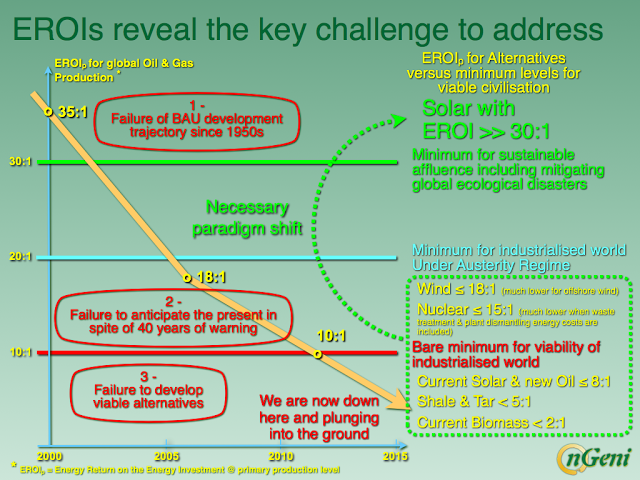
As we can see from the chart above, the Global Energy EROI continues to fall below the 10/1 level which only offers a minimum viability for our industrialized world. Thus, the more low quality tar sands, shale oil and other unconventional oil supplies we bring into the mix, the less the overall EROI.
This is the reason why there is so much debt in the world today. We are trying to enjoy the same standard of living as we had a few decades ago, but we can’t as the EROI is falling below our basic minimum requirements. So to counter the falling EROI, we add more debt to bring on expensive energy that for a short period allows us to continue BAU – Business As Usual.
NOTE: The Solar EROI of 30/1 in the chart above, is one figure that does not represent the true value of solar. This is where we have to distinguish between good and bad analysis. I will get into more detail on this in future articles.
Unfortunately, the massive amount of debt in the system is becoming unsustainable. This is why we are seeing many countries going to zero or negative interest rates. Furthermore, the amount of global bonds with negative rates are increasing at a stunning pace. In just the past six months, global bonds with negative rates have doubled to $13.5 trillion.
Why are we seeing such a rapid and volatile change in the markets recently? It’s due to rapidly falling EROI and oil price.
The Coming Oil Pearl Harbor Will Destroy The World’s Oil Industry
Very few people understand just how quickly the U.S. and world oil industries are disintegrating. This chart is from Louis Arnoux’s Part 2 of the article linked above:
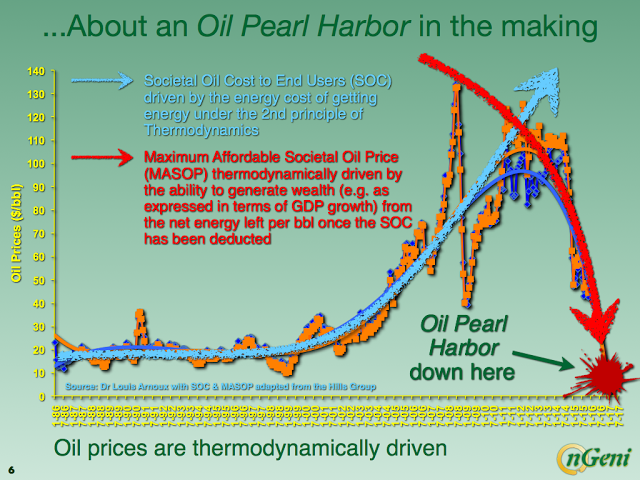
Louis along with the work of the oil engineers at the Hill’s Group, suggest that oil prices will not rise going forward, rather they will continue to fall. This goes against the economic principle of Supply & Demand, but according to their studies on how thermodynamics impacts the oil price, they forecast a continued lower oil price.
According to Louis Arnoux:
In brief, the GIW (Global Industrialized World) has been living on ever growing total debt since around the time net energy from oil per head peaked in the early 1970s. The 2007-08 crisis was a warning shot. Since 2012, we have entered the last stage of this sad saga – when the OI began to use more energy (one should talk in fact of exergy) within its own productions chains than what it delivers to the GIW. From this point onwards retrieving the present financial fiat system is no longer doable.
This 2012 point marked a radical shift in price drivers.[1] Figure 4 (shown above) combines the analyses of TGH (The Hills Group) and mine. In late 2014 I saw the beginning of the oil price crash as a signal of a radar screen. Being well aware that EROIs for oil and gas combined had already passed below the minimum threshold of 10:1, I understood that this crash was different from previous ones: prices were on their way right down to the floor. I then realised what TGH had anticipated this trend months earlier, that their analysis was robust and was being corroborated by the market there and then.
Their forecast of continued lower oil prices is due to a “Thermodynamic Collapse” of net energy. The Hill’s Group put together this chart forecasting the oil price to reach $11.76 by 2020:
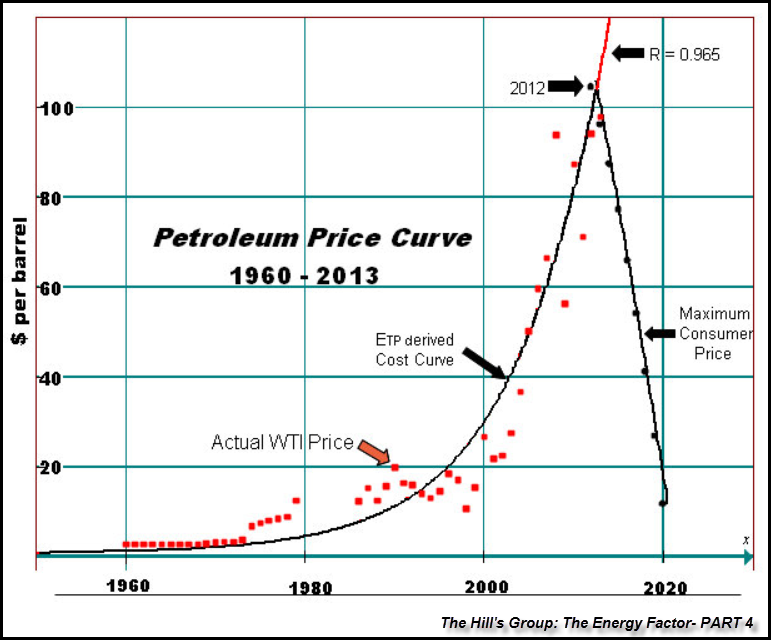
The Hill’s Group is an association of consulting oil engineers and professional project managers headed by B. W. Hill. If you want to read their technical explanation as to how they arrive at this price forecast, you can click on the following link: The Energy Factor- Part 4.
This is by far the most important paragraph from that analysis:
The Maximum Consumer Price curve is curtailed at 2020 at $11.76/ barrel. At this point petroleum will no longer be acting as a significant energy source for the economy. Its only function will be as an energy carrier for other sources. Production will continue as long as producers can realize the lifting costs at existing fields. E&D expenditures, and field maintenance costs will have been curtailed. All production from that point forward will be from legacy fields only. The economic impact that will result from the energy lost to the general economy is beyond the scope of this report.
Basically, what the Hill’s Group is saying here, things will become pretty ugly by 2020. Thus, this will negatively impact the United States much worse than either the Main Stream or Alternative precious metals analysts realize. Here are two more quotes from the Hill’s Group posted from my previous article:
1) Within 10 years the Oil Industry as we know it will have disintegrated
2) B.W. Hill considers that within 10 years the number of petrol stations in the US will have shrunk by 75%…
I would imagine very few, if any, Americans understand the dire consequences presented by the analysis here. If we thought the Great Depression during the 1930’s was bad… this would be several orders of magnitude worse. Why? Because a lot of people living in the cities who couldn’t find a job during the Great Depression could move to the country and live with family. At least they could have a place to stay and have something to eat. This is no longer possible… only a small fraction of the population could do this today.
Furthermore, the United States was able to pull itself out of the Great Depression because it only had just begun to tap into its massive cheap oil reserves. Oil production in the United States continued to increase for the next four decades. This is no longer possible, as U.S. oil production is likely to collapse over the next decade.
That being said, are we to assume that Louis Arnoux and the Hill’s Group are correct in their analysis and forecasts? Of course, it would be prudent to be skeptical and realize that there is a possibility that their analysis may be wrong, or off on the timing.
However, if we look around at the markets today, things are changing at a RAPID & VOLATILE PACE. As I mentioned, to see global bonds with negative rates double to $13 trillion in the past six months is a WARNING SIGN that situation is rapidly getting out of hand.
In addition, we see more and more evidence of how unsustainable the financial system has become.
- Increasing number of underfunded Pension Plans
- Massive Student Debt with no possibility of being repaid
- Record amount of Large companies borrowing money a low-interest rates to buy back stock and pay dividends
- Increasing number of Health Providers exiting the Obama Healthcare system leaving millions without basic catastrophic insurance
- High paying manufacturing jobs lost only to be replaced by inferior waitress and retail service jobs.
The list can go on and on. People need to realize that even though the politicians in the U.S. Govt and Corporations are committing fraud by lining their pockets, the overwhelming reason for the collapse of the American Standard of Living is due to the falling EROI.
It’s that simple.
The Rapidly Falling EROI and Oil Price Is Gutting The U.S. Oil Industry
This next chart says it all. The top three U.S. oil companies, ExxonMobil, Chevron and ConocoPhillips cleared a hefty $16.3 billion after CAPEX and dividends were paid during the first half of 2011:
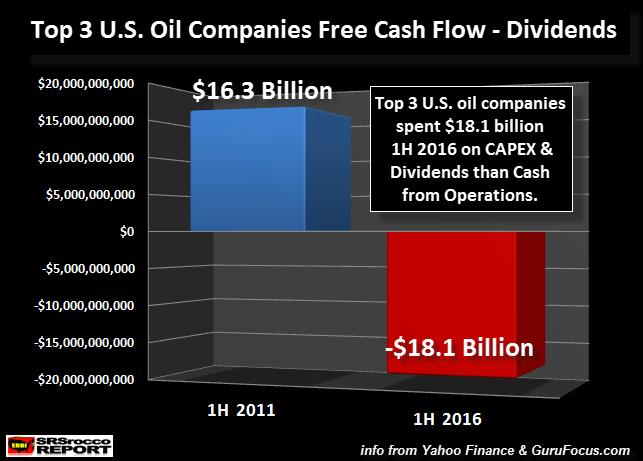
I arrived at that figure by taking these three companies Cash from Operations and then deducting Capital Expenditures (CAPEX) and Dividends. Now, if we look at the same figure five years later, these three U.S. oil companies are in the HOLE for $18.1 billion. What a change in five years… aye?
Watch for these oil companies to start cutting their dividends in a big way. Matter-a-fact, ConocoPhillips already cut their dividend by a third from $0.74 a share down to a lousy $0.25.
Furthermore, the total U.S. Energy Sector now has a whopping $370 billion worth of debt. I am being a broken record here, but let’s take a look at this chart which shows their ballooning INTEREST ON DEBT:
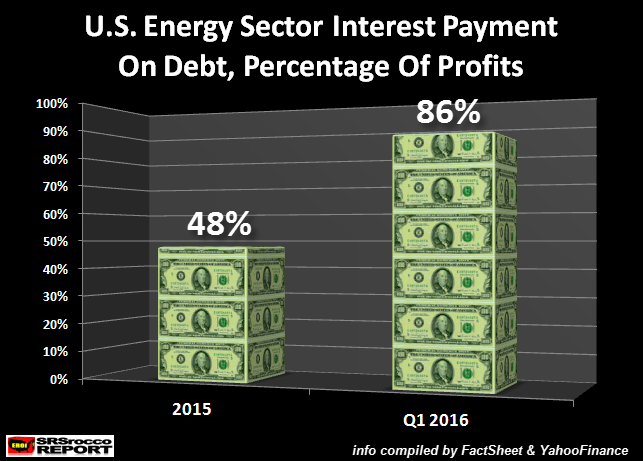
In the first quarter of 2016, the U.S. Energy Sector paid 86% of their operating profits just to pay the interest on their debt. If oil prices continue to remain lower (or even lower), this won’t be sustainable for long.
Here is a chart from YahooFinance showing the U.S. Energy Sector interest on debt. As we can see in 2016, the chart line shoots up towards the heavens as the U.S. Energy Sector paid 86% of their operating income just to service the interest on the debt:
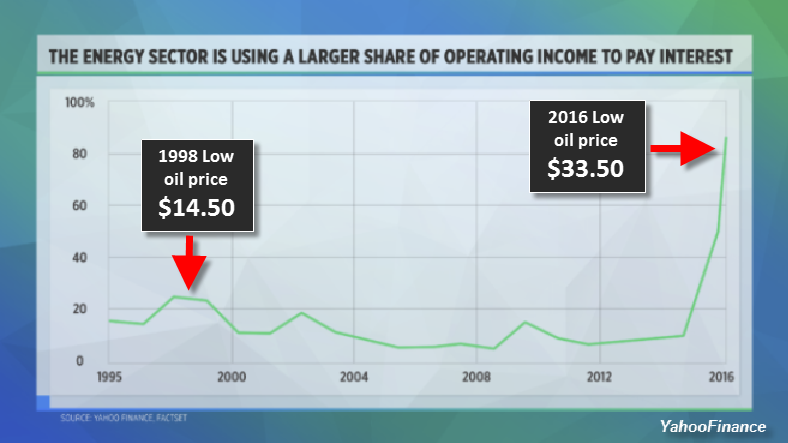
What it so important to understand about this chart is the difference between 1998 and Q1 2016. In 1998, the price of oil had fallen to a low of $14.50. However, the U.S. Energy Sector interest on debt only jumped to 25% of their operating income. In the first quarter of 2016, the price of oil was more than double at $33.5o a barrel, but the U.S. Energy Sector’s interest on their debt surged to 86% of their operating income.
Why the big surge in interest payments on debt with a doubling of the oil price since 1998??? That’s correct, it’s due to THE RAPIDLY FALLING EROI.
Now, if the Hill’s Group is correct in their forecast that they see a “Thermodynamic Collapse” of oil prices to $11.76 by 2020, what the hell will this do to the U.S. Energy Sector??
Correct… IT WILL TOTALLY GUT IT.
Which is why, they made this quote in their report:
Within 10 years the Oil Industry as we know it will have disintegrated
Unfortunately, this information will reach the masses after it’s too late. Moreover, the majority of precious metals investors will likely remain in the dark because they continue to wear HORSE BLINDERS. Unless an article is about the U.S. Economy, debt, manipulation or gold and silver, precious metals investors have no desire to read about energy.
How Will The Rapidly Collapsing EROI Impact The U.S. & Global Markets??
The important thing to understand about this information is that the situation will likely unfold in a way that is extremely hard to predict. However, we can make some common sense assumptions:
- The Standard Investing Practice of putting 95-99% of one’s wealth in Stocks, Bonds & Real Estate will be DEAD FOREVER.
- Entire sections of cities and suburbs will experience a 75%+ decline in economic activity. This will destroy the value of most forms of Real Estate.
- No longer will investors be concerned about earning a YIELD or GROWING their wealth. Instead, investors will protecting wealth as best they can.
- Big Investors such as Warren Buffet will watch as their wealth evaporate, never to return.
- Whole Service Industries & Employment Careers will disintegrate. Watch as Restaurants and Retail stores close doors by the thousands forever.
- The Highly Complex Supply Chain System that delivers goods will breakdown considerably. Trade will move to more regional or local systems.
There are so many more things that could be added to that list, but you all get the point here. Things will start to fall apart more rapidly over the next few years.
Physical Precious Metals Will Offer Much Better Options In The Future Than Most Assets Today
The reason physical gold and silver will offer much better options for the individual going forward is due to the STORE OF WEALTH characteristic of the precious metals. As I have stated in several articles and interviews, Stocks, Bonds & Real Estate are CLAIMS OF FUTURE ECONOMIC ACTIVITY. They are not stores of wealth like GOLD & SILVER.
While it’s true that Real Estate has been viewed as a store of wealth in the past, this was only due to the increasing cheap supply of energy, especially oil. A home, warehouse or commercial building only has value if it there is economic activity to support its use.
As the EROI continues to fall, along with oil production, economic activity will evaporate making it impossible for the owners to pay their mortgage or rent for these buildings. As economic plummets further, the whole system disintegrates. And along with it, the value of most real estate.
As the world begins to wake up the ramifications of the rapidly falling EROI, investors will move into gold and silver to protect wealth. Only 1% of the world’s investors own precious metals. This will be like musical chairs. However, there will only be 2 charts with 100 people.
Gold and silver will act as two of the very few LIQUID ASSETS in the future that can be used for trade or to purchase larger items such as businesses or real estate. Bonds will no longer work on a large-scale as they need a growing energy supply to function and to provide a yield.
Where do you think Bond yields came from? That’s correct… GROWING ENERGY SUPPLIES. With falling energy supplies, Bonds just don’t work all that well.
The Majority Of Analysis Will Become Totally Meaningless In The Future
We will continue to see analysts putting out forecasts based on information and data that is totally meaningless going forward. Unless an analyst understands the energy information presented in this article, all forecasts will be totally worthless.
For example, Kevin Weiner of Monetary Metals puts out analysis showing the supposed abundance or tightness of the gold and silver market due to the “Basis & Cobasis”, as well as other factors. He recently wrote an article stating that the price of silver was over-inflated by $3 due to the basis and relative abundance of the metal.
This actually maybe true (IN THE SHORT-TERM) as many investors wanting to pocket profits have sold back into the secondary market silver they purchased at much lower prices. Furthermore, economic activity is heading south, which means lower consumption of silver for industrial purposes. Lastly, India who was making record imports of silver last year, has seen a huge drop in the silver imports the first five months of 2016.
This could translate to more silver being abundant currently. HOWEVER, most humans do not live for weeks, months or a few years. We live on average for 7-8 decades. I have never stated that owning silver is for the SHORT TERM.
That being said, the rapidly failing EROI will turn the U.S. and World on its knees within the decade…. if we agree with the analysis by the Hill’s Group. Folks, the 2008 collapse of the U.S. Investment Banking and Housing Industry was eight years ago. While it seems like it was yesterday, eight years have come and gone in a blink of an eye.
The Fed and Central Banks have pushed in a massive amount of liquidity and along with zero interest rates have kept the falling EROI at bay. Unfortunately, the FORCES OF GRAVITY will finally overwhelm the system as Central Bankers can’t create cheap oil out of thin air.
I will be altering my analysis going forward as certain topics aren’t as important anymore. We need to look at how this ENERGY DYNAMIC is changing and how it is impacting the U.S. and Global Markets going forward.
Lastly, some readers will be highly skeptical of the information presented in this article. This is a good thing. However, those who believe their are alternatives such as Free Energy Technology, Solar, Wind or etc, will be our SILVER ENERGY BULLET… they won’t. I will discusses this in detail in future articles.
Check back for new articles and updates at the SRSrocco Report.
| Digg This Article
-- Published: Wednesday, 10 August 2016 | E-Mail | Print | Source: GoldSeek.com

