-- Published: Monday, 5 September 2016 | Print | Disqus
By Rambus
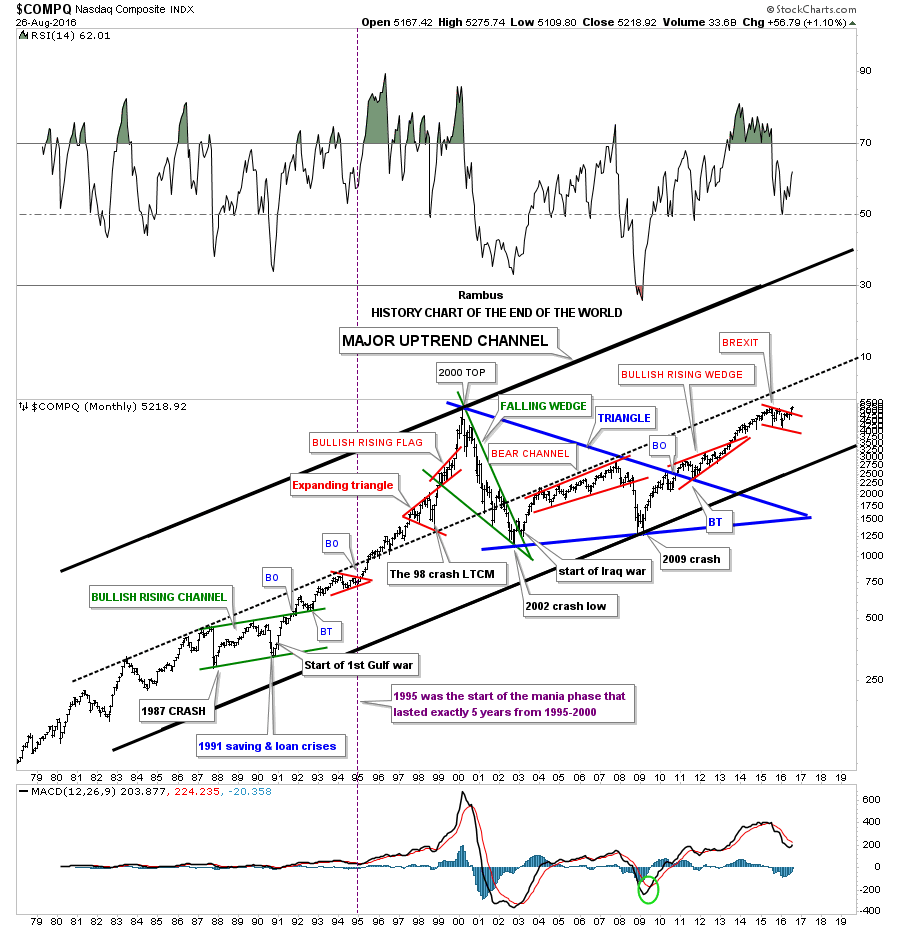
Tonight I would like to show you a long term 40 year monthly chart for the $COMPQ which I call the history chart. Some of you were not even born when some of these significance events happened. At the time they seemed significant enough that most thought the end of the world as we knew it was near. Some of the older members will remember some of these events like they just happened yesterday.
I was personally involved in the stock market during each one of these times, and I can assure you it did feel like the world was coming to an end. When one observes some of these stock market events from a distance they hardly matter in the big picture. Perspective is everything.
Take the 1987 crash for instance. The $INDU was down over 500 points in a single day, but in 1987 that was over a 20% drop.The world didnt come to an end and the markets began to rally off that historic low for several years. Then in 1991 there was the savings and loan crisis, and the market crashed again on the magnitude of the 1987 crash but this time it took a little longer to complete the move down. Also what made the 1991 low so dramatic, besides the saving and loans crises, was the start of the first Gulf war.
I still remember most of the analyst were taking about what could happen to the stock market if the war didnt go well. Crash was the most widely used term back then as no one really knew what would happen as the US was going up against the 5th largest army in the world. After the first night of bombing, it was very clear the next day that the Iraqi army was no match for the US. That was the first time I heard the word smart bomb. As you can see on the chart below the 1987 crash low, and the 1991 low, marked the two lower reversal points in the green bullish rising channel. That green bullish rising channel or flag really was the beginning of one of the biggest bull markets in history for the $COMPQ tech stocks.
How many remember the LTCM, Long Term Capital Management debacle which occurred in 1998? Its only a blimp on this chart, but at the time the word crash was being thrown around as no one knew what would happen. What happened was the continuation of the parabolic run 1995 to the bull market high in 2000.
In March of 2000 the great bull market was over and one of the strongest bear markets for the $COMPQ began. Many tech stocks that were bid up to astronomical levels during the mania phase went bankrupt . The bull market in the $COMPQ ended in 2000 at 5200 and just over two years or so later it crashed all the way down to 1100 before the bear market ended. It didnt help that 9 11 2001 happened in the middle of this crash however that bear market low was also accompanied by the second Iraqi war.That massive bear market, which seemed like the end of the world back then, was actually the beginning of the ten year blue triangle consolidation pattern.
The last reversal point in the ten year blue triangle consolidation pattern was another end of the word event that most investors still havent gotten over yet, which was the 2009 housing bubble crash low. Only the great depression compared to it. That 10 year blue triangle consolidation completed in late 2010 with a nice clean breakout and backtest. That was over seven years ago and the markets havent looked back.
The last consolidation pattern on this chart is the red bull flag which I labeled as the BREXIT pattern. This little shakeout was very mild compared to some from the past. Maybe this little red bull flag is going to finally be the pattern that is going to end the world as we know it, but from a Chartology perspective it looks just like another consolidation pattern in the ongoing major bull market uptrend channel.
Maybe Im being to optimistic but I dont see the end of the world coming anytime soon, but just the opposite. I believe were entering into a new period of human ingenuity where technology is going to change the way we live from biotechnology, green energy, robotics, nano technology, artificial intelligence, super computers that will make todays computers look like slide rulers from the past, space travel and exploration, and a host of other things that the best science fiction writers havent even thought of yet.
This is all possible because of the bull market that started in 1982, which in hindsight was the birth of the information age. Many tech stocks during that bull market went up multiple times of their initial public offerings and had many splits. If only some of our precious metals stocks, over the course of the now 16 year secular bull market had moved even a fraction of what some of the tech stocks did back then, it would be an amazing sight to behold.
One never knows when a black swan event may strike that turns our civilization into a Mad Max society. Maybe tomorrow or in 5 years, 20 years or maybe never. My point is Im not going to live my life waiting for a Mad Max event that may or may not happen. There are enough people out there that will keep a close eye on it if does happen. Im more interested in what the future holds and how society and the economy progresses moving forward.
Im not painting a world without problems as that would be foolish. Since the beginning of time human society has moved two steps forward and one step back always gaining a little ground each time to get to where we are today. I realize that many members are fearful that the world monetary system is going to implode any day now but we have been hearing a variation on this theme from the doom and gloomers for as long as I have been alive. I grew up in the Vietnam era. Now if that didnt feel like the end of the world I dont know what does. And before that my early childhood was during the depths of the cold war (think backyard bomb shelters). These times make the present seem like a walk in the park. Regardless of what many of the naysayers may think on how bad everything is today, I cant think of a better time to be alive than the present. I see a future that will astound us in what the human species will achieve. Good or bad changes will come whether we like it or not.
Im hopeful society will benefit from the changes that are going to take place, just as we have benefited from all the previous changes that happened before us. To leave this world just a tad better than when we entered it would be a great accomplishment. For me personally the future looks bright and full of wonder on what will be achieved by the human race. You may call me naive, ignorant or whatever else you want, but Im going to embrace the future with eyes wide open. All the best
Rambus
https://rambus1.com/
| Digg This Article
-- Published: Monday, 5 September 2016 | E-Mail | Print | Source: GoldSeek.com


