-- Published: Wednesday, 7 September 2016 | Print | Disqus
By Steve St. Angelo, SRSrocco Report
The U.S. financial system is in serious trouble and this one chart confirms it. Investors who understand the negative consequences of this chart would be buying physical gold and silver hand over fist. Unfortunately, Americans have been put to sleep by the Mainstream media as they continue to report that “business as usual forever and everything will be okay.”
However, the opposite is the case as the U.S. economy and the financial system continue to disintegrate under the forces of massive debt, zero interest rates and a collapsing energy industry. This is not a situation that will continue for many years or decades. This will likely collapse much sooner than most Americans realize.
Why? Because of the evidence shown in the chart below:
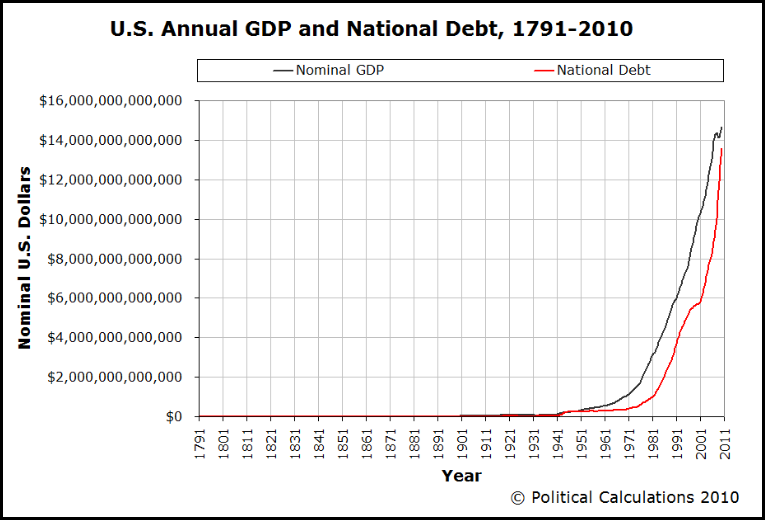
This chart taken from the Political Calculations blog, reveals the exponential increase in U.S. debt as well as GDP – Gross Domestic Product. Most individuals have seen charts of U.S. debt going back decades or even to the 1930’s. However, this chart goes back all the way until 1791.
You will notice as the debt increased at an exponential fashion, so did U.S GDP. Which means our GDP growth is really fictitious or based on the leveraging of debt. The chart above represented data up until 2010. I manually added the U.S. debt and GDP trend lines to the chart below to show the present situation:
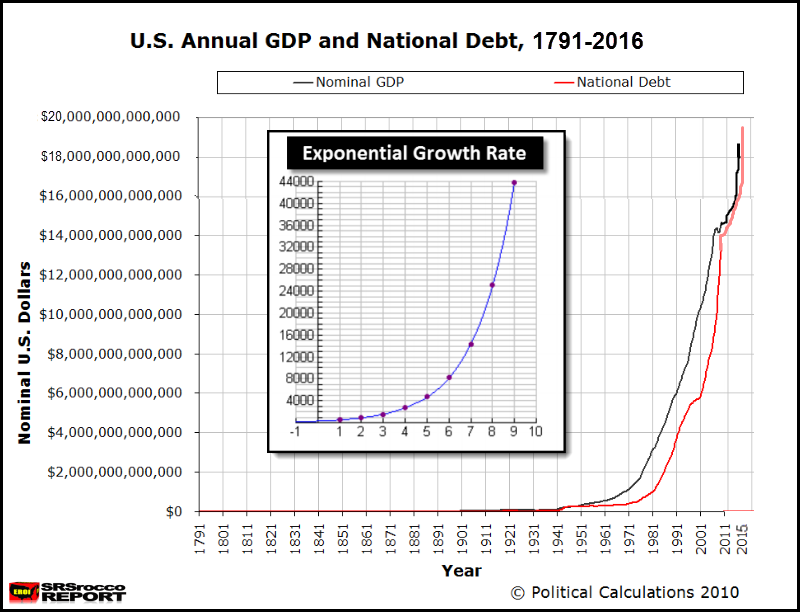
According to the official figures from the Federal Reserve (GDP) and Treasurydirect.gov (debt), the U.S. GDP hit $18.4 trillion Q2 2016 while total debt is now $19.5 trillion. The interesting thing to understand about the chart above is the “Exponential Growth Rate” insert chart. I originally thought the U.S. debt was heading up in an exponential fashion… but didn’t think it was that quite severe.
However, if we look at the Exponential Growth rate chart, we can clearly see that the rising debt and GDP trend lines are heading higher FASTER than an exponential trend. This is very bad news for Americans rich and poor.
Let me briefly explain what an exponential trend is. It is the doubling of a figure every time period. For example, the Rule of 70 states that $100 at an annual interest of 7% will double in ten years to $200. It will continue to double every 10 years ($400, $800, $1,600, $3,200, $6,400 so on and so forth).
U.S. Public Debt Is Skyrocketing Faster Than The Exponential Growth Rate
I decided to take the doubling of U.S. debt (every 10 years) starting in 1971, which was $398 billion, and compare it to the actual figures:
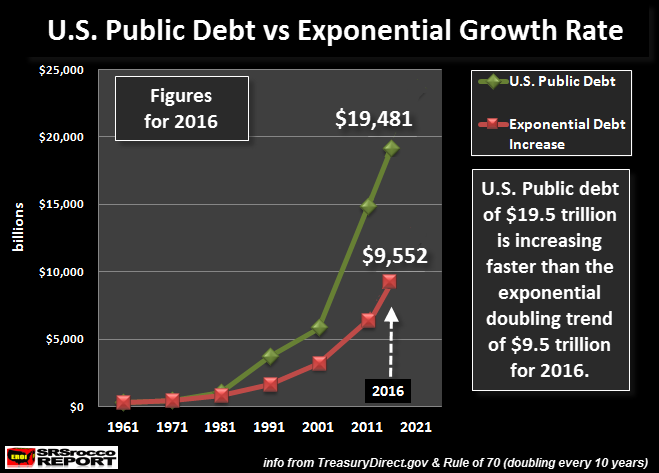
If we take the $398 billion in U.S. debt in 1971 and doubled it every 10 years, this would be the result:
1971 = $398 billion
1981 = $796 billion
1991 = $1,592 billion
2001 = $3,184 billion
2011 = $6,368 billion
2016 = $9,552 billion (half the time period)
2021 = $12,736 billion
Because we have only gone half way through the ten-year time period for 2016, the exponential debt increase was only $9,552 billion ($9.5 trillion). However, U.S. total debt has ballooned to $19.5 trillion. The U.S. debt has increased $10 trillion faster than the doubling exponential function. This is off that charts.
Furthermore, here is the same chart including the estimated U.S. public debt for 2021:
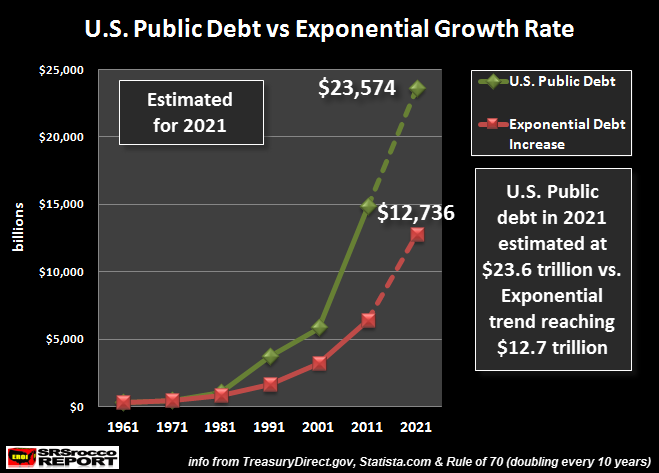
According to figures from statista.com, they estimate total U.S. debt will reach $23,574 billion by 2021. Now, let’s compare that to the next doubling of debt to reach $12,736 billion in 2021. Again, the exponential doubling trend is still $10+ trillion lower than the estimated debt for the United States in 2021.
I highly doubt we make it that far before the U.S. economic and financial system implode. When I hear government spokesmen or analysts from Wall Street talking about increasing debt levels out to 2025-2030, I believe they are completely insane. Again, there is no way we make it anywhere close to 2025 before the system crashes.
The Falling EROI Is To Blame For The Skyrocketing Debt
As I mentioned in my article below, the falling EROI – Energy Returned On Investment is the ROOT CAUSE of the massive increase in U.S. public debt (click on image to read article):
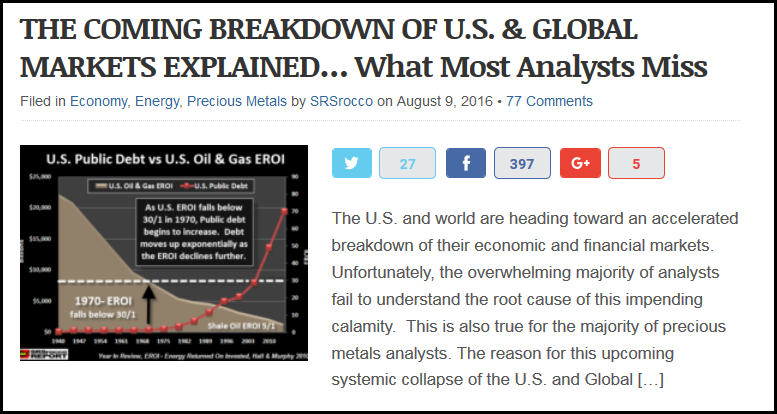
In that article, I posted this graph:
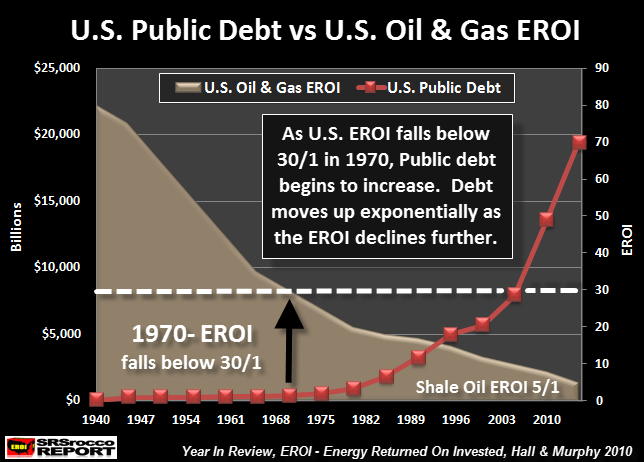
You will notice that the U.S. public debt didn’t really start to increase until after 1970’s… the time period when U.S. oil and gas EROI fell below 30/1. Which means prior to 1971, the U.S. oil and gas industry was providing 30+ barrels of oil to the market for each barrel of oil (energy equivalent) that it burned in the process.
As the U.S. energy EROI continued to fall to the 5/1 of shale oil today, the debt exploded. For those folks who still believe that PEAK OIL is a grand conspiracy by the wealthy and large oil companies, you need to go back to grade school math and learn why a 5/1 EROI of shale today versus 100/1 EROI of conventional oil production in 1930 PROVES that peak oil is a CERTAINTY.
However, if you would rather continue to believe in lousy conspiracy gossip, just wait around for five more years and I would imagine all doubts of PEAK OIL will be erased.
The Value Of Gold & Silver Will Explode As U.S. Public Debt Implodes
The reason investors need to be holding onto LOTS of physical gold and silver is due to the coming implosion of U.S. public debt. While many analysts and individuals think it would be prudent for the system to have a Debt Jubilee or to allow the U.S. Banking Industry to go under, this would be a fatal blow to the U.S. Empire.
There is this naive assumption by supposedly intelligent people who a Debt Jubilee (forgiving or writing off all debts) would allow us to start with a clean slate which would allow us to rebuild our economy and make the United States great again. Unfortunately, this will NEVER happen.
Why? Because we don’t have the HIGH EROI oil to allow us to do so. The massive debt we added to the system over the past 45+ years allowed expensive LOW EROI oil supplies to be brought into the market. However, this is no longer sustainable as our massive amount debt is becoming unmanageable.
I believe the market is finally understanding the ramifications of this as the precious metals prices rally against the tide of high commercial short positions:

The market is beginning to realize that the massive increase in U.S. debt (faster than the exponential function) is no longer sustainable. Even though the commercial short positions have fallen from their record highs, to see the silver price rally back above $20 puts serious pressure on commercials (bullion banks such as JP Morgan):
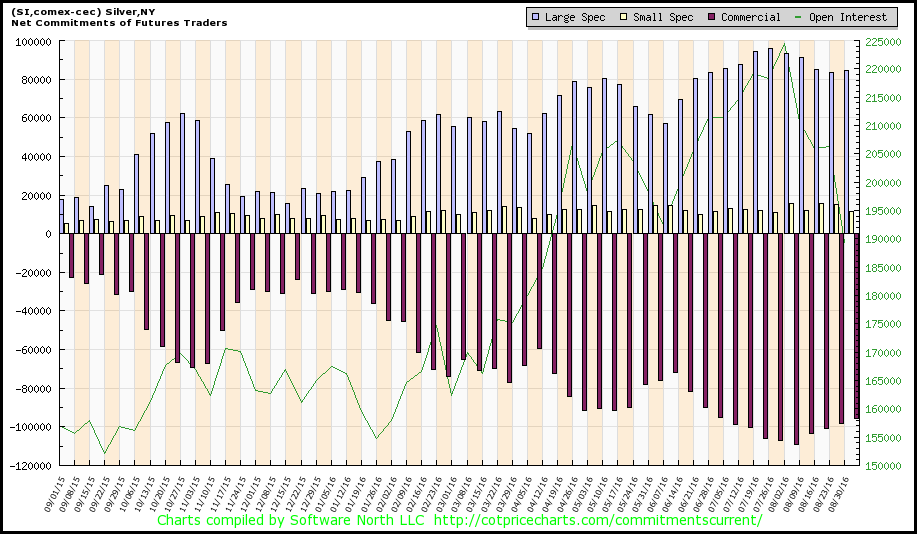
The red bars heading down represent the commercials net silver short positions in the chart above. As we can see, they have only decreased by only a small amount since the record peak a month ago. It is surprising to see the silver price move up my higher against the commercial shorts who normally control the market.
Regardless, investors need to own a good percentage of their wealth in physical gold and silver to protect themselves when the market finally crashes. When the market finally craters, it will take down the value of most paper assets and real estate with it. Because there is very little in the way of physical gold and silver to go around, their values will skyrocket as investors seek to PROTECT WEALTH.
Check back for new articles and updates at the SRSrocco Report.
| Digg This Article
-- Published: Wednesday, 7 September 2016 | E-Mail | Print | Source: GoldSeek.com

