

A few weeks ago, I shared with you what I brought home from my trip to Toronto, Vancouver and New York City, where I had met with gold fund analysts. The current gold bull run began in January, but as I told you, the general retail investors werent buying then. The only people buying that early were quants and huge hedge funds. The question, then, was: What factors or models were the quants using to uncover golds meteoric rise this year?
One of the factors they were looking at, I learned, was low SG&A-to-revenue. SG&A stands for selling, general and administrative expenses and refers to the daily operational costs of running a company that are not related to making a product. It includes everything from shipping fees to salaries to utilities. SG&A-to-revenue is an unusual factor, not typically used among analysts and fund managers, so we were curious to apply it.
Using this information, we looked just at the first quarter to find the mining companies that spent the least amount of money on these daily operations relative to revenue. Mining companies, after all, have had trouble with expense discipline.
What we discovered was nothing short of astonishing. All combined, the top 10 gold companies for the quarterled by South Africa-based Harmony Goldreturned a spectacular 88 percent. Thats almost double what the Market Vectors Gold Miners ETF (GDX) returned over the same period (45.5 percent).

As early as January, the drivers were in place to fuel golds best first half of the year since 1974. The yellow metal is now in position to have its best year overall since 2010, when it rose 29.5 percent.
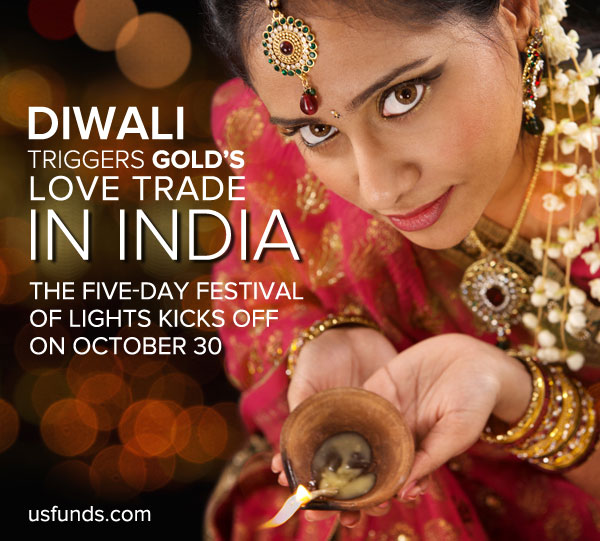
Upcoming Festivals Could Activate Love Trade
I talk a lot about the differences between golds Fear Trade and Love Trade. Loyal readers know that the Fear Trade is associated with negative real interest rates and excessive money supply, which triggers an imbalance of monetary and fiscal policies and macroeconomic uncertainty. Historically, investors in the U.S., Japan, Germany and the U.K. have been the main drivers of the global Fear Trade.
The Love Trade, on the other hand, is all about golds powerful allure and its timeless role as a gift without peer. It has two significant benefits: one, as beautiful gold jewelry to be worn, and two, as financial security. Although gold jewelry is often given as a special gift in Western countries, it pales in comparison to what takes place in China and India, or Chindiahome to about 40 percent of the worlds population, and the two largest gold importers.
The following image, courtesy of Visual Capitalist, shows emphatically just how enormous this regions population is. More people live inside the green circlewhich covers not just India and China but also Japan and some South China Sea countriesthan outside it.
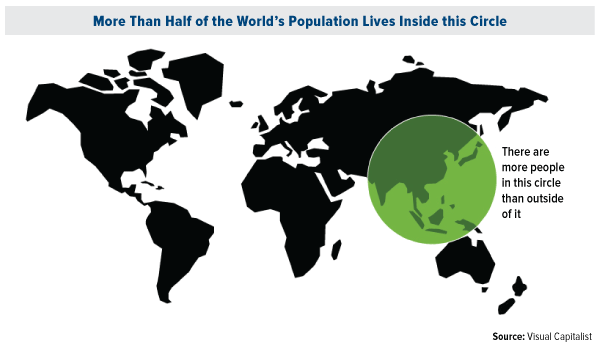
As I shared with you last month, the two Asian countries together accounted for more than half of total global gold jewelry demand in 2015. The U.S., by comparison, represented about 5 percent of demand. All of Europe, even less.
Significant to boosting the metals price are important cultural events, from Indias upcoming Diwali festival and fourth-quarter wedding season to the Chinese New Year in January. Going back decades, the yellow metal has tended to perform best in September, when jewelry, coin and bullion dealers restock their inventories in preparation for these celebrations.
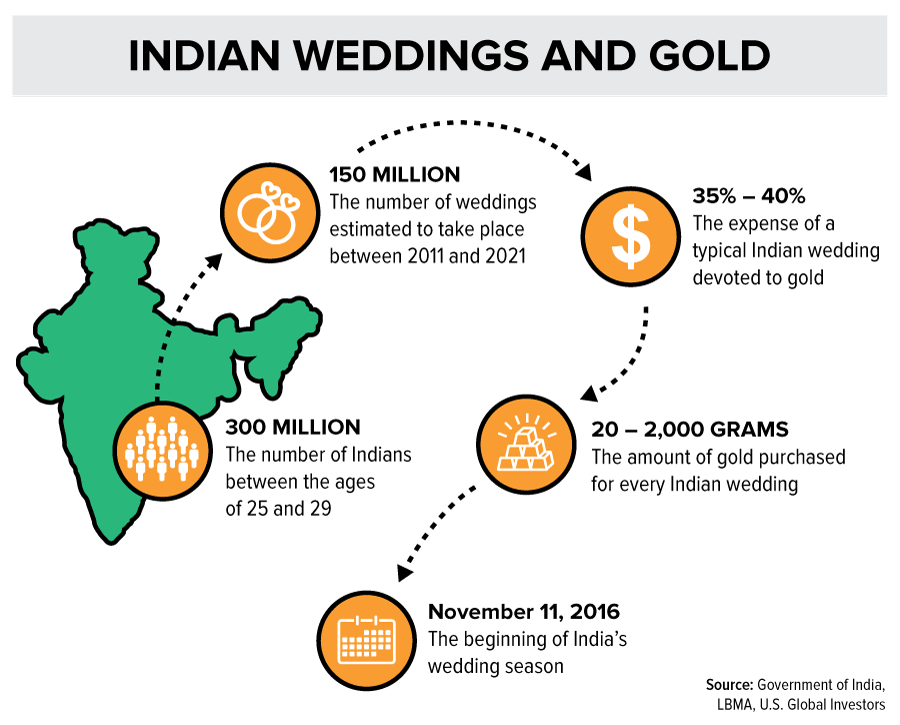
Also known as the Festival of Lights, Diwali begins October 30 this year, followed by the wedding season. To give you a sense of scale, as many as 150 million Indian weddings will be held between 2011 and 2021, according to the Government of India. For each wedding, between 0.7 and 70 ounces of gold are typically purchased, which is equivalent to 35 percent to 40 percent of total wedding expenses.
Of course, you cant convert cash into gold if you dont have the cash. Whats more, gold priced in Indian rupees and Chinese renminbi has really taken off, making it more expensive to Indian and Chinese consumers than America buyers.

Gold consumption, then, really depends on household income. Fortunately, income growth in Chindia is booming with the rise of the middle class.
Rising Incomes = Golden Opportunity
And just how much income growth are we talking about? According to Boston Consulting Group (BCG) data, consumer spending in both China and India will soon overtake spending in Germany and France, and is on a trajectory to match Japans level of consumption.

By 2020, the number of affluent households in Chinathose with annual incomes of at least $20,000will grow to 280 million, equal to 30 percent of the countrys urban population. Thats quite a leap up from todays 120 million households labeled as affluent. Its also good news for the Love Trade.
As for India, the number of middle class consumers is expected to triple between now and 2025, eventually reaching 89 million people, according to McKinsey & Company.
What I find even more incredible is that by 2030, the economic output of Indias top five cities is expected to reach the size of five middle-income countries today, according to McKinsey. Mumbais massive $245 billion economy, for example, could soon exceed the entire country of Malaysia. Likewise, Indias capital city of New Delhi could one day be bigger than the Philippines.
This presents a huge opportunity for the Love Trade to expand even more, as rising incomes and economic momentum have been a tailwind for gold demand.
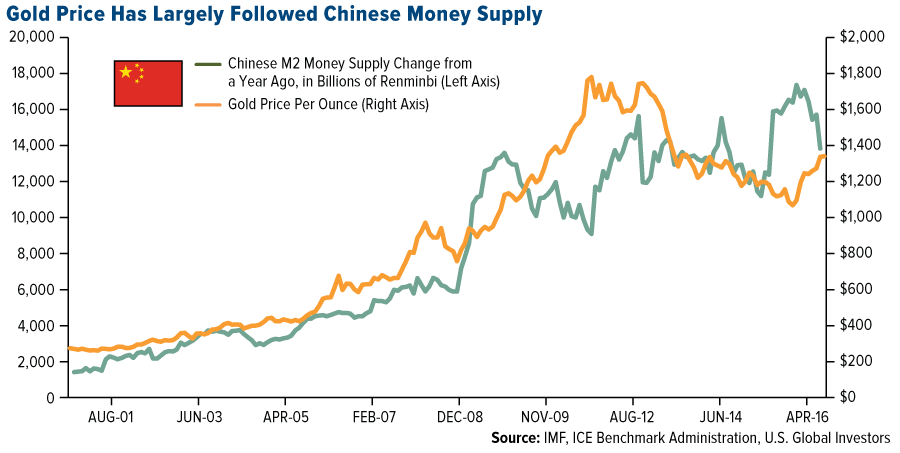
Ive pointed out before the relationship between M2 money supply growth in China and the price of gold. Money supply isnt the same as income growth, of course. But it serves as further evidence that the more money thats availableand the more people who have access to that moneythe more it can be converted into gold.
Negative real interest rates play an important role as well, as Ive discussed many times before. The yellow metal shares an inverse relationship with real rates, which is what you get when you subtract inflation from nominal interest rates.
 |
Speaking of which, many investors are wondering if rates will rise this year or not. December is still on the table, but the likelihood of a hike this month seems to have been doused by the August jobs report, which came in below expectations. CNBC reports that Goldman Sachs economists walked back their call for a September rate hike when it was revealed the U.S. economy added only 151,000 jobs, 32 percent fewer than the same month a year ago and a whopping 69 percent decrease from Julys payroll additions.
Be that as it may, markets seem to be betting the end of easy money could arrive sooner rather than later. Stocks sold off today in their worst session since June 24, the day after Brexit.
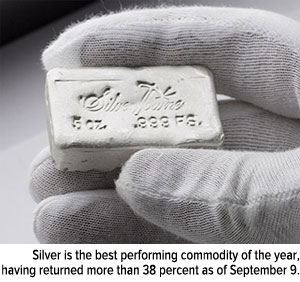
The Friday before last, both gold and silver jumped on the underwhelming jobs numbers. As I told Daniela Cambone during last weeks Gold Game Film, which you can watch here, silver is an important metal to follow because as people develop more confidence in the precious metal area, silver could begin to take center stage.
India Now the Fastest Growing Large Economy
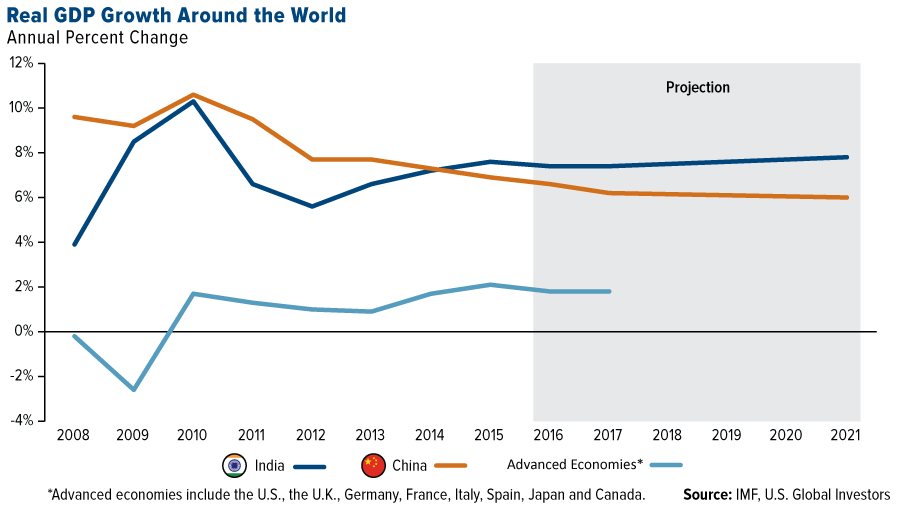
In June, I asked if India is the new China. I think the jurys still out on that question, but what we do know is that India has pulled ahead of China to become the worlds fastest growing large economy. In its June update to its world economic outlook, the International Monetary Fund (IMF) sees India advancing 7.4 percent this year, compared to Chinas 6.6 percent. On a relative basis, these are much stronger growth rates than what we find in advanced economies such as the U.S., European Union and Japan.
Indias manufacturing sector appears to be growing at a faster clip than Chinas, when we compare the two Asian giants purchasing managers indices (PMI). For the month of August, the India PMI rose to 52.6 from 51.8 in July, indicating healthy sector expansion.
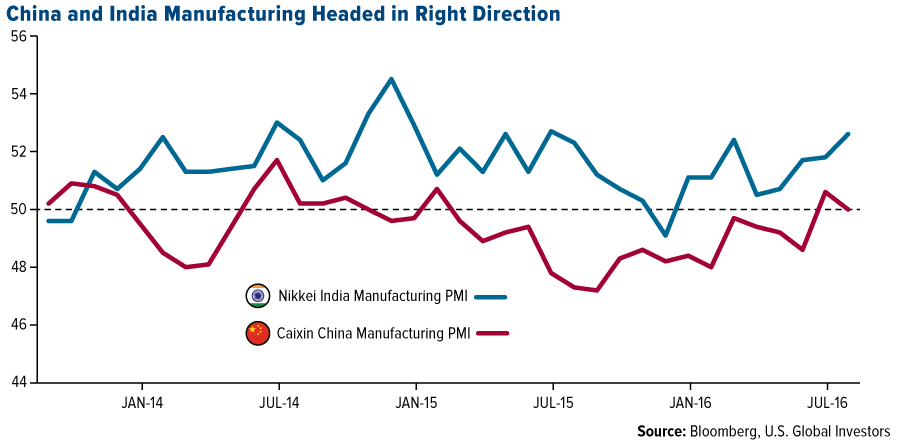
Meanwhile, China logged a neutral 50, indicating neither expansion nor contraction. But as you can see above, the trend is headed in the right direction and making steady improvements from its recent low of 47.2 in September 2015.
For the one-year period, the First Trust ISE Chindia Index Fund (FNI) is up more than 23 percent, as of September 4, suggesting the bad news weve been seeing in the media might be over, and the markets in China and India may have reached a bottom. This is good for global growth and the Love Trade.
Book Your Flights!
At the end of this month, I will be a speaker and panelist at Mines and Money in Toronto. The conference, one of the biggest and most attended in the world, brings together leading institutional investors, mining developers and sought-after industry experts. It will take place September 26 through 28, so dont hesitate to book your flights. I hope to see you there!
All opinions expressed and data provided are subject to change without notice. Some of these opinions may not be appropriate to every investor. By clicking the link(s) above, you will be directed to a third-party website(s). U.S. Global Investors does not endorse all information supplied by this/these website(s) and is not responsible for its/their content.
The Caixin China Manufacturing PMI, released by Markit Economics, is based on data compiled from monthly replies to questionnaires sent to purchasing executives in over 400 private manufacturing sector companies.
The Nikkei India Manufacturing Purchasing Managers Index, reported by Markit Economics, measures the performance of the manufacturing sector and is derived from a survey of 500 manufacturing companies.
M2 Money Supply is a broad measure of money supply that includes M1 in addition to all time-related deposits, savings deposits, and non-institutional money-market funds.
Holdings may change daily. Holdings are reported as of the most recent quarter-end. The following securities mentioned in the article were held by one or more accounts managed by U.S. Global Investors as of 6/30/2016: Sibanye Gold Ltd., Northern Star Resources Ltd., Regis Resources Ltd.


