-- Published: Tuesday, 27 September 2016 | Print | Disqus
By Frank Holmes
Last week I attended the Denver Gold Forum along with three other U.S. Global Investors representatives, including our resident precious metals expert Ralph Aldis. I was happy to see sentiment for gold way up compared to last years convention, as was turnout. I was also pleased to see Franco-Nevada, Silver Wheaton and Royal Gold in attendance, all of which Ive written extensively about.
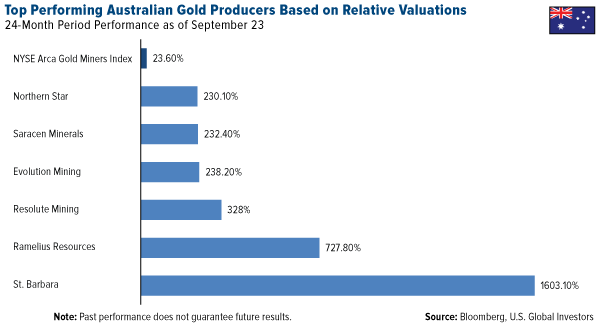
One of the most interesting presentations was held by Northern Star Resourcesthe third biggest listed gold producer in Australia, a dividend payer and a longtime holding of USGI. Ive always appreciated Northern Stars insistence on being a business first, a mining company second. This shareholder-friendly mantra is reflected in its stellar performance.
Compared to other companies in the NYSE ARCA Gold Miners Index (GDM), Northern Star is a sector leader in a number of factors, including five-year cash flow return on invested capital. Whereas the sector average is negative 1.6 percent over this period, Northern Stars is a whopping 27 percent, the most of any other mining company in the GDM.
This has helped it return an amazing 800 percent over the last five years as of September 23. Compare that to the GDM, which returned negative 56 percent over the same period.
Australian gold miners as a whole trade at an impressive discount to North American producers, 5.7 times earnings versus 8.3 times earnings, according to Perth-based Doray Minerals.
click to enlarge
Screening for high cash flow returns on invested capital, as you can see, helps give us a competitive advantage and uncovers hidden gems such as Northern Star and others.
Resource Equities Offer Attractive Diversification Benefits
A recent whitepaper published by investment strategist firm GMO makes a very convincing case for natural resource equities. I urge you to check out the entire piece when you have the time, but there are a few salient points I want to share with you here.
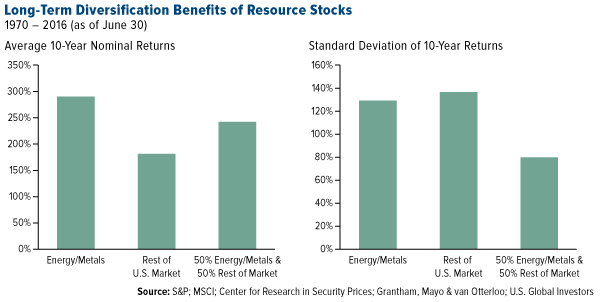
In the opinion of Lucas White and Jeremy Grantham, the papers authors, prices of many commodities will rise in the decades to come due to growing demand and the finite supply of cheap resources, presenting an attractive investment opportunity. Over the long-term, resource stocks have traded at a discount and outperformed their underlining metals and energy by a wide margin.
According to White and Grantham, a portfolio composed of 50 percent energy and metals, 50 percent all other equities, had a standard deviation thats 35 percent lower than the S&P 500 Index. Whats more, the returns of such a portfolio outperformed those of the S&P 500, resulting in a risk-adjusted return thats 50 percent higher than that of the broader market.
click to enlarge
Resource equities have also historically shown a low to negative correlation to the broader market, which might appeal to bears. The reason? When metals and energy have risen in price, its been a drag on the economy. The reverse has also been true: Low prices have been a boon to the economy.
The thing is, general equities currently do not give investors enough exposure to natural resources. The weight of energy and metals in the S&P 500 has been halved in the last few years as oil and other materials have declined. Considering the diversification benefits, investors should consider a greater allocation to the sector.
Timing Is Key
Theres mounting evidence that now might be an opportune time to get back into resource stocks. Following the sharpest decline in crude oil prices in at least a century, as well as a six-year bear market in metals, the global environment could be ripe for a commodity rebound. From its January trough, the Bloomberg Commodity Index has rallied 17 percent, suggesting commodities might be seeking a path to a bull market.
During the down-cycle, many companies managed to bring costs lower, upgrade their asset portfolios and repair their balance sheets. As a result, many of them are now free cash flow positive and are in a much better positon to deliver on the bottom line when commodity prices increase.
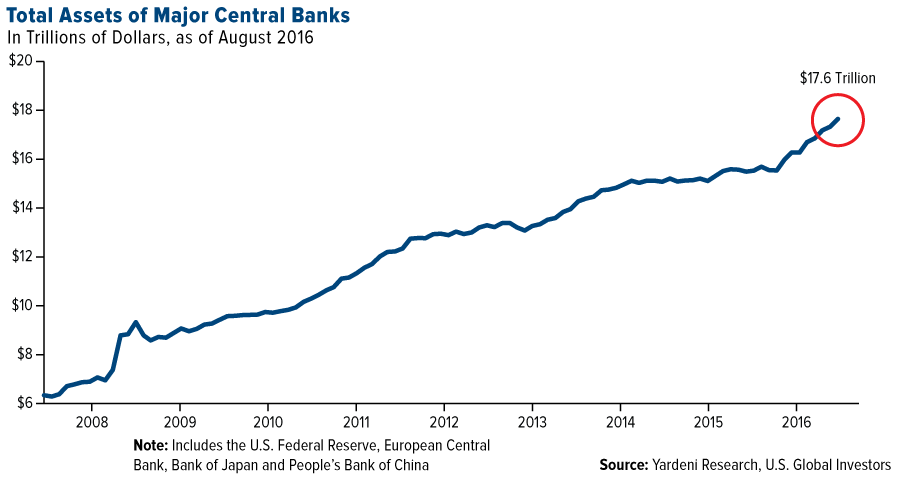
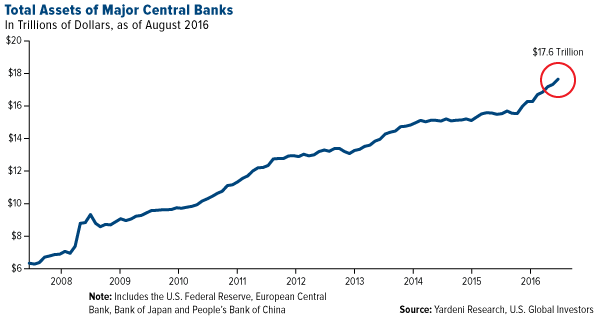
Ive often written about the imbalance between monetary and fiscal policies. My expectation is that unprecedented, expansionary global monetary policy will be followed by fiscal expansion. Consider this: Total assets of major central banksincluding those in the U.S., European Union, Japan and Chinahave skyrocketed to $17.6 trillion dollars as of August 2016, up from $6.3 trillion in 2008.
click to enlarge
This expansion is expected to result in significant inflation gains over the next decade, an environment in which natural resource stocks have historically outperformed the broader market.
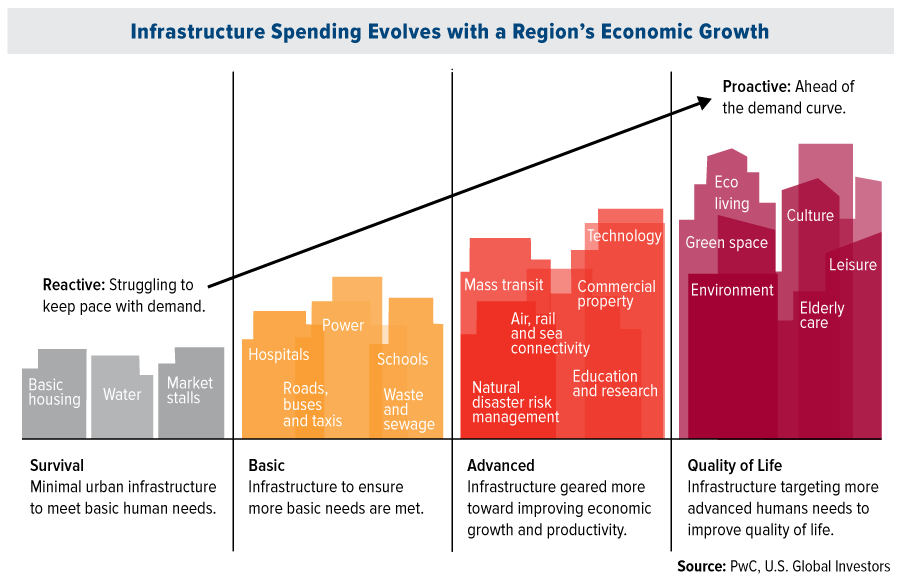
Infrastructure Spending About to Increase?
China largely drove the global infrastructure build out over the past decade as rapid economic growth and rising incomes increased the demand for advanced and quality of life infrastructure. This resulted in a breathtaking commodities bull market.

click to enlarge
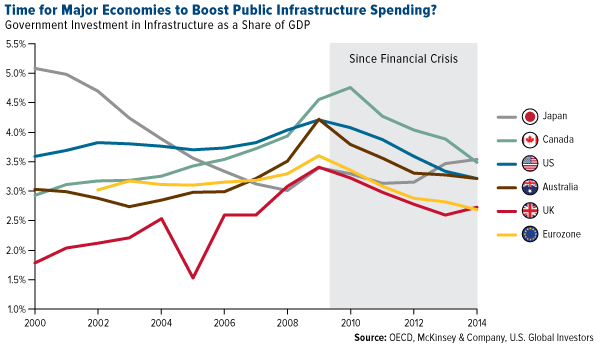
Now, other advanced countries, the U.S. especially, are readying to sustain the next cycle to repair its aging and uncompetitive infrastructure.
As you can see, most major economies dramatically cut infrastructure spending after the financial crisis, indicating it might be time to put some of that $17.6 trillion to good use.
click to enlarge
According to the Center on Budget and Policy Priorities (CBPP), the U.S. is presently facing a funding gap of $1.7 trillion on roads, bridges and transit aloneto say nothing of electricity, schools, airports and other needs. Meanwhile, state and local infrastructure spending is at a 30-year low.
If this financing cant be raised, says the American Society of Civil Engineers (ASCE), each American household could lose an estimated $3,400 per year. Inefficient roadways and congested airports lead to longer travel times, and goods become more expensive to produce and transport.
Lets look just at national bridges. After an assessment of bridges last year, the American Road & Transportation Builders Association (ARTBA) found that 58,495, or 10 percent of all bridges in the U.S., are structurally deficient. To bring all bridges up to satisfactory levels, the U.S. would currently need to spend more than $106 billion, which is six times what was spent nationwide on such projects in 2010.

Fortunately, both U.S. presidential candidates have pledged to boost infrastructure spendingone of the few things they share with one another. Hillary Clinton says she will spend $275 billion over a five-year period, while Donald Trump says hell spend double that.
Trumps central campaign promise, as you know, is to build a big, beautiful, powerful wall along the U.S.-Mexico border, which analysts at investment firm Bernstein estimate could cost anywhere between $15 billion and $25 billion, requiring 7 million cubic metres of concrete and 2.4 million tonnes of cement, among other materials.
As I like to say, government policy is a precursor to change. Ill be listening closely for further details on Trump and Clintons infrastructure plans this coming Monday during the candidates first debate. I hope youll watch it too! Media experts are already predicting Super Bowl-sized audiences.
Dont Count China Out
In the past year, a lot of ink has been devoted to Chinas slowdown after its phenomenal spending boom over the last decade, but there are signs that spending is perking upa tailwind for resources. According to the Wall Street Journal, Chinese economic activity rebounded in August, driven by government spending on infrastructure and rising property taxes.
In the first seven months of 2016, the WSJ writes, China invested 962.8 billion yuan ($144.1 billion) in roads and waterways, an 8.2 percent increase from the previous year.
The Asian giant still accounts for a large percentage of global trade in important resources such as iron ore, aluminum, copper and coal. This is why we closely monitor the countrys purchasing managers index (PMI), which, according to our own research, has been a reliable indicator of commodity price performance three and six months out.
All opinions expressed and data provided are subject to change without notice. Some of these opinions may not be appropriate to every investor. By clicking the link(s) above, you will be directed to a third-party website(s). U.S. Global Investors does not endorse all information supplied by this/these website(s) and is not responsible for its/their content.
Cash Flow Return on Invested Capital (CFROIC) is defined as consolidated cash flow from operating activities minus capital expenditures, the difference of which is divided by the difference between total assets and non-interest bearing current liabilities.
The Purchasing Managers Index is an indicator of the economic health of the manufacturing sector. The PMI index is based on five major indicators: new orders, inventory levels, production, supplier deliveries and the employment environment.
The NYSE Arca Gold Miners Index is a modified market capitalization weighted index comprised of publicly traded companies involved primarily in the mining for gold and silver. The index benchmark value was 500.0 at the close of trading on December 20, 2002. The S&P 500 Stock Index is a widely recognized capitalization-weighted index of 500 common stock prices in U.S. companies. The Bloomberg Commodity Index is made up of 22 exchange-traded futures on physical commodities. The index represents 20 commodities, which are weighted to account for economic significance and market liquidity.
Standard deviation is a measure of the dispersion of a set of data from its mean. The more spread apart the data, the higher the deviation. Standard deviation is also known as historical volatility.
There is no guarantee that the issuers of any securities will declare dividends in the future or that, if declared, will remain at current levels or increase over time.
Holdings may change daily. Holdings are reported as of the most recent quarter-end. The following securities mentioned in the article were held by one or more accounts managed by U.S. Global Investors as of 6/30/2016: Franco-Nevada Corp., Silver Wheaton Corp., Royal Gold Inc., Northern Star Resources Ltd., Doray Minerals Ltd., Saracen Minerals Holdings Ltd., Evolution Mining Ltd., St. Barbara Ltd.
| Digg This Article
-- Published: Tuesday, 27 September 2016 | E-Mail | Print | Source: GoldSeek.com