By Rambus
Tonight I would like to update you on the US dollar as it plays such an important role in so many different markets. Getting the big trend right on the US dollar can help you see what areas are affected by the dollar to invest in. There are alot of areas that have an inverse correlation to the dollar, such as commodities and the precious metals in particular.
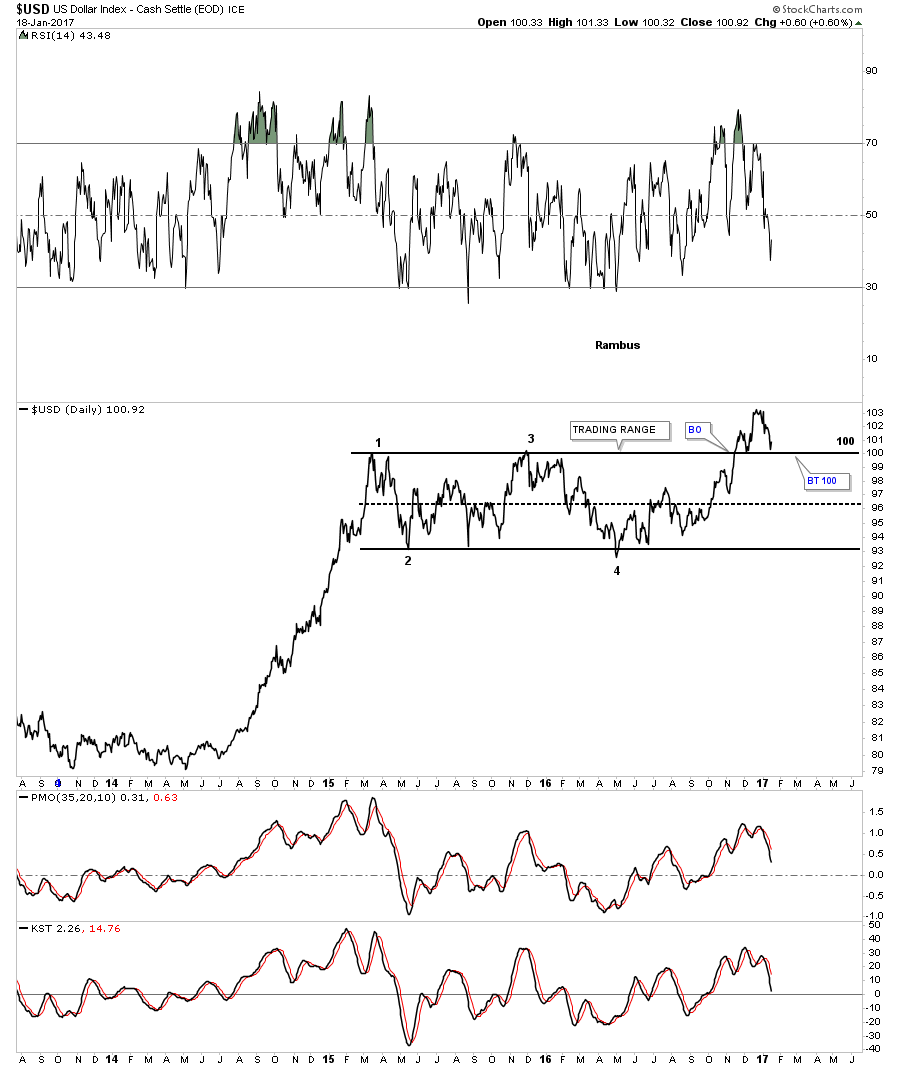
Let start with just with just a simple daily line chart that shows the two year sideways trading range with the breakout and the backtest that is currently underway. As you can see this is actually the 2nd backtest to the top rail at the 100 area so there is no question the top rail is hot.
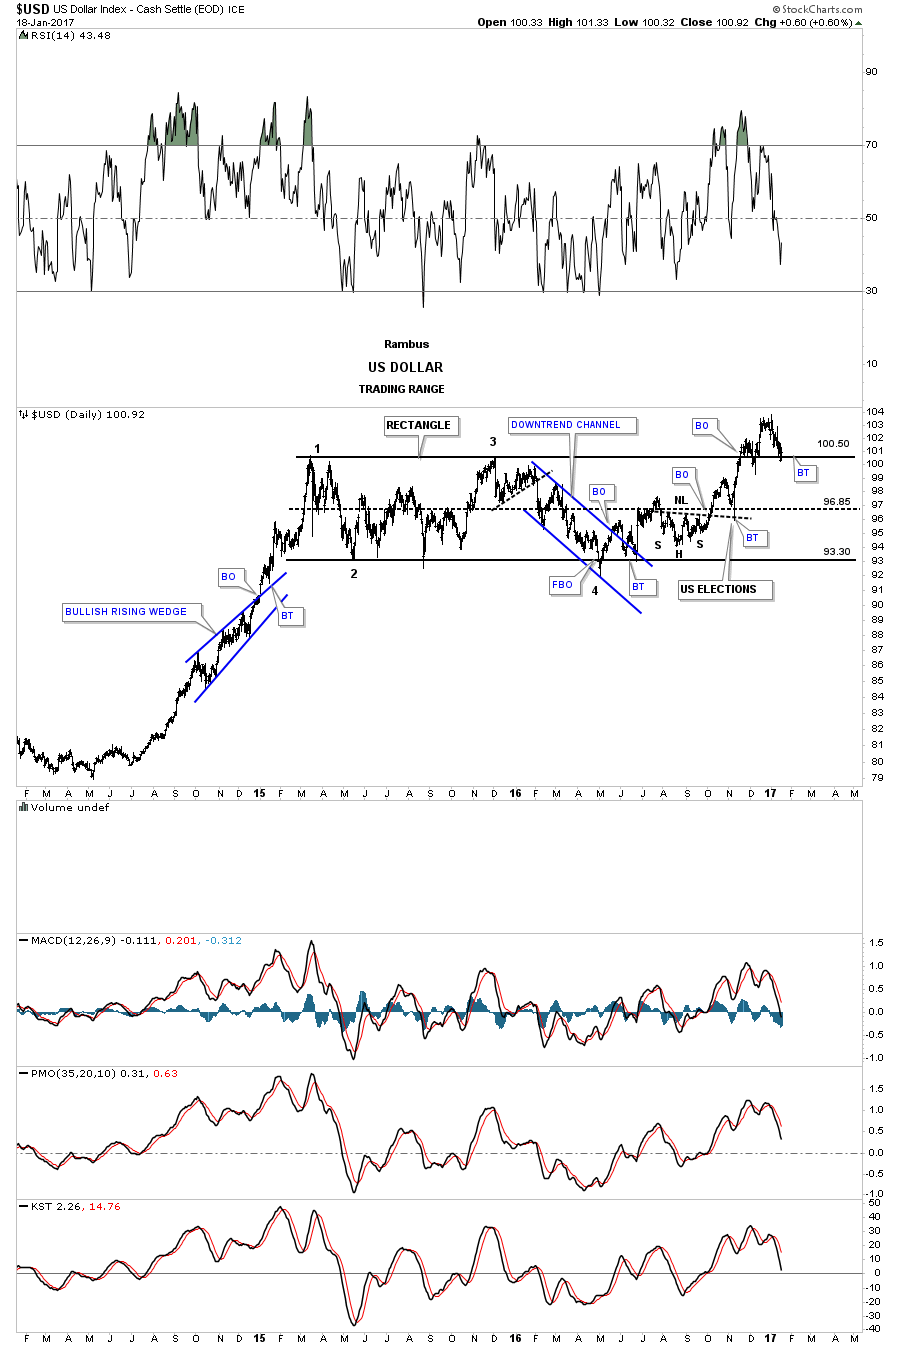
This next chart for the US dollar is a daily bar chart which Ive been showing as a rectangle consolidation pattern. If one were to connect the reversal point, #1 and #3 for the top rail, and reversal points #2 and #4 for the bottom rail, we would have an expanding falling wedge. The top rail would be sloping slightly down just a tad which would help in showing the backtest a little more clearly. The difference between the two would only be about a point or so. A good habit to get into when you see there may be a little morphing of a trendline is to tweak it, because it may be tested again at a later date.
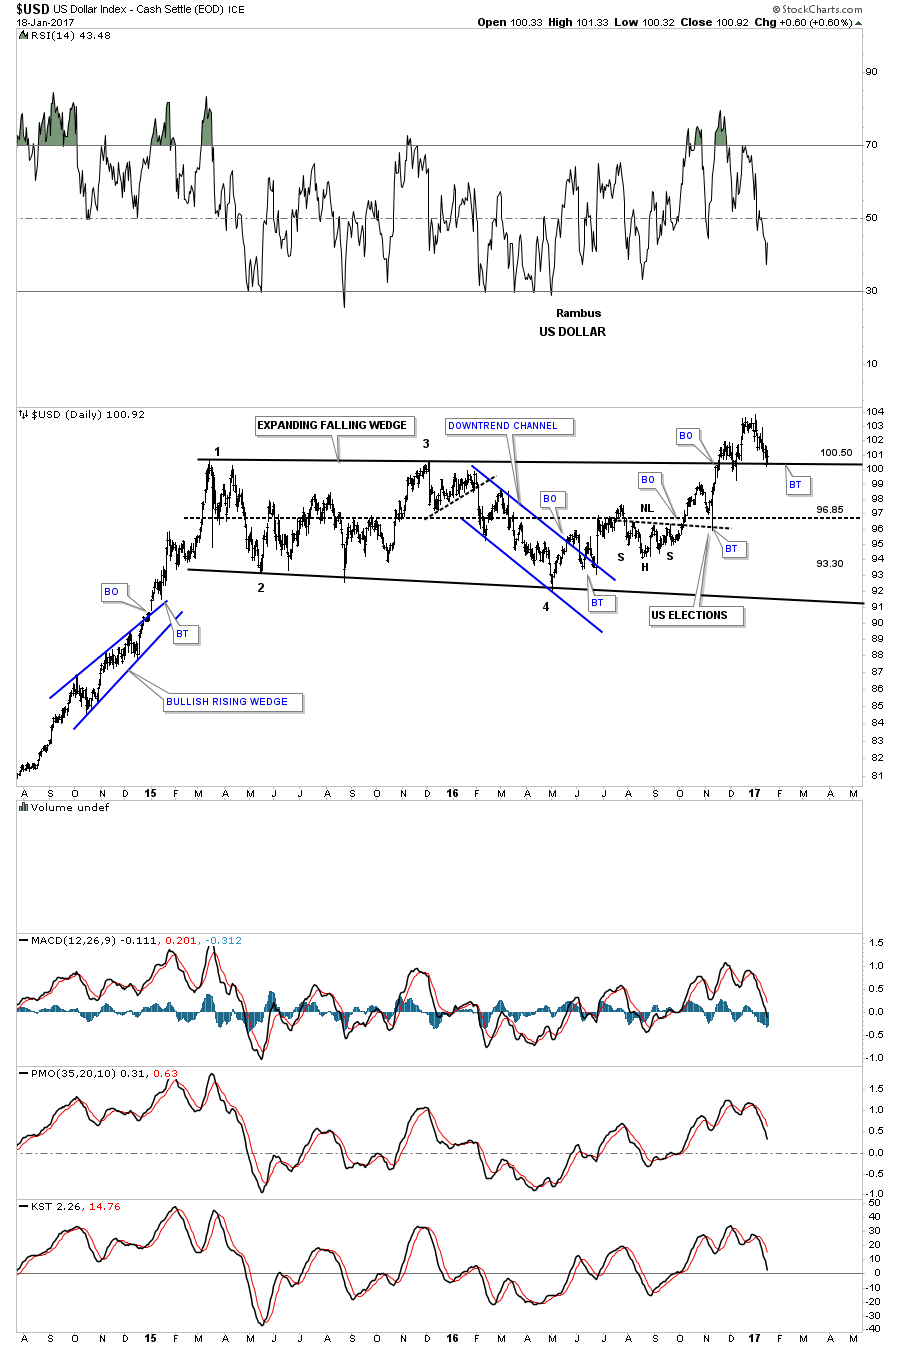
Below is the updated version of the morphing rectangle halfway pattern which shows the nearly 2 year expanding falling wedge.The top rail is almost perfectly horizontal, but to get the backtest price objective right, every fraction of a point helps.
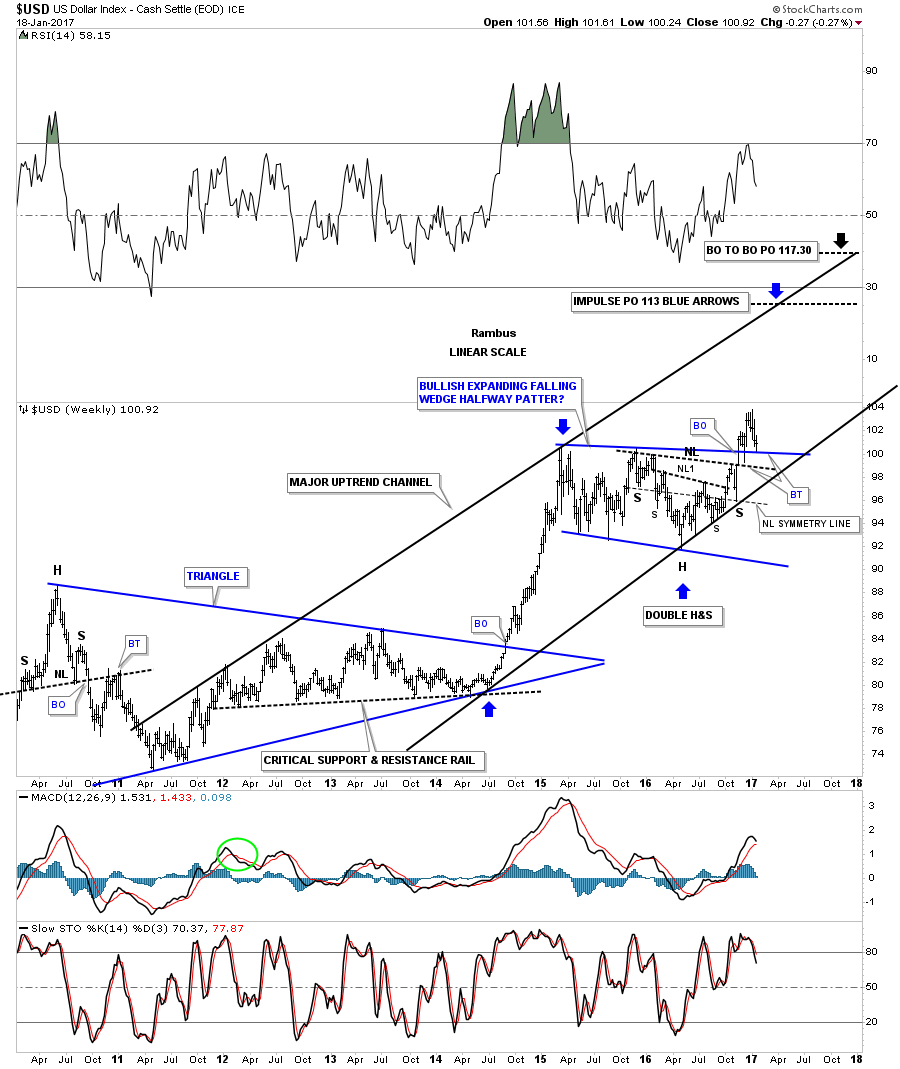
Tonight is the first time Ive shown this chart to you. Below is a weekly look at the US dollar which shows the blue expanding falling wedge and how it fits into the big picture as a halfway pattern to the upside. Ive shown you many bull markets that form one consolidation pattern on top of the next, which can go on for years. When a bull market ends there is usually a recognizable reversal pattern that will build out which will signal a trend change. As long as the top rail of the blue expanding falling wedge holds support we have a consolidation pattern in place. Until the price action takes out the top rail to the downside we have a consolidation pattern, not a reversal pattern.
Note the H&S consolidation pattern that formed on the right side of the blue consolidation pattern which should give the US dollar the energy it needs to have a successful breakout and impulse move to the upside. After the neckline breakout and the initial breakout above the top rail of the blue expanding falling wedge, the price action backtested the neckline with a nice long daily reversal bar. This week the US dollar is backtesting the top rail of the blue expanding falling wedge. The symmetry of the bigger H&S shows the neckline symmetry line which is parallel to the neckline that showed us the low for the right shoulder.
If the US dollar is in a bull market on an intermediate term bases it should make higher highs and higher lows which creates an uptrend. Note how many touches the bottom rail of the major uptrend channel has which tells us its an important trendline. You can do the same thing with the top rail which shows about 4 touches. Also, as you can see the major uptrend channel is not parallel, but more of a rising wedge formation with still a lot of overhead room for the US dollar to move higher.
That brings me up to the measured move for the blue expanding falling wedge halfway pattern. The first price objection is measured from the last reversal point in the blue triangle pattern at the bottom of the chart to the first reversal point in the blue expanding falling wedge. That distance is taken and added to the 4th reversal point in the blue expanding falling wedge to get a price objective up to the 113 area, as shown by the blue arrows, and is called an impulse measured move.
The second measured move is taken from the breakout point from the blue triangle to the first reversal point on the blue expanding falling wedge. That distance is then taken and added to the breakout point of the blue expanding falling wedge which gives us a second price objective up to the 117.30 area. This is called the breakout to breakout measured move. This is on a linear scale chart.
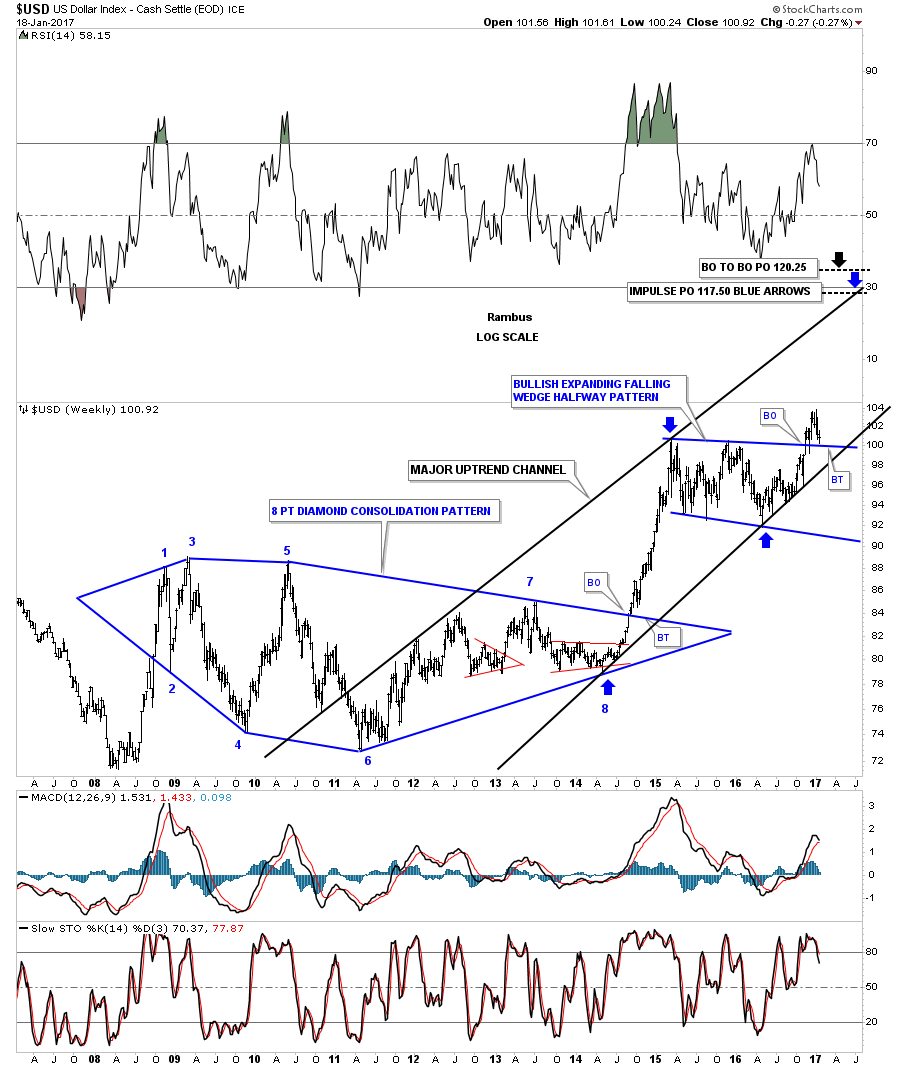
This next chart is a log scale weekly look at the US dollar which gives us a little higher price objectives based on the two measured move techniques. If one was to look at the price action since the 2011 low and you didnt know what stock you were looking at you would most likely think that this stock is in a beautiful uptrend.
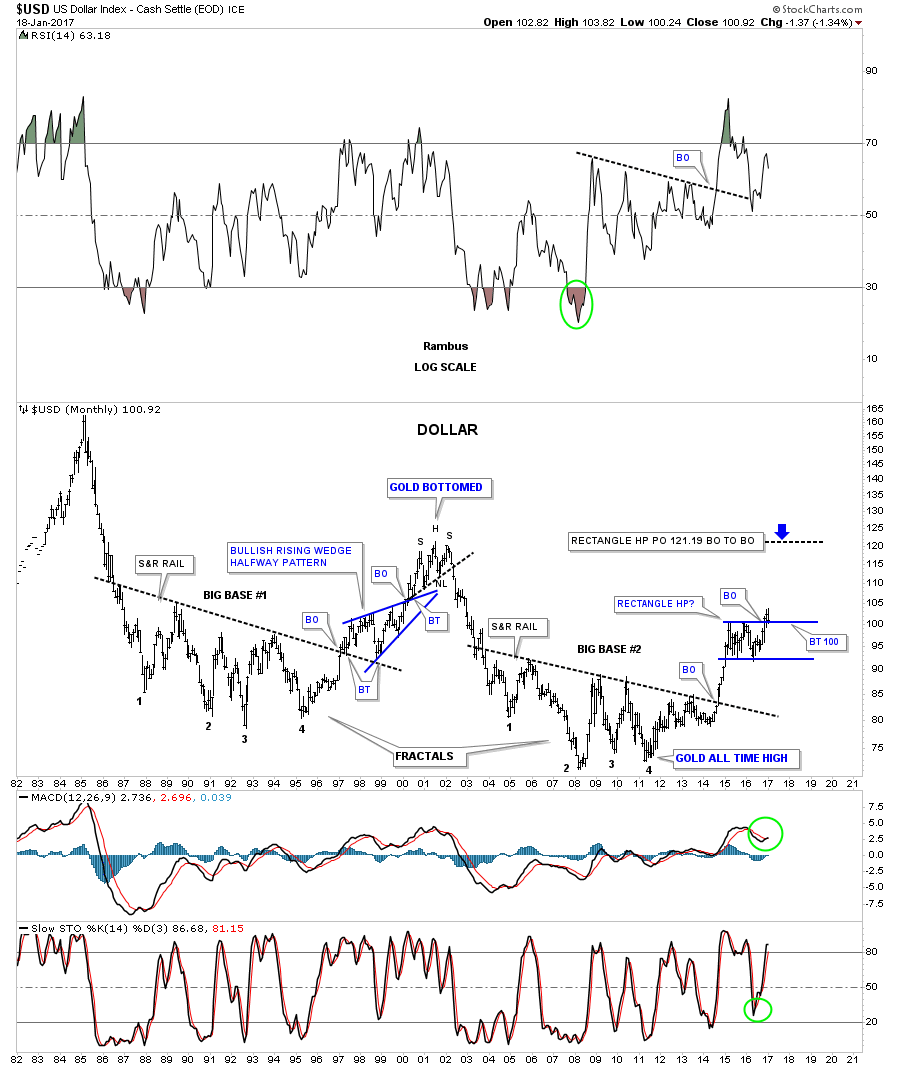
This next chart is a 35 year monthly look which shows the two big fractal bases labeled big base #1, and big base #2. Back in the late 1990s when the US dollar broke out of big base #1 it formed the blue bullish rising wedge as a halfway pattern. That backtest to the top rail took three full months to complete before the second impulse move took off. If our current blue halfway pattern plays out it will have a price objective up to the 120 area which is about as high as the the 2000 bull market high. At that point we can look for another consolidation pattern to start building out if the US dollar is in a strong secular bull market. If this rally is like the last major impulse move up out of big base #1 then we should see some type of reversal pattern build out similar to what we saw at the 2000 high. That H&S top in 2000 built the foundation for golds bull market to follow, which lasted close to 11 years.
Again, if the US dollar is in a secular bull market then it will most likely have a negative impact on commodities and the precious metals complex. For those members that were with us during the strong impulse move up out of big base #2 you will remember what that did to commodities, the precious metals complex and most of the important currencies of the world. With that said Im paying especially close attention to the commodities indexes for any sign of failure. The chart for the $WTIC I posted earlier today is a good example of to watch for. The price action will let us know of its intentions if we can keep an open mind. It is what it is until it isnt. All the best Rambus