-- Published: Sunday, 5 February 2017 | Print | Disqus
By Steve St. Angelo, SRSrocco Report
The global markets were humming right along until a large cracked appeared in 2015. This big crack in the global economy seemed to go unnoticed, however the implications are quite serious if the trend continues.
Actually, I had no idea how significant this development was until I compared the data to what took place during the financial and economic crash in 2008-2009.
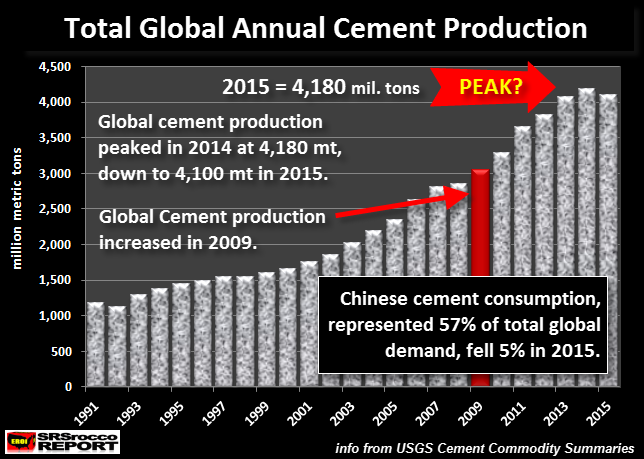
According to the USGS U.S. Geological Survey, rapidly rising global cement production reached a peak of 4,180 million tons in 2014, and then suddenly declined in 2015:
While a drop of 80 million tons in 2015 isnt a huge amount, when compared to the data in 2009, its a significant trend change. Let me explain. The World Bank just revised their figures showing global GDP (Gross Domestic Product) declined 5.7% in 2015:
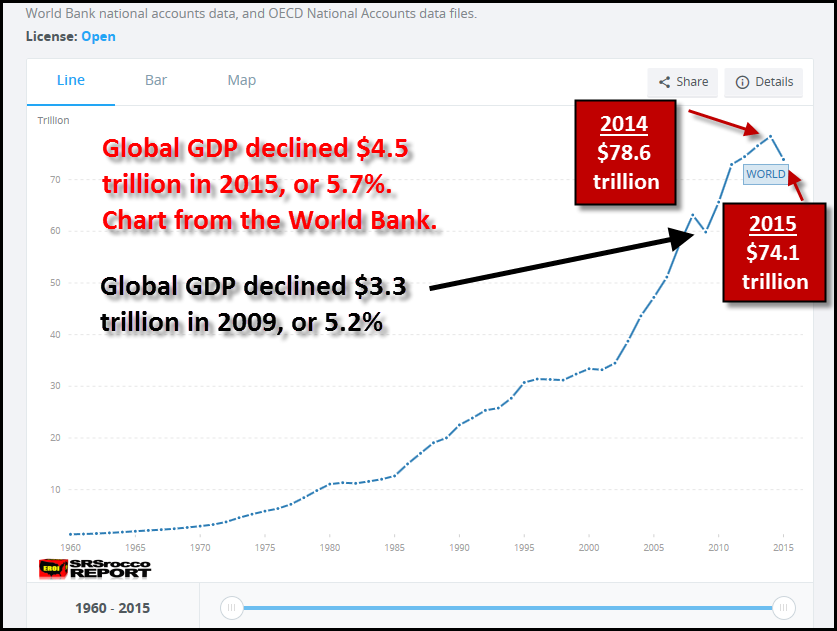
When they first came out with their figures, the World Bank reported that global GDP declined from $78.4 trillion in 2014 to $73.9 trillion in 2015. As we can see they revised each figure up by $200 billion, but the overall decrease in GDP was still 5.7%. Regardless, the interesting thing to focus on is that during the U.S. and Global financial meltdown in 2009, the world GDP fell less in percentage terms at only 5.2%.
Now, if we look at the Global Annual Cement Production chart above, we will see (shown as a RED BAR) that global cement production increased by a stunning 7% in 2009. Global cement production jumped from 2,850 million tons in 2008 to 3,050 million tons in 2009. This was mainly due to a large increase in Chinese cement production.
As the chart also shows in the lower right hand side, Chinese cement production accounted for 57% of the worlds total in 2015. Furthermore, the decline in global cement production was mainly due to a 5% drop of Chinese cement production that year.
The reason for the big drop in global GDP in 2015 and resulting decline in world cement production was due to the 47% collapse in the price of a barrel of oil. This had a serious impact on the global markets
and still does. Even though the oil price has risen recently, it declined another 17% in 2016 compared to the previous year. I would imagine this should impact 2016 global GDP negatively as well. We will just have to wait and see what the figures turn out to be when the World Bank releases them in the next several months.
So, has global cement production peaked? Thats a good question. From the forecasts I have seen, analysts are projecting that global cement production will continue to increase to 4,370 million tons (4.4 billion tons) by 2020. It will be interesting to see if these forecasts pan out. However, the propping up of the world stock markets, corporations and governments with money printing and debt is most certainly getting out of hand.
For example, As Wolf Richter stated in his recent article, Dow Companies Report Worst Revenues since 2010, Dow Rises to 20,000 (LOL?):
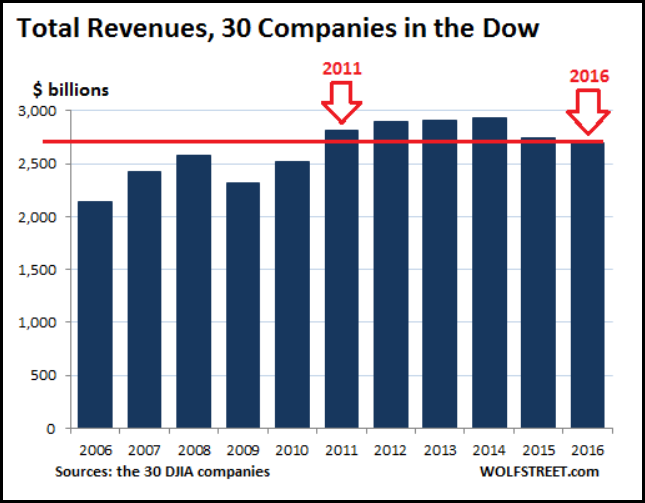
This relentless and eager focus on Wall Street hocus-pocus explains in part why the DJIA has soared 73% over the five years to 20,000 even as aggregate revenues, despite the delirious acquisition binge, have been mired down in a sea of stagnation.
Okay, now that we are discussing the U.S. Dow Jones Index, what on earth is going on with U.S. cement consumption? Well, lets just say, U.S. cement consumption has likely PEAKED a decade ago:
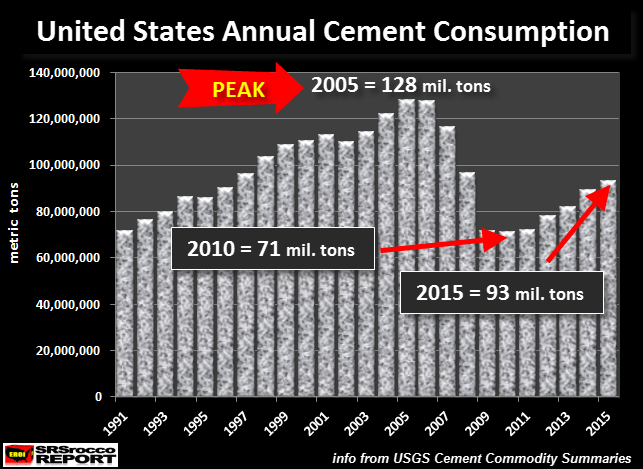
I decided to show U.S. cement consumption rather than just production, because the United States imports a significant amount of cement to meet its demand. So, focusing on U.S. cement demand provides us a clear picture that something is seriously wrong here.
According to the USGS data, U.S. cement consumption peaked in 2005 at 128 million tons and literally fell off a cliff, by falling to a low of 71 million tons in 2010. This was a staggering 44% decline in U.S. cement consumption in five years. Actually the majority of the decline took place between 2006 and 2009. Thus, in these three years, U.S. cement demand fell by 43%.
Even though U.S. cement consumption has increased to 93 million tons in 2015, this is still down 35 million tons from its high of 128 million tons in 2005. So, how did U.S. GDP or the Dow Jones Index continue to increase by leaps and bounds, if cement consumption is still 27% below its 2005 peak??
Yes, I would imagine some would say that the United States does not need to grow its cement consumption that much because its infrastructure has been mostly built out. Well, that may be partly true, but we have to go back all the way to 1997 (nearly 20 years) to equal the same amount of domestic cement consumption reported last year.
I would imagine the huge surge of U.S. cement demand, ending in 2006, was due to the massive housing boom (including strip mall, commercial and warehouse construction) built on the Mortgage Backed Security Ponzi Scheme.
For example, when the country consumed 127.6 million tons of cement in 2006, U.S. GDP was $13.8 trillion. However, with domestic cement consumption down 27% to 93 million tons in 2015 versus 2006, U.S. GDP surged to $18 trillion. Something just doesnt seem to add up
does it?? (GDP source: FRED data)
Well, just as Wolf Richter stated about the Dow Jones hocus-pocus, there seems to be a lot of HOT AIR propping up the entire U.S. financial economy. So, how long can President Trump along with the Fed and member banks continue to prop up the U.S. market that should have died years ago?
If we pay attention to what is taking place in the energy industry, we will find our clue. I will be putting out an article shortly on THE U.S. MAJOR OIL INDUSTRY CONTINUES TO BLEED TO DEATH. This should provide an insight on just how bad the situation is becoming in the most vital industry in the U.S. economy.
Without oil, the U.S. and global economy GRINDS TO A HALT
and fast.
Lastly, several of my followers sent me a recent article titled, How I came to Realize I was Wrong About Peak Oil F. William Engdahl. In the article, Mr Engdahl states the following:
The media said they were told it was because the price of a barrel of oil went way up (due to shortages). I knew that was a lie, and so did others, and radio stations began providing a service where folks could call in locations of gas stations with low prices and they would broadcast the address.
Fortunately, the days when this nonsense can run our lives are in short supply themselves. People are wising up and refusing to buy into the lies.
According to Engdahl, our planet manufactures oil in its core, and replenishes what is extracted by Big Oil. There is no shortage. There never was.
I plan on writing a rebuttal to Mr. Engdahls stunning absence of logic, reason and science on this subject matter. However, I will not be doing this to debate him, rather it will be to provide more information to help answer questions by those who read the SRSrocco Report.
Check back for new articles and updates at the SRSrocco Report.
| Digg This Article
-- Published: Sunday, 5 February 2017 | E-Mail | Print | Source: GoldSeek.com


