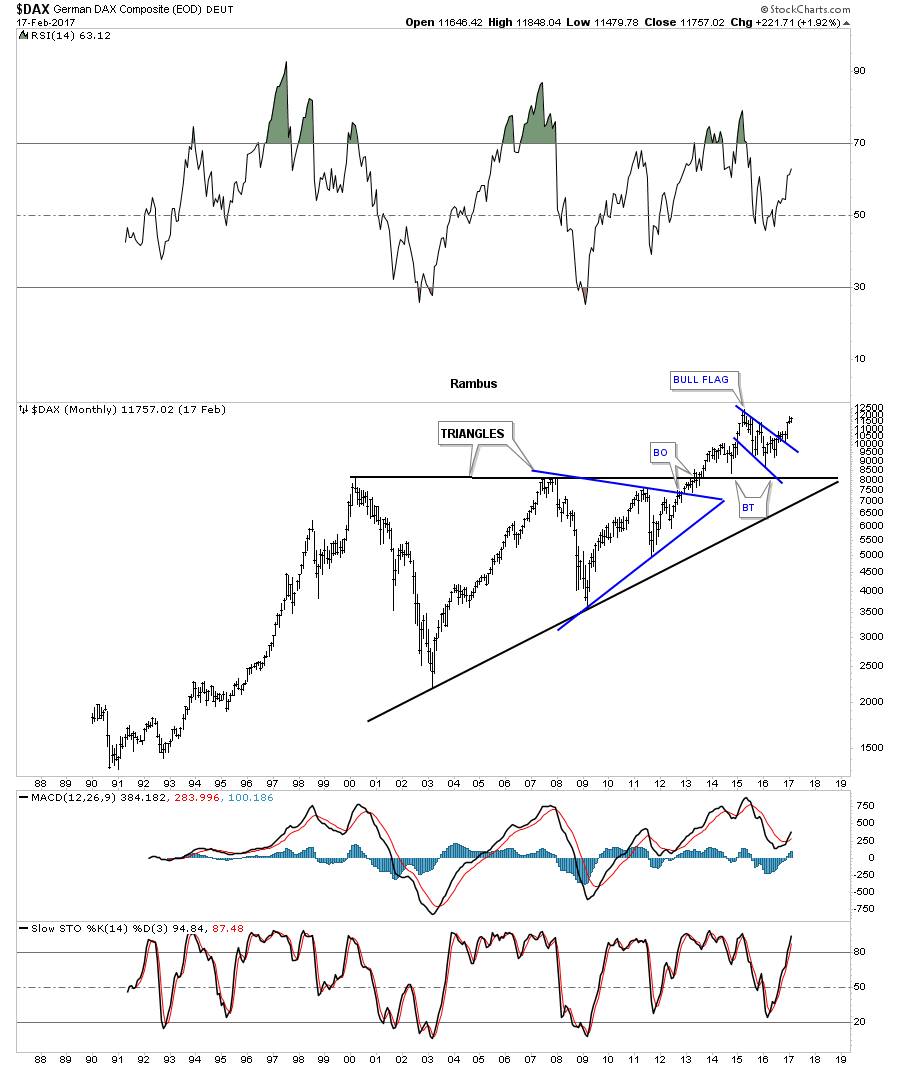
Before we look at some of the 2009 bull market uptrend channels there are a couple of more big consolidation patterns I would like to show you on some of the stock market indexes. The $DAX, German stock market, broke out of its 13 year triangle consolidation pattern back in 2012. Late last year it broke out of the blue bull flag with a nice clean backtest to the top rail. The big triangle consolidation pattern also had a smaller triangle as part of its internal structure.
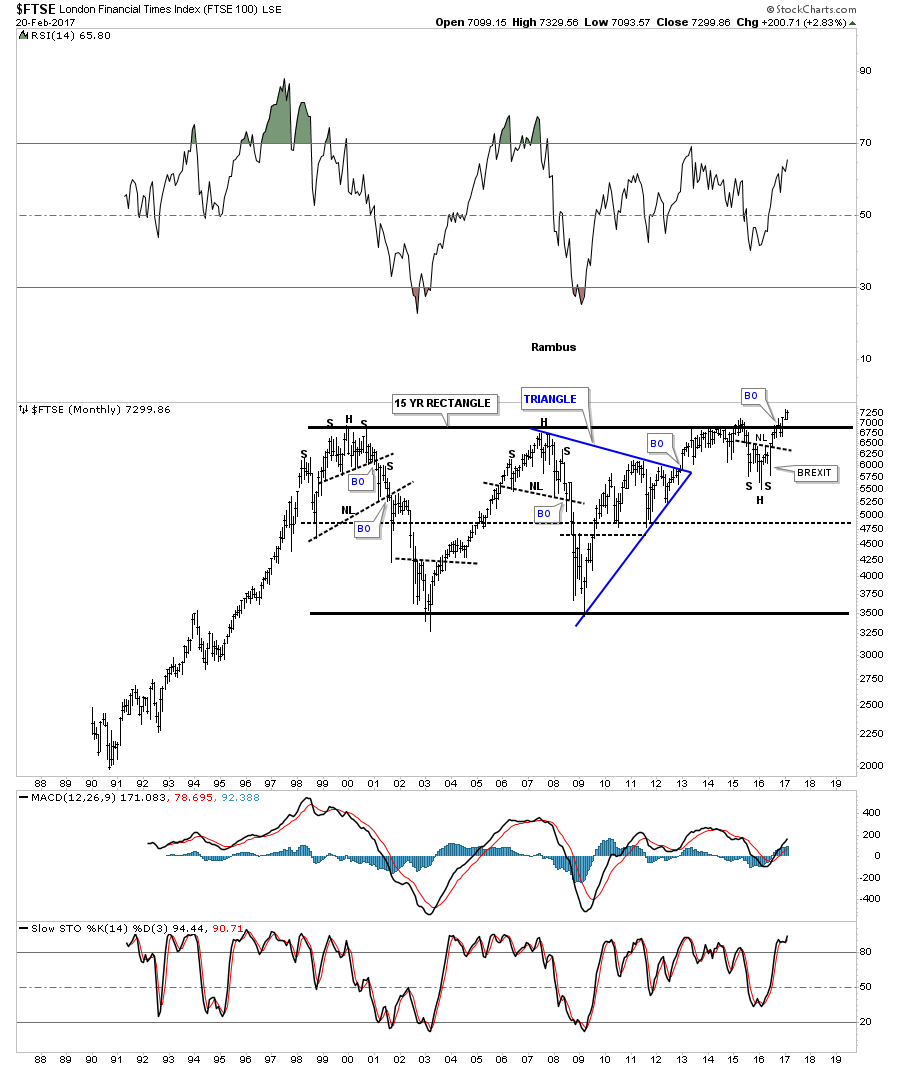
Next up is the $FTSE, London Financial Times index, which is in the process of breaking out from a 15 year rectangle consolidation pattern. Just like the $DAX the FTSE also built out a triangle consolidation as part of the much bigger rectangle. The key to the breakout of this massive rectangle is the H&S bottom that formed just below the breakout area. The right shoulder was formed during the BREXIT vote. The shakeout before the breakout.
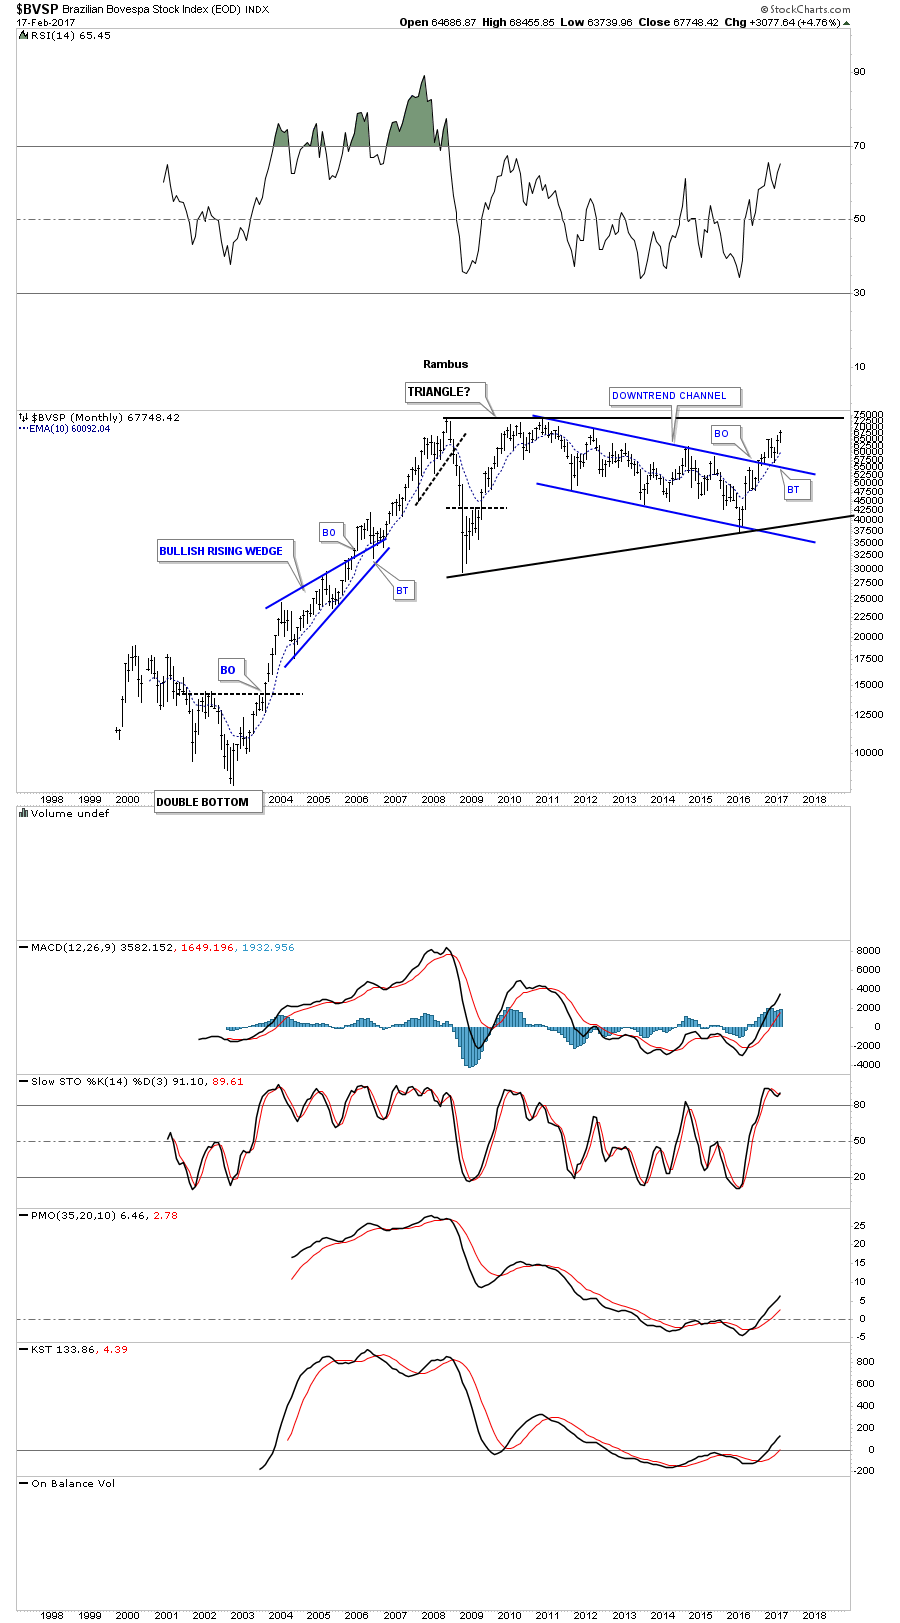
The $BVSP, Brazilian stock market, is still working on a 9 year triangle consolidation pattern. We last looked at this chart in December of last year when it was backtesting the top rail of a multi year downtrend channel.
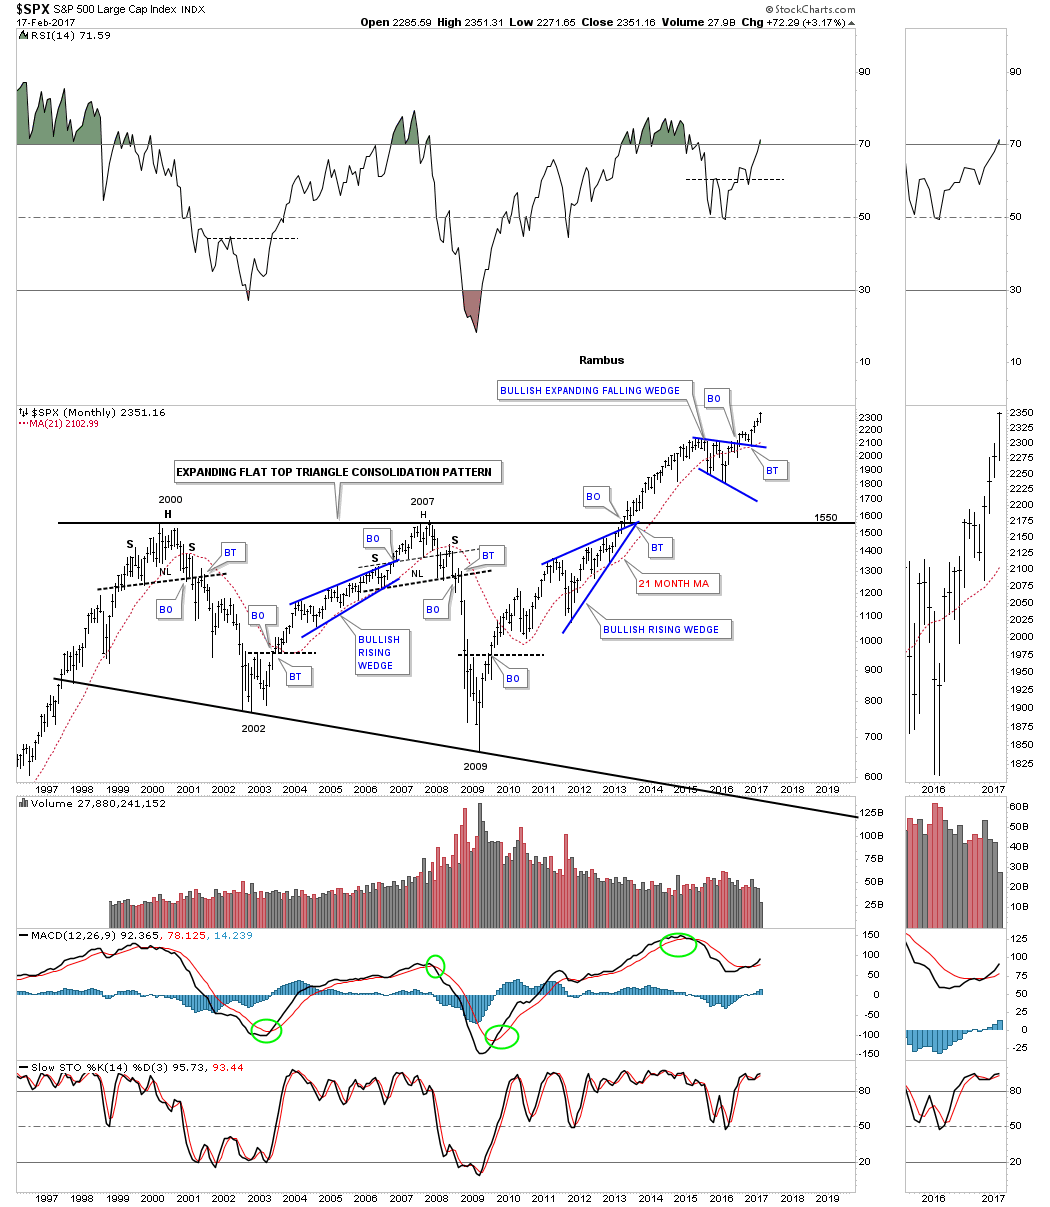
Lets look at a couple of US stock markets that weve been following for many years starting with the $SPX. This index was actually one of the first of the major stock markets to breakout of its massive consolidation patterns. The breakout in 2013 was accompanied by the breakout from the blue bullish rising wedge. There was a very short one month backtest to the top rail of the flat top expanding triangle before the impulse leg up began in earnest. That impulse leg ended in 2015 where the next consolidation pattern was needed to consolidate those gains, forming the blue bullish expanding falling wedge. Again notice the clean breakout and backtest to the top rail which has led to our current impulse move higher, which is making new all time highs.
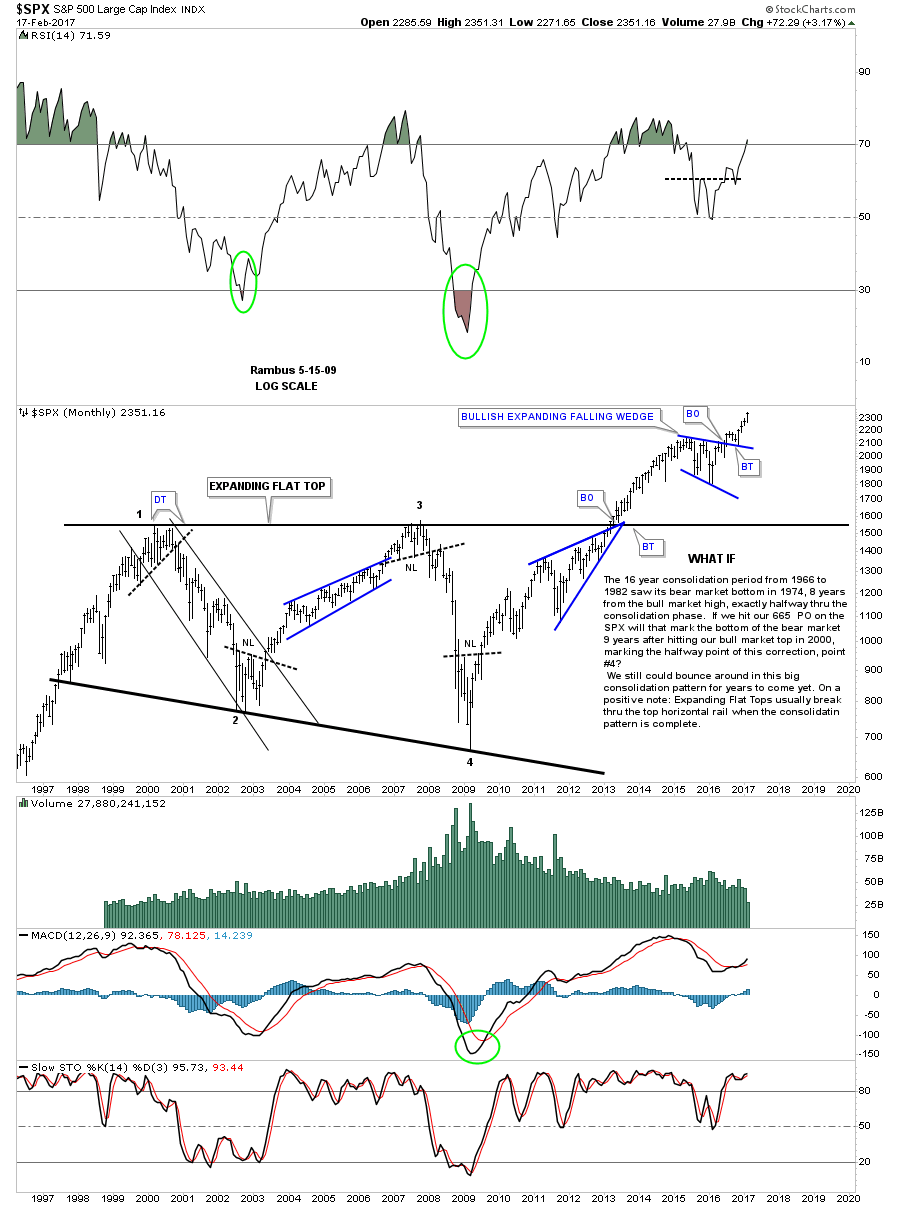
I commented on this exact same chart as the one above back in May of 2009, two months after the bottom was put in at the fourth reversal point. I was speculating on how this big trading range may play out over the years, as described in the notes. There was no way to know how things would play out back in 2009, but a big consolidation pattern was one of the possibilities.
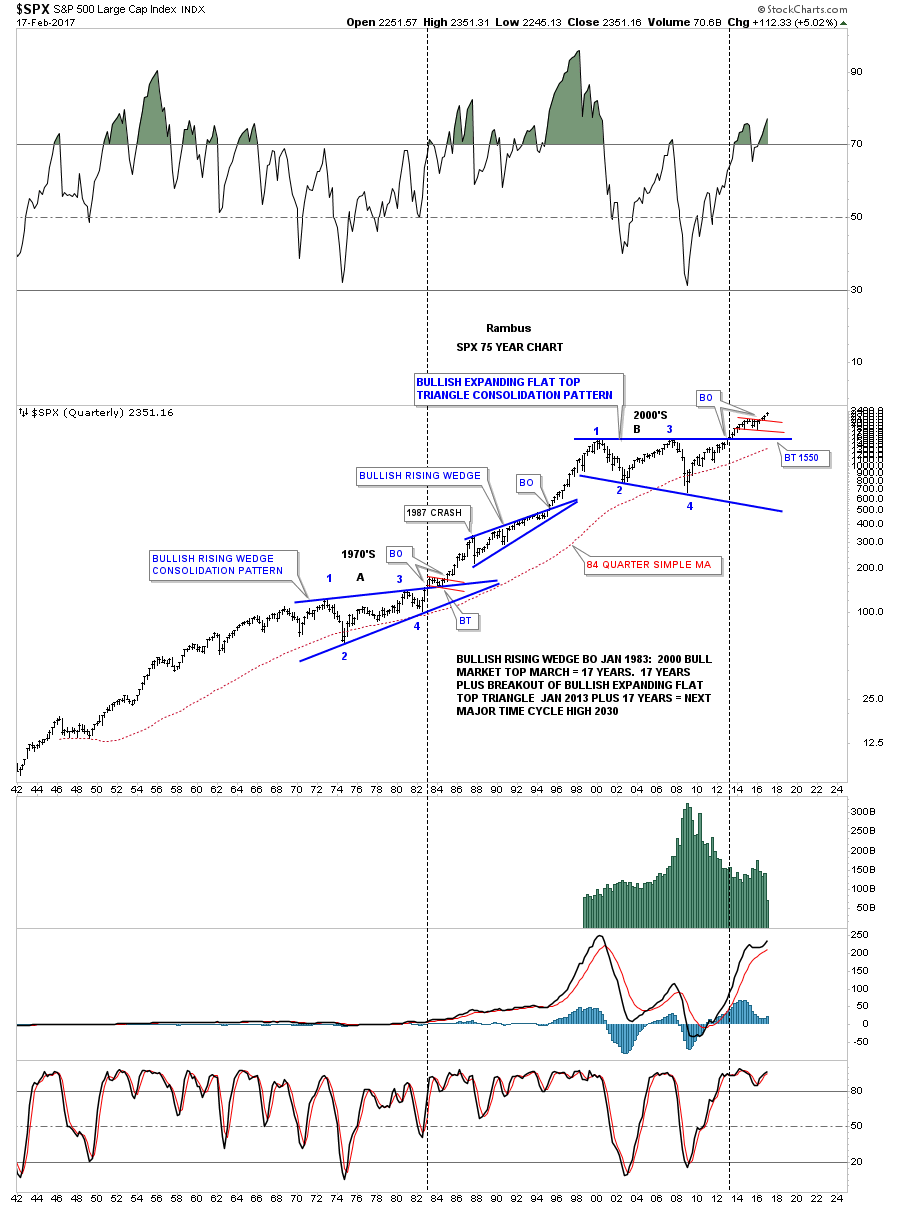
Below is the quarterly chart for the SPX which goes back 75 years and puts the bullish flat top expanding triangle in perspective. There were only 2 times since 1942 that the SPX closed below its 84 quarterly simple moving average. The first time was at reversal point #2 back in 1974, which was the low for the bullish rising wedge. The second time was during the 2009 crash at reversal point #4 in the bullish flat top expanding triangle. At the time the 1987 crash felt like the end of the world and we were going to enter into another 1929 scenario. As it turned out the 1987 crash was just the first reversal point in the bullish rising wedge, which led to a very powerful rally which took the SPX up to its bull market high in 2000.
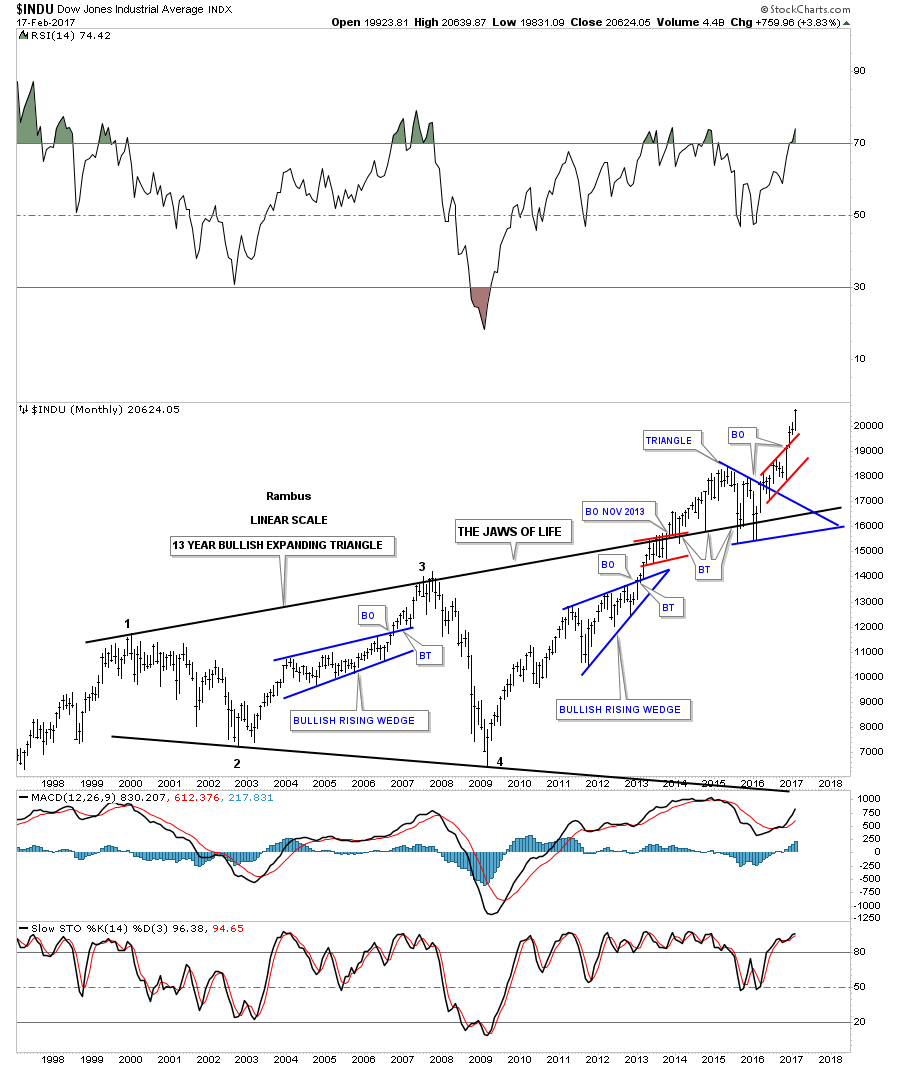
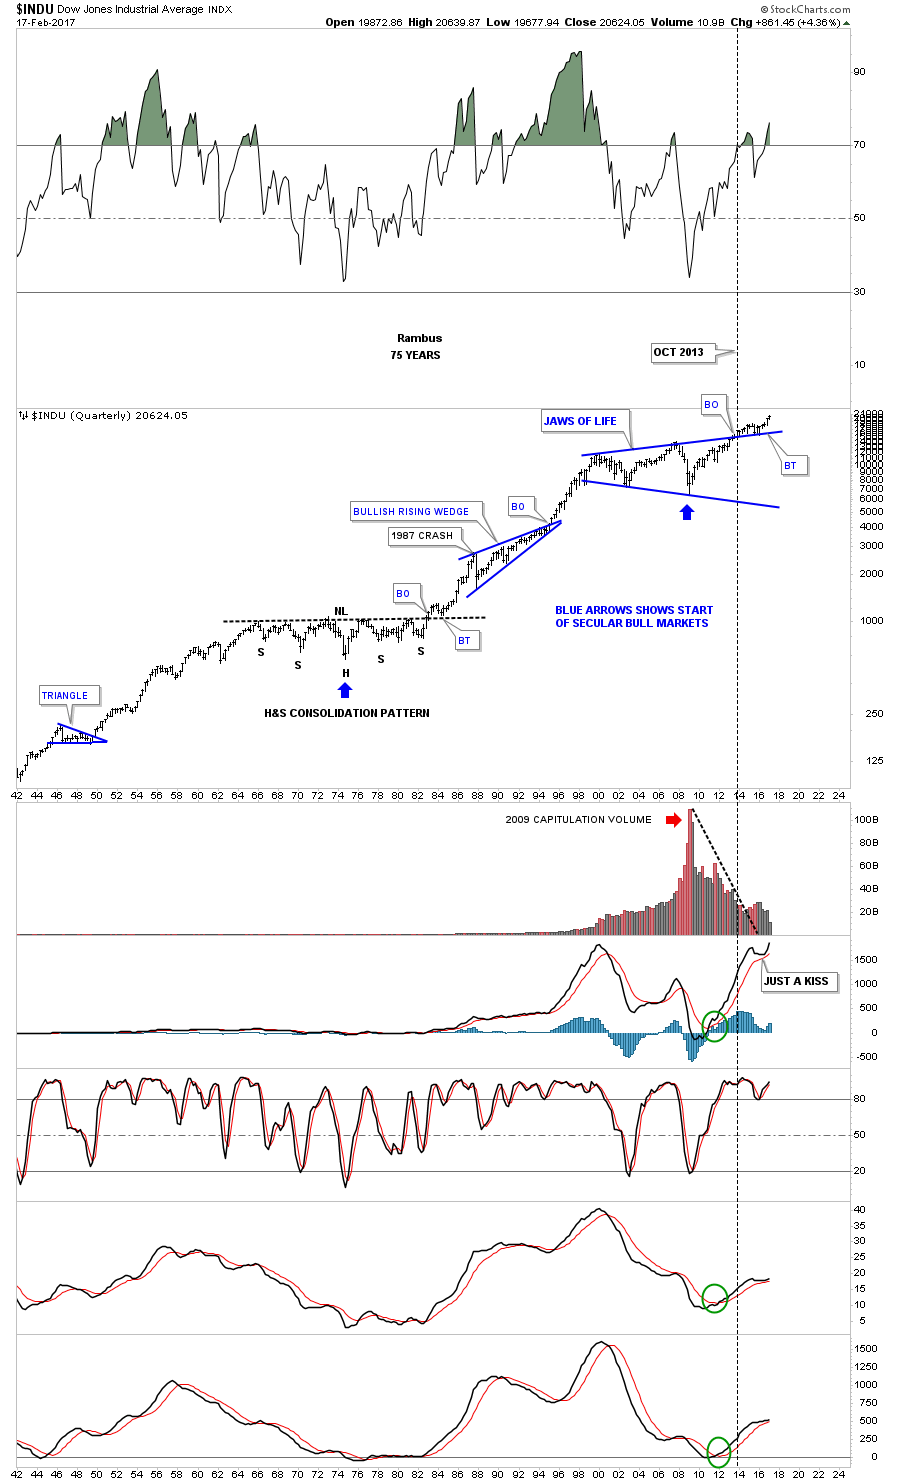
Recognizing a big consolidation pattern before the breakout actually takes place to confirm the pattern can be a double edged sword. In big consolidation patterns like the INDU has, The Jaws of Life, can be very trying. The breakout took place back in mid 2013, but unlike the backtest that only took one month on the SPX chart we looked at earlier, the INDU took its sweet ole time with multiple backtests that took several years to complete. The backtesting process built out the blue triangle consolidation pattern and when the price action broke out above the top rail it confirmed for me the Jaws of Life had finally completed all the work, and the next major bull market was underway.
The 75 year quarterly chart for the INDU puts everything in perspective. Note the breakout and backtesting process out of the 1970s H&S consolidation pattern which only took about 2 years, vs our current breakout and backtesting of the top rail of the expanding triangle, which took about three years before the impulse move is finally gaining some legs. Big patterns equals big moves.
Next lets look at several of the 2009 bull market uptrend channels which shows you what a bull market looks like. Most of the US stock markets have a very nice bull market uptrend channel, but for now I would like to focus in on a couple of the stronger ones that are leading the way higher.
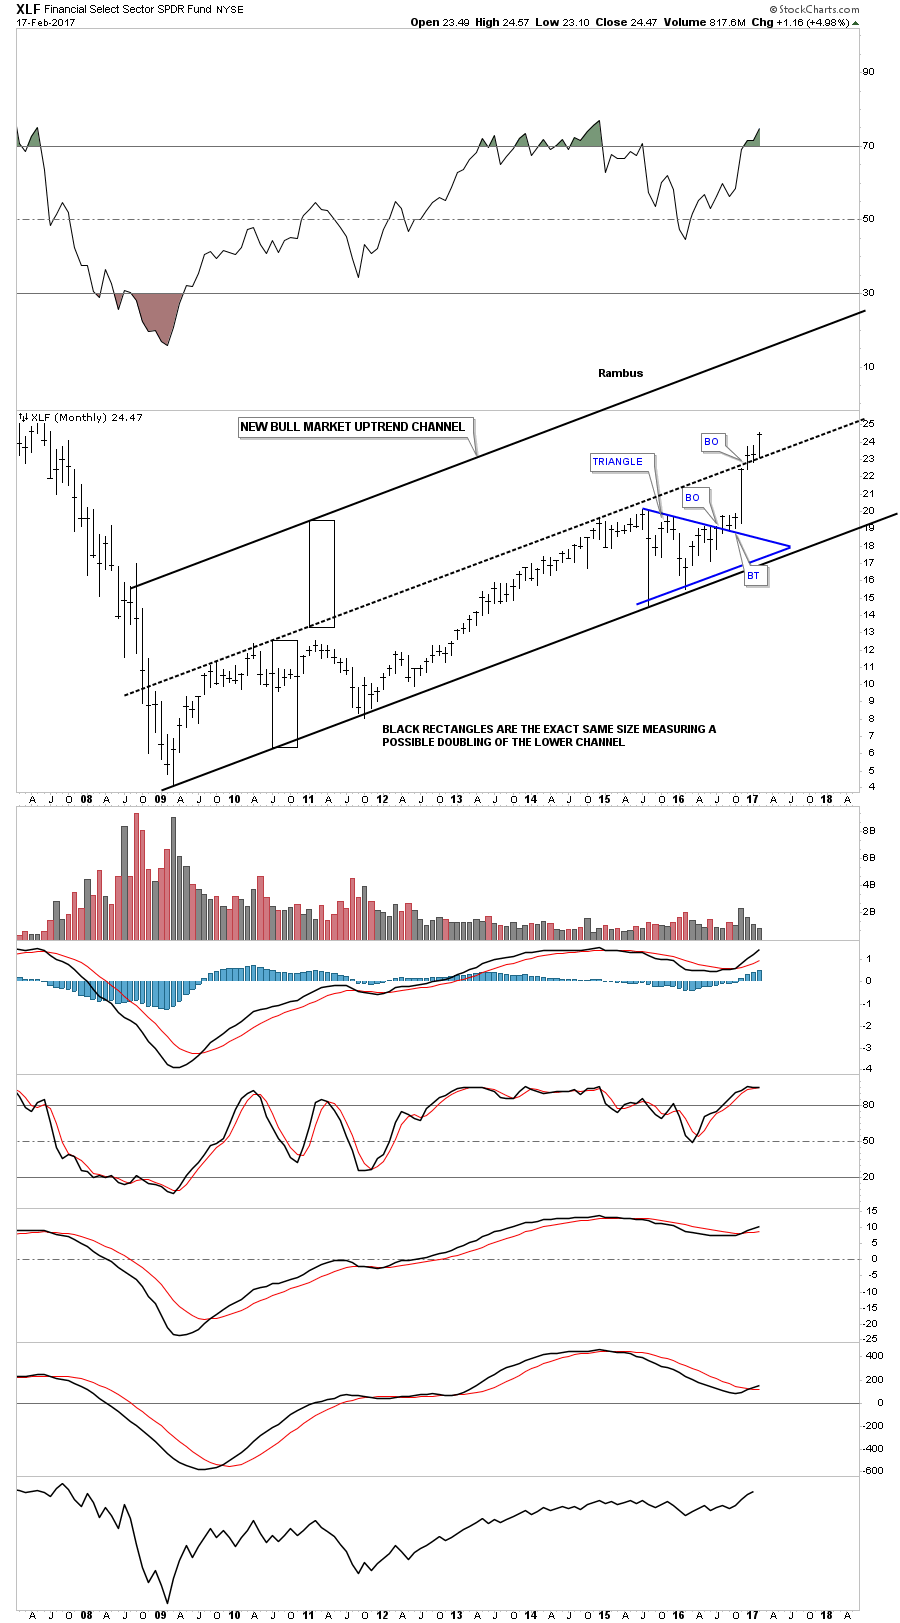
The XLF is a financial sector etf which had built out a very tight uptrend channel out of its 2009 crash low. After breaking out and backtesting the top rail of the blue triangle consolidation pattern, the XLF rallied back up to the top rail of the uptrend channel where it should have stopped to consolidate that move. When you see a nice channel like this and the price action breaks out above the top rail its usually a good sign that the lower channel is going to double in size as shown by the black rectangles. Just like any resistance line, you will see a breakout and a possible backtest before prices move higher in this case.The breakout occurred in December of last year and the backtesting process has been ongoing to the center dashed trendline, which was the top rail of the original uptrend channel. Besides the tech stocks the banking stocks are one of the strongest sectors in the markets right now.
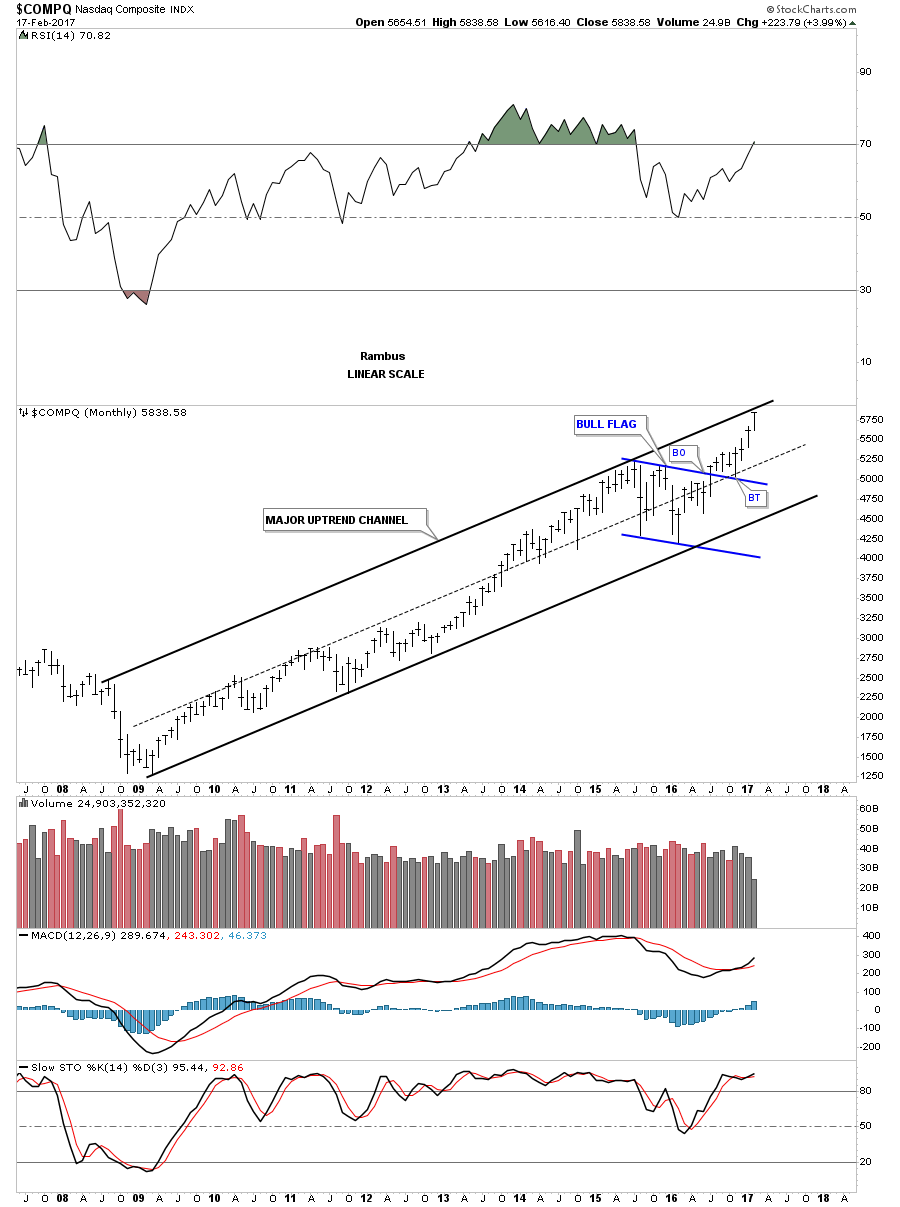
The $COMPQ has formed a nice parallel uptrend channel and is testing the top rail after breaking out from the blue bull flag. This tech index has been very strong recently and Ill be watching the top rail very carefully for a breakout and a possible doubling of the lower channel.
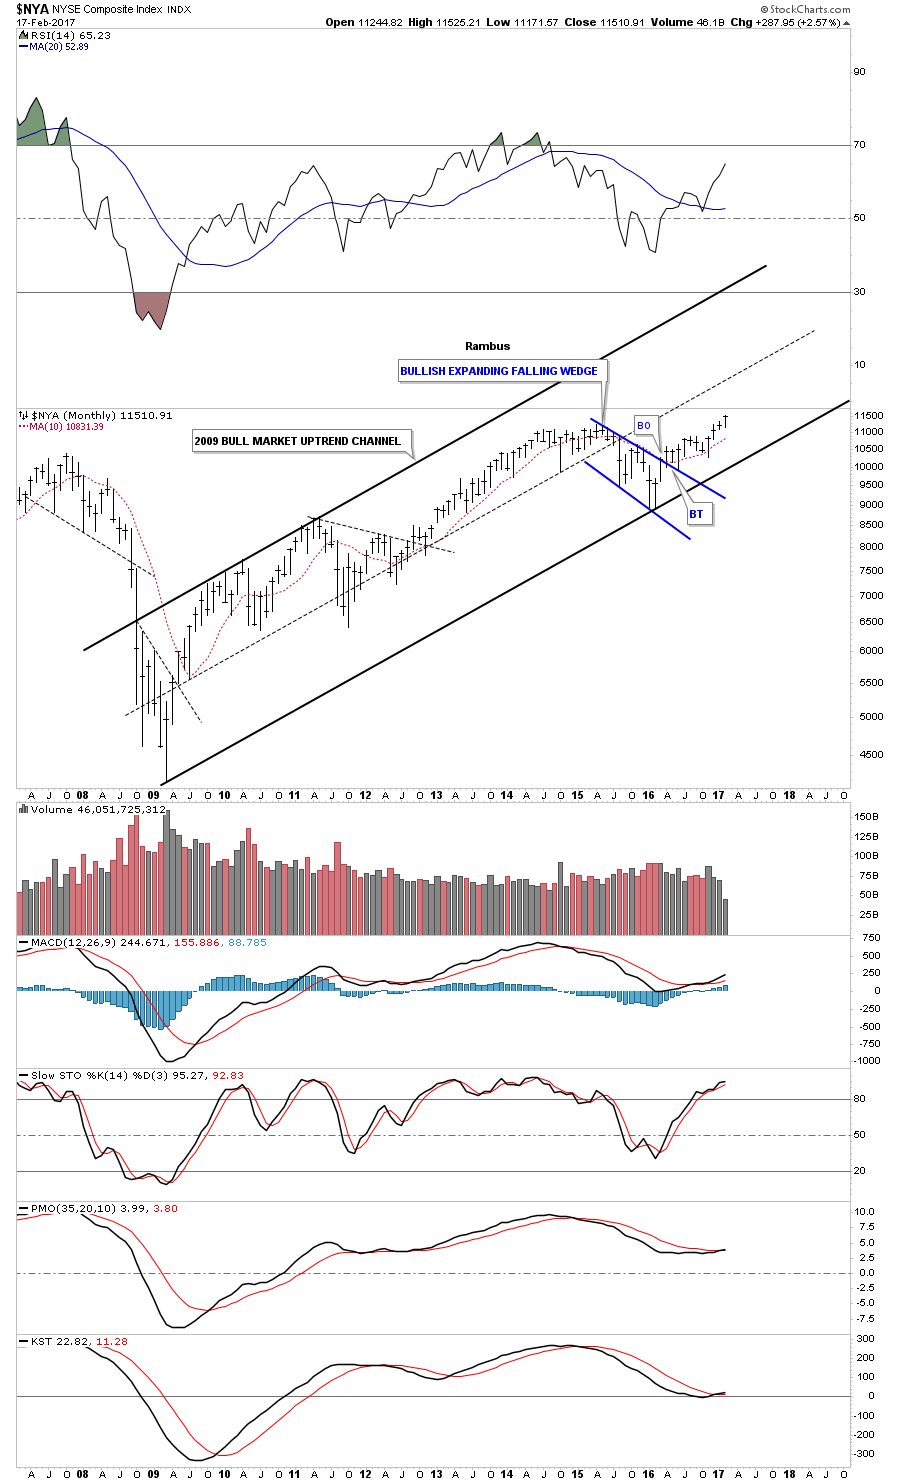
The $NYA is a broad measure of how stocks in general are doing. As you can see its breaking out to new all time highs, but is still way below the top rail of its 2009 uptrend channel.
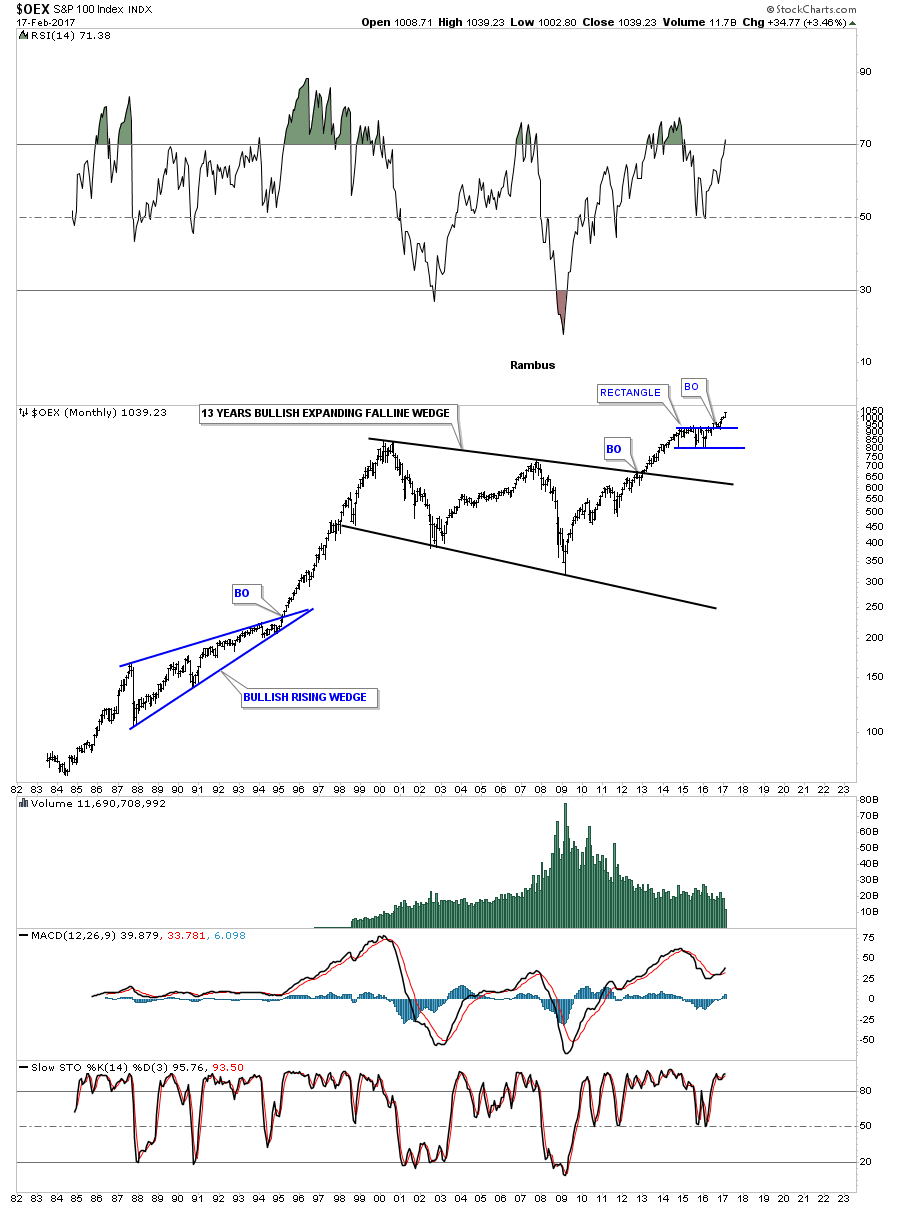
This 35 year monthly chart for the $OEX 100 shows its 13 year bullish expanding falling wedge consolidation pattern.
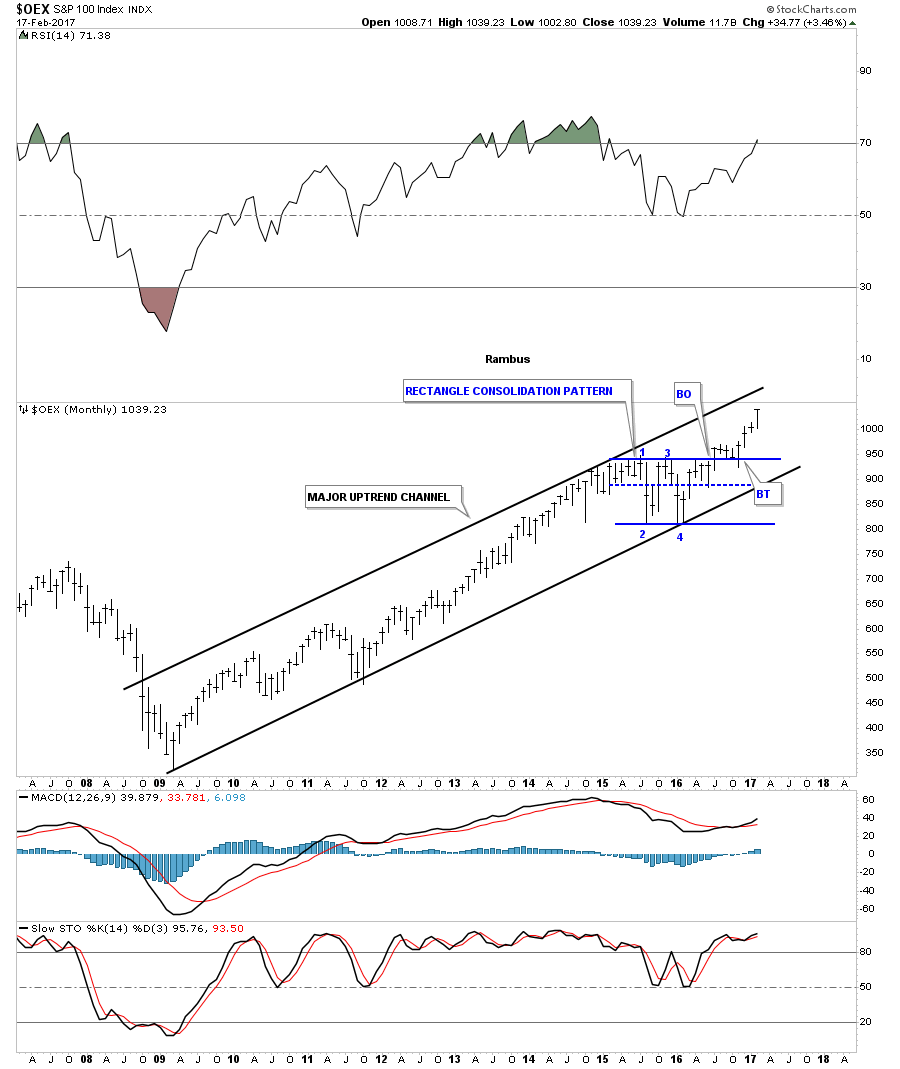
$OEX 100, 2009 bull market uptrend channel.
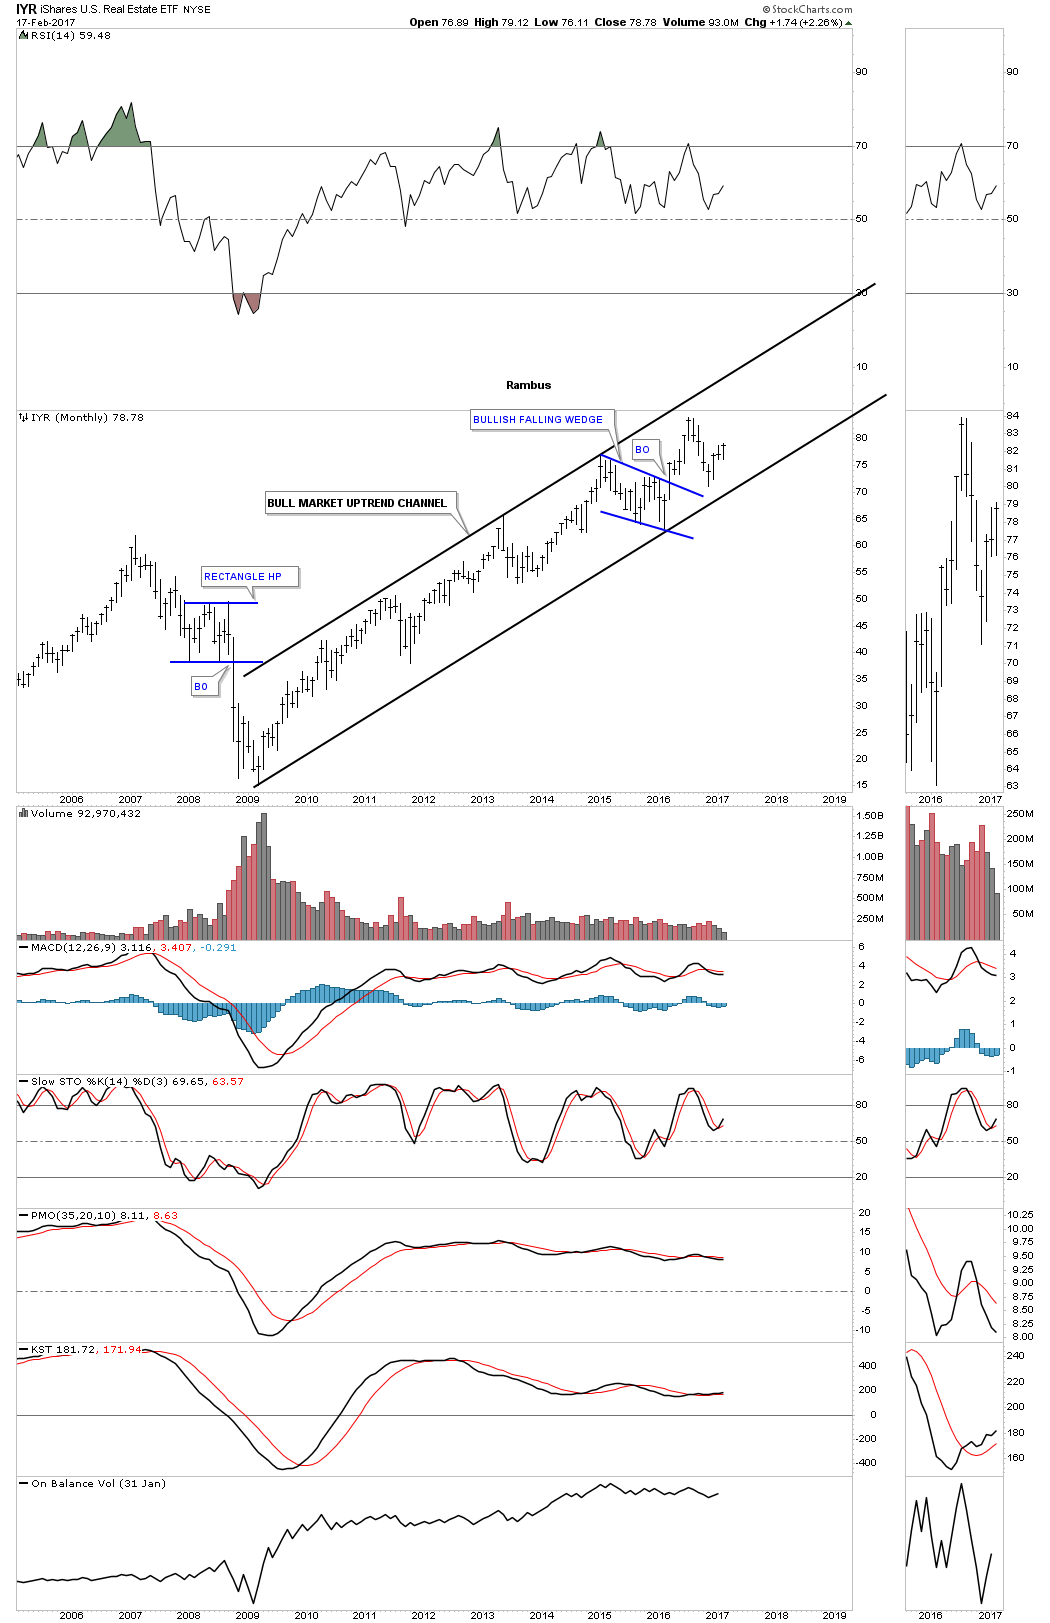
IYR, Real Estate etf.
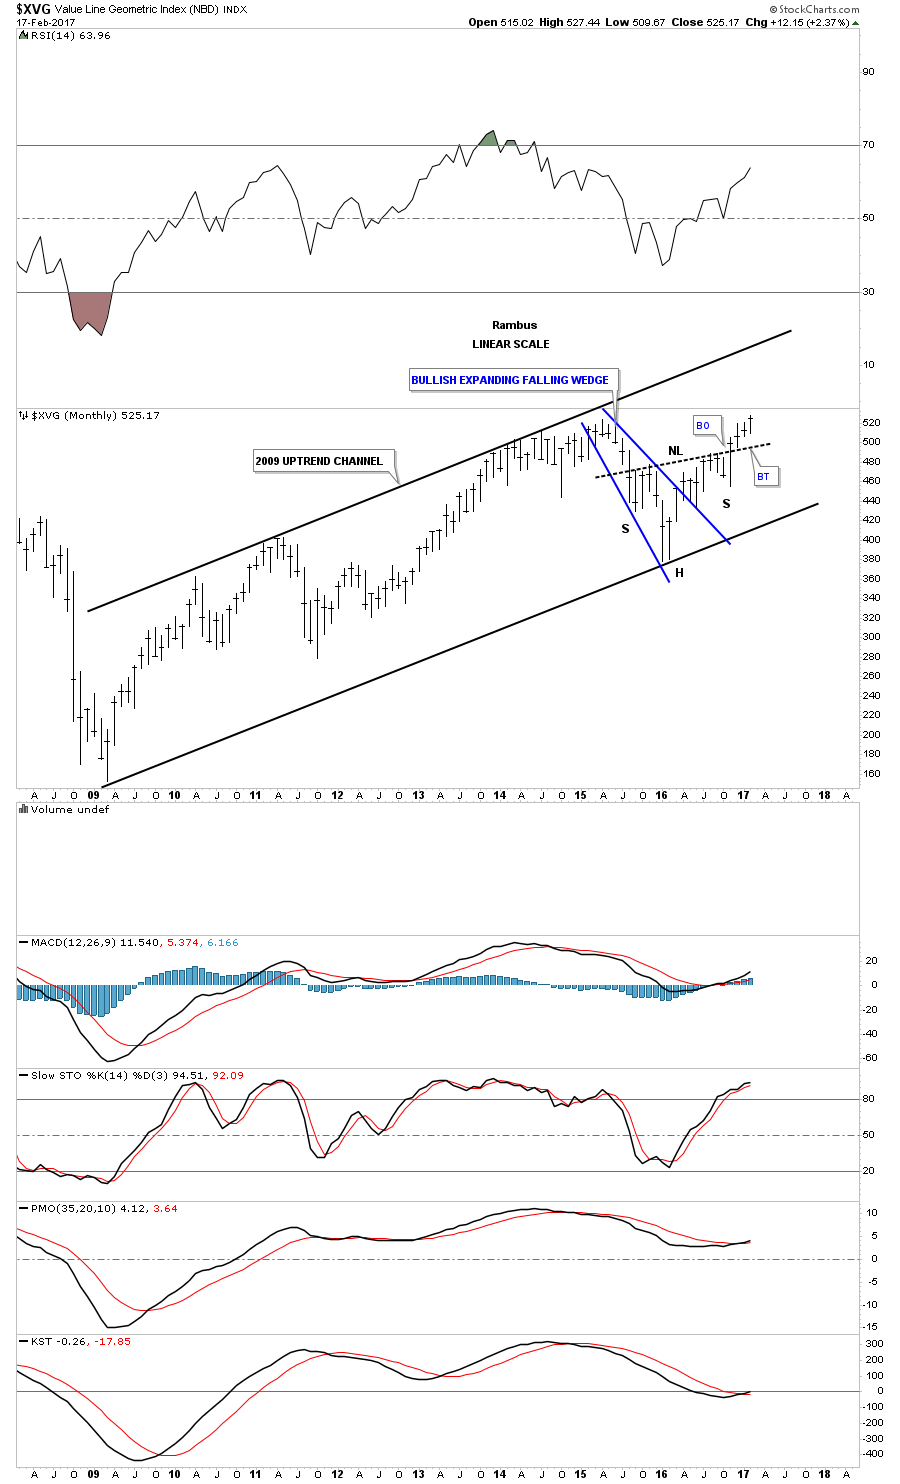
$XVG is another good proxy for how the stock markets are doing in general.
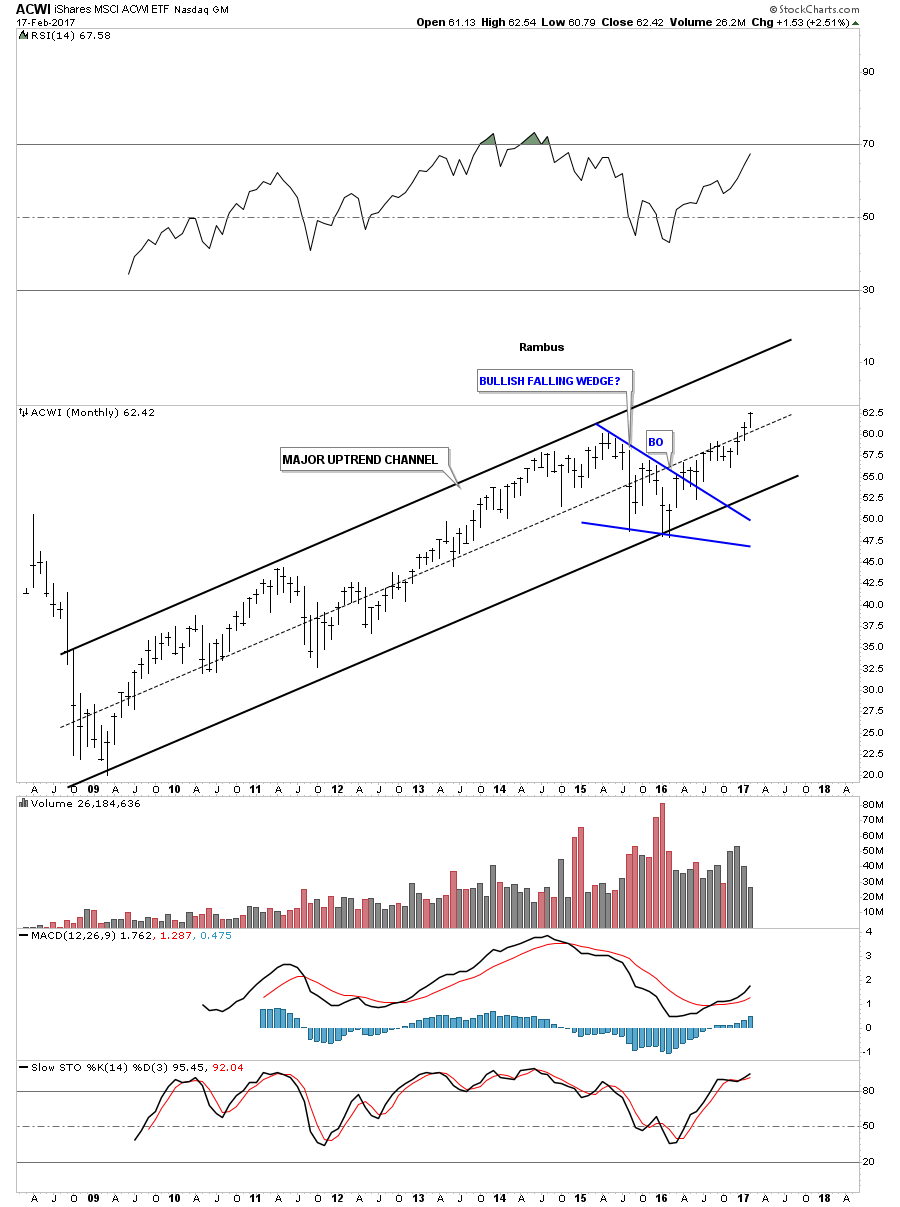
AWCI, all world stock market etf.
VEU, all world stock markets minus the US stock market.

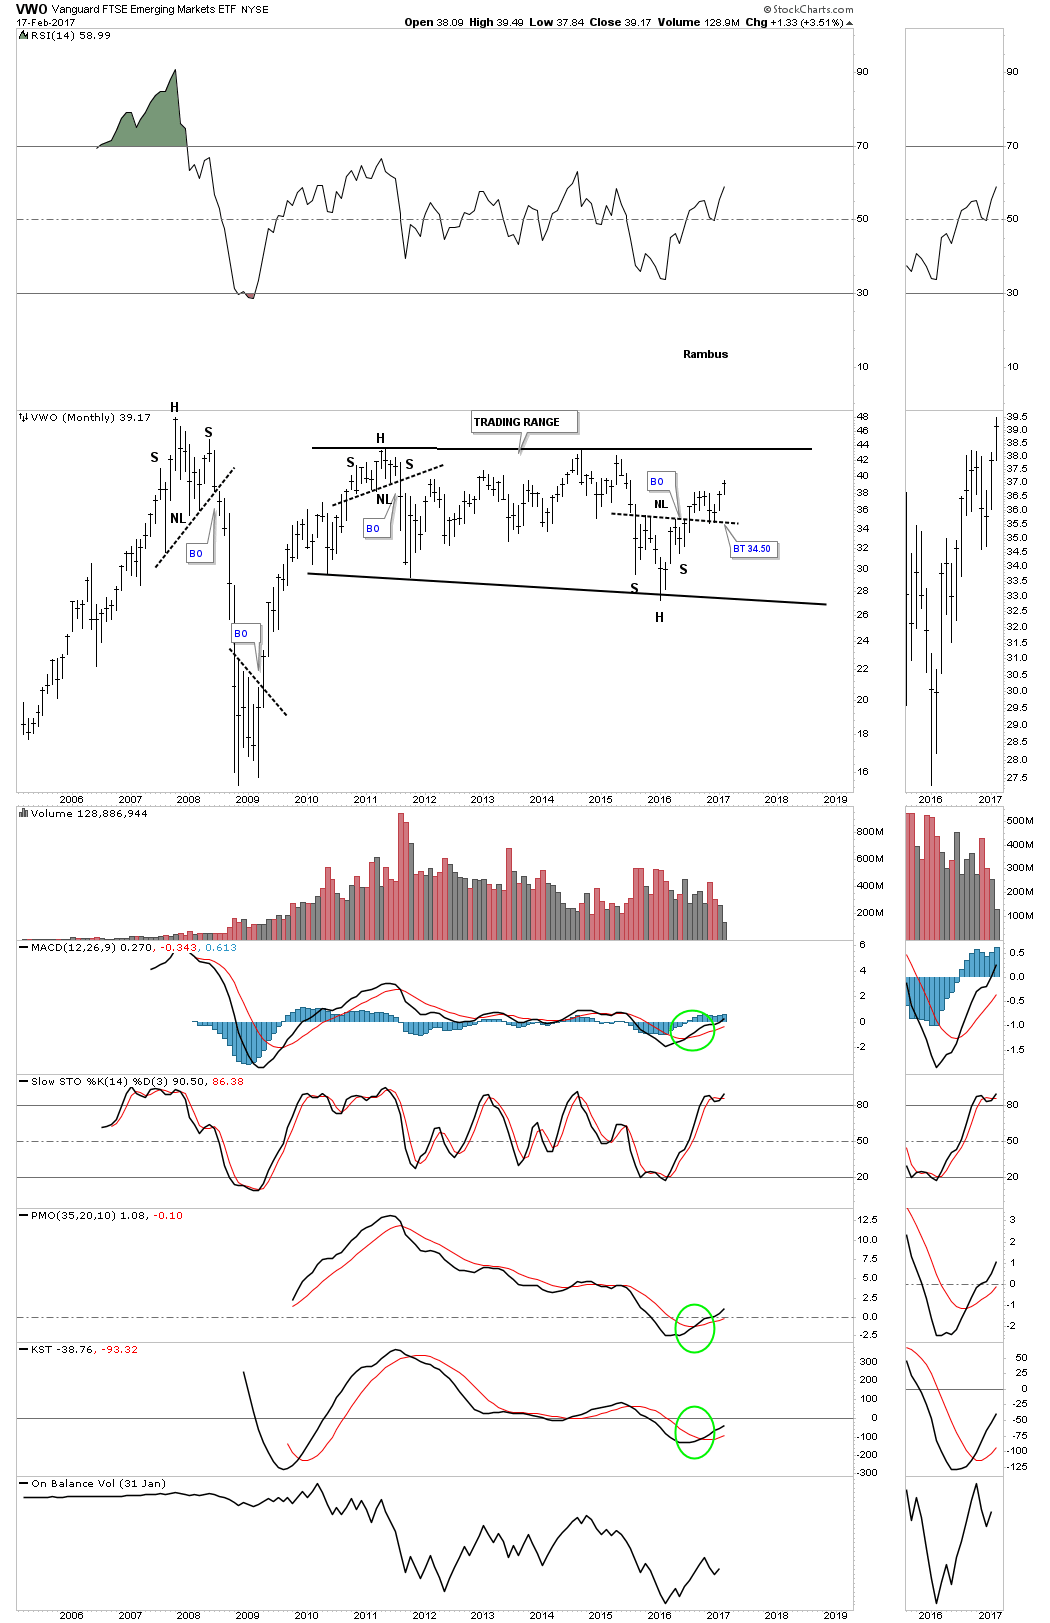
The last chart for tonight is the VWO, emerging markets etf, which is building out a 6 year trading range which still hasnt broken out. If the price action can breakout above the top rail then there is a good chance that the big trading range will be a halfway pattern to the upside.
In the Wednesday Report well look at some individual stocks that have produced some big multi year trading ranges that have broken out and are moving higher. Many of the stocks will be from the tech sector which are household names that were born back in the 1980s and 1990s during the birth of the information age. All the best Rambus