


We sipped the QE juice and loved the taste. Now that were full the game has changed. On August 1, 2007, just before the start of the financial crisis, the Fed had assets worth $858 billion on its books. Fast forward two years to the end of 2009, and the Fed had $2.24 trillion on its books.
Today, it stands at a surreal $4.5 trillion. The Fed printed and bought $1.7 trillion in mortgage bonds, in addition to government bonds. (See Understanding the Federal Reserve Balance Sheet.)
Slowdown, taper, reverse?
I believe we are facing a secular pivot in bonds. After 35 years of one of the greatest bull markets that dropped rates from the mid-teens to near zeroits endgame. Im pretty sure more than a few investors are unaware of the risk this poses. Inflation eats into returns, and who wants to buy your clients 2.4% yielding piece of paper when they can get 4%, 5%, or 6%?
And speaking of 6%, it just might be here in a few short years.
Bloomberg wrote a piece this week entitled, Everyone Is Suddenly Worried About This US Mortgage-Bond Whale. A few highlights:
- Almost a decade after it all began, the Federal Reserve is finally talking about unwinding its grand experiment in monetary policy. And when it happens, the knock-on effects in the bond market could pose a threat to the US housing recovery.
- The talk has prompted some on Wall Street to suggest the Fed will start its drawdown as soon as this year, which has refocused attention on its $1.75 trillion stash of mortgage-backed securities.
- While the Fed also owns Treasuries as part of its $4.45 trillion of assets, its MBS holdings have long been a contentious issuewith some lawmakers criticizing the investments as beyond whats needed to achieve the central banks mandate.
- Yet, because the Fed is now the biggest source of demand for US government-backed mortgage debt and owns a third of the market, any move is likely to boost costs for home buyers.
- In the past year alone, the Fed bought $387 billion of mortgage bonds just to maintain its holdings. Getting out of the bond-buying business as the economy strengthens could help lift 30-year mortgage rates past 6 % within three years, according to Moodys Analytics Inc. (emphasis mine).
The bottom line for bond investors is this: When interest rates rise, bonds lose value.
I shared the next chart in July 2016 (interestingly just two days from the 1.37% low in yields). It shows how much money is lost for every 1% increase in rates. The top section is the 10-year Treasury. The bottom is the 30-year Treasury.
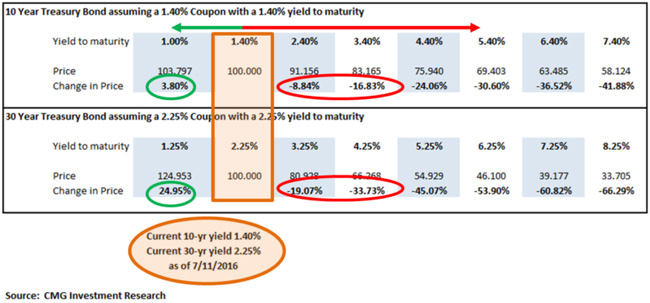
1.37% was the low yield back on July 13, 2016. The 10-year Treasury is currently yielding 2.42%, and the 30-year is yielding 3.02%. That adds up to a -8.84% loss in value for the 10-year and call it a -16% for the 30-year. Maybe rates move back down, but Im not so sure. Im a bit more worried about what those losses will look like when yields rise to 3.4%, 4.4%, and 5.4% (similar to where they were in 2007); -30% is a real risk.
As for equities, the number one rule many of us were taught is dont fight the Fed. I like to add trend into that equation and, as youll see in the next chart, the math is compelling.
When the Fed raises rates (dont fight them) and when the trend turns negative, equities underperform. Focus on the red arrows. Two different time periods are measured, however, the message is the same. The big corrections come when both the Fed and the trend turn negative. I wrote some time ago in OMR to watch out for -2. We currently sit at -1. Ill share this chart from time to timeespecially if -2 is triggered.
Here is how you read the chart:
- The top section plots the S&P 500 Indexbut focus on the middle section.
- NDR has a Multi-Cap Tape Composite Model to measure the technical health of the broad equity market. That model aggregates the signals of over 100 component indicators and generates a signal based on the percentage of the component indicators that are giving a bullish signal for the S&P 500. It measures momentum and trend.
- The Fed component is really an interest rate component, which measures the trend in rates by looking at the yield on the 10-year Treasury note. When the 10-week trend in yields are lower than their 70-week trend in yields, the S&P 500 has produced larger gains. When it is higher, the S&P 500 has performed poorly. Its that simple.
- The combined indicator can produce a score of -2 (both indicators are bearish) to +2 (both bullish) and overall have done a good job historically as a risk-on/risk-off indicator.
The current reading is -1 (data shows we need to watch out for -2): refer to the red arrows.
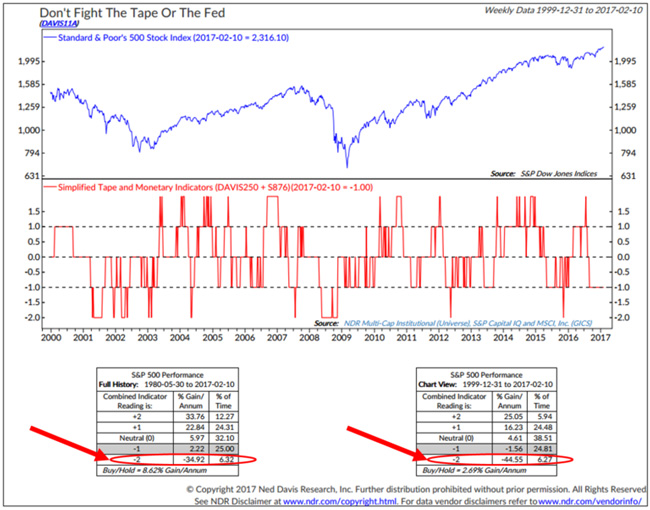
Source: Ned Davis Research
Inflation pressures are high both here and in Europe. The Feds 2% inflation target was achieved in January. Janet Yellens unemployment target has long been met. She was on stage this past week where she said the Feds main tool for setting monetary policy will remain the Fed Funds rate. They will not shrink their $4.5 billion balance sheet right now, but will likely reduce it over time. Thats going to be very tricky to accomplish. For now, Yellens Fed will keep reinvesting the proceeds from maturing Treasuries and mortgage-backed securities to maintain accommodative conditions.
It is going to be hard for us to stop sipping the Kool-Aid. The markets remain addicted to the juice, and the doctor continues to push the product. My personal view is that the Fed monetizes the debt and it evaporates away. However, I dont believe the current structure of laws allows for this, so lets put that in the back of our minds for another day.
My stepson, Conner, is a Wikipedia stat man. I often call him Rain Man due to his amazing memory. I wish I had his quick recall. Anyway, on the way to school this morning, we were talking about the stock market (he owns Bristol-Myers Squibb and hes happy with the move of late).
Out of nowhere, Conner said, The time to buy is when theres blood in the streets. Hes fascinated with the stories behind some of the worlds wealthiest people. He went on to tell me about Baron Rothschild, the 18th century banker that made a fortune buying in the panic that followed the Battle of Waterloo against Napoleon. Blood in the streets is one of Rothschilds famous quotes. It seemed apropos for today.
Im keeping one eye on the Fed, the other on trend, and mentally preparing myself for a Baron Rothschild/Sir John Templeton like moment. Its not now, but I told Conner the buying opportunity of his lifetime is coming.
That potential remains ahead. Blood in the streets? The end of the great debt super cycle? Probable, in my view. Three to five years? Maybe sooner? I dont know. As the great Stan Druckenmiller commented a few years ago Fed policy is, fraught with unappreciated risk.
Read the original article on CMG Wealth. Copyright 2017.


