

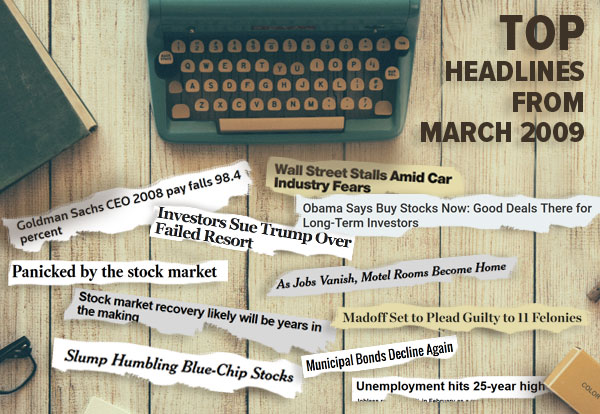
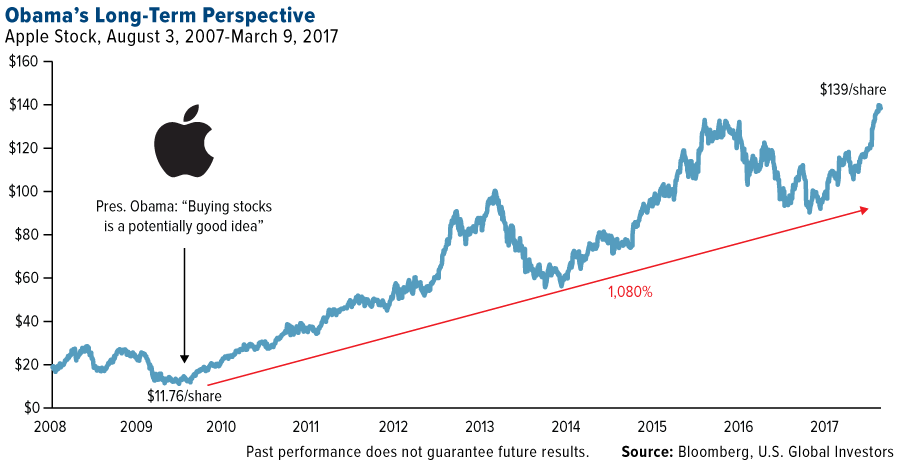
Eight years ago last week, President Barack Obama gave investors a surprisingly hot trading tip. In office less than two months, he commented that we were at the point where buying stocks is a potentially good deal if youve got a long-term perspective.
Obama couldnt have known then how accurate his call was. The market found a bottom that very week, and investors who took the presidents advice managed to get in on the absolute ground floor.
At the time, investor sentiment was at or near record lows. The number of S&P 500 Index stocks trading below $10 a share had grown tenfold since the end of 2007. The New York Stock Exchange, in fact, had to temporarily suspend its requirement that equities trade at more than $1 a share. Giant companies such as Citigroup and General Motorsa share of which cost little more than a pocketful of spare changewere at risk of being delisted.
Today, many of those bullish investors have seen some spectacular gains. Since its low of 666 in March 2009, the S&P 500 has climbed a whopping 260 percent, with not a single year of losses. The average annual return has been over 15.7 percent, based on Bloomberg data. With dividends reinvested, its closer to 18 percent.
Just take a look at Apple, which has surged more than 1,080 percent as it introduced or expanded its line of got-to-have, now-ubiquitous products, from the iPhone to iPad.
To show you just how far weve come, I put together a few comparisons of several indices and economic factors between March 2009 and now.
| March 2009 | Most Recent Data, March 2017 | Percent Change | |
|---|---|---|---|
| S&P 500 Index | 666.79 (intraday low, March 6) | 2,400.98 (intraday high, March 1) | 260% |
| Dow Jones Industrial Average | 6,440.08 (intraday low, March 9) | 21,169.11 (intraday high, March 1) | 228% |
| University of Michigan Consumer Sentiment Index | 69.5 | 96.3 | 38% |
| U.S. ISM Manufacturing Purchasing Managers Index (PMI) | 35.8 | 57.7 (February) | 61% |
| Housing Starts | 505,000 | 1,290,000 | 155% |
| Light Vehicle Sales | 9,552,000 | 17,465,000 | 83% |
| Unemployment | 8.7% | 4.7% (February) | -45% |
| Gold | $885 (intraday low, March 18) | $1,248.30 (intraday high, March 1) | 41% |
| Sources: S&P Dow Jones Indices, Bureau of Economic Analysis, University of Michigan, Bureau of Labor Statistics, Census Bureau, ISM, IBA | |||
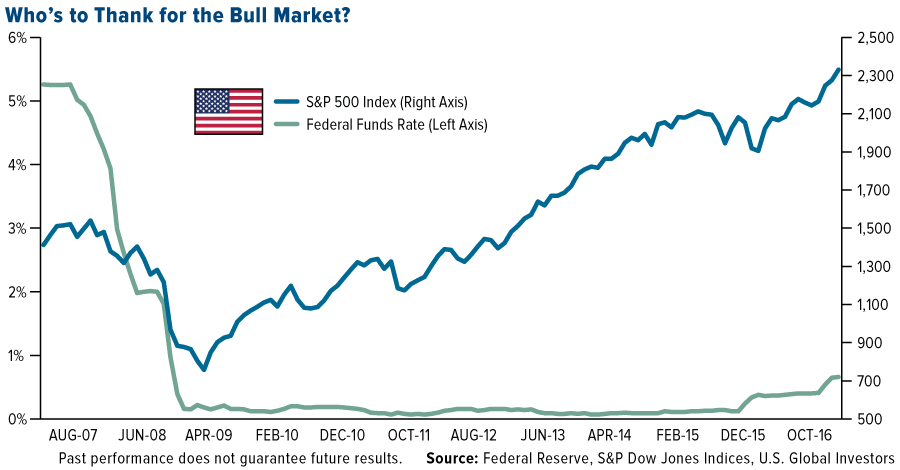
Of course, there have been market skeptics. As others have pointed out, this particular bull runthe second-longest in U.S. historyhas arguably been the least loved, with many investors calling it artificial and arguing that its been driven not by fundamentals but the Federal Reserves policy of record-low interest rates.
Now there are those who wonder how much longer this bull run can last. And if it ends, will it be with a bang or a whimper?
Trump Rally Could Have Further Room to Grow
Its important to keep in mind the old investing adage, Bull markets dont die of old age. Bear markets have been incited by everything from geopolitical conflicts to stagflation to oil price shocks to financial crises. Although no one can say with all certainty that age is irrelevant in a markets longevity, there are signs that the current eight-year-old run has further room to grow, at least in the short term.
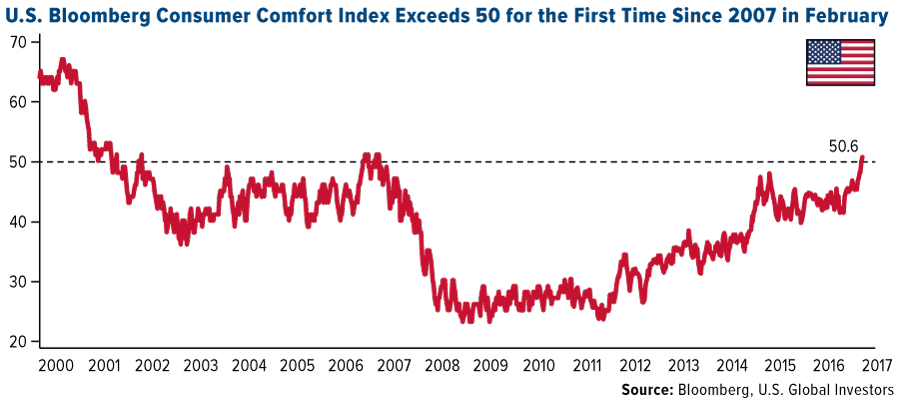
President Donald Trumps pro-growth policy proposals, including lower corporate taxes, deregulation and infrastructure spending, have jolted many peoples animal spirits, with several indices already hitting near-record highs. In January, the Index of Small Business Optimism posted a reading unseen since 2004, as I shared with you earlier. More recently, the Bloomberg Consumer Comfort Index, which measures American consumers views on the U.S. economy and their personal finances, climbed to 50.6, the first time its exceeded 50 in a decade. Note how few times its risen above that level in the past 17 years.
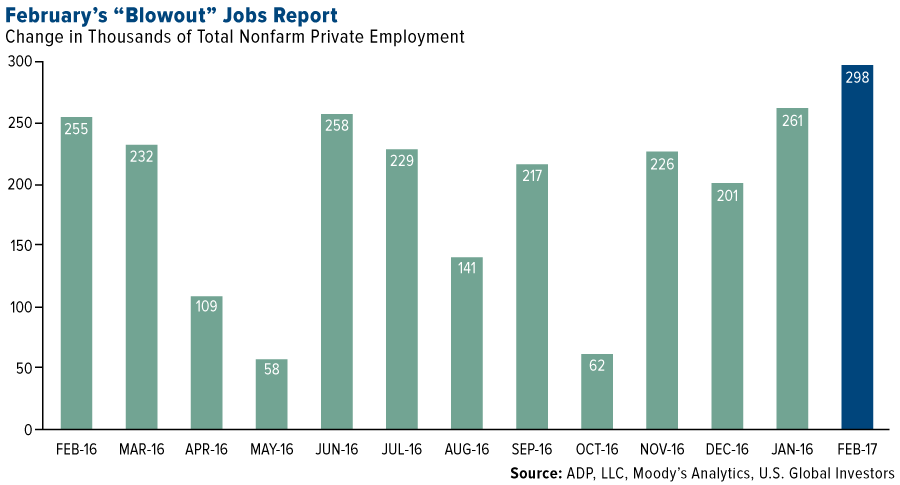
And of course theres the booming jobs market. Following the record 75 straight months of jobs creation under Obama, employers continue to ramp up their rate of hiring even more, indicating a rosy financial and economic outlook. Despite candidate Trumps tendency to question the validity of encouraging jobs reports before the election, President Trump now has much to brag about in his first full month in office.
According to the Bureau of Labor Statistics (BLS), the U.S. added a phenomenal 235,000 jobs in February, with gains made in construction, manufacturing, mining, educational services and health care. The report indicated that mining added 8,000 positions during the month, 20,000 in total since a recent low in October, just before the election. This shows executives confidence in Trump, who pledged to revive the industry by eliminating job-killing regulations.
Another recent report was even more generous than the BLS. The ADP National Employment Report showed U.S. employment increasing by nearly 300,000 from January to February. Medium-size businessesthose with between 50 and 499 employeesexpanded the most, adding 122,000 positions.
Gold historically has fallen on better-than-expected jobs reports, but I was happy to see that it actually gained on Friday after eight days of losses. The yellow metal held above $1,200 an ounce, even as it becomes more and more certain that interest rates will be hiked this month.
Valuations High, but Good Deals Can Still Be Found
Some investors right now might be discouraged by high stock valuations. Although its true certain sectors are beginning to look expensiveinformation technology is currently trading at more than 23 times earnings, real estate at 43 times earnings and energy at a whopping 113 times earningsthere are still some attractive deals.
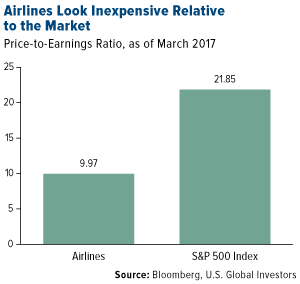 |
Among them is the airlines industry, which as of today has a very reasonable price-to-earnings ratio of 9.97. At 21.85, the S&P 500 is more than twice as expensive.
This is one of the many reasons why billionaire investor Warren Buffett is bullish on airlines, which he once called a death trap for investors. Not only did his holding company Berkshire Hathaway purchase shares of the four big domestic carriersAmerican, United, Delta and Southwestbut it dramatically expanded those holdings in the fourth quarter, according to regulatory filings. Now theres even speculation that Buffett and Berkshire Hathaway could be planning to acquire one of these four carriers outright, with Morgan Stanleys Rajeev Lalwani writing that Southwests domestic focus, robust and sustainable free cash flow, range of growth opportunities, defensible cost structure and more tenured management team make it a logical candidate.
Some links above may be directed to third-party websites. U.S. Global Investors does not endorse all information supplied by these websites and is not responsible for their content. All opinions expressed and data provided are subject to change without notice. Some of these opinions may not be appropriate to every invest.
The Dow Jones Industrial Average is a price-weighted average of 30 blue chip stocks that are generally leaders in their industry. The S&P 500 Stock Index is a widely recognized capitalization-weighted index of 500 common stock prices in U.S. companies. The University of Michigan Confidence Index is a survey of consumer confidence conducted by the University of Michigan. The report, released on the tenth of each month, gives a snapshot of whether or not consumers are willing to spend money. The ISM manufacturing composite index is a diffusion index calculated from five of the eight sub-components of a monthly survey of purchasing managers at roughly 300 manufacturing firms from 21 industries in all 50 states. The Small Business Optimism Index is compiled from a survey that is conducted each month by the National Federation of Independent Business (NFIB) of its members. The Bloomberg Consumer Comfort Index is a weekly, random-sample survey tracking Americans' views on the condition of the U.S. economy, their personal finances and the buying climate.
Holdings may change daily. Holdings are reported as of the most recent quarter-end. The following securities mentioned in the article were held by one or more accounts managed by U.S. Global Investors as of 12/31/2016: American Airlines, United Continental Holdings, Delta Air Lines, Southwest Airlines.


