Today, gold broke a nearly six year-long downward sloping trend line that goes back to its all-time high of $1921 in August of 2011. Gold has not managed to cross above this trend line, currently at around $1280, since then, although it has come close a number of times including as recently as last April.
Today's breach of this trend line is likely significant; historically, breaking above a five year long downward sloping trend line has signalled major bull market moves in gold (30% or more) including 2001, 1993 and 1985.
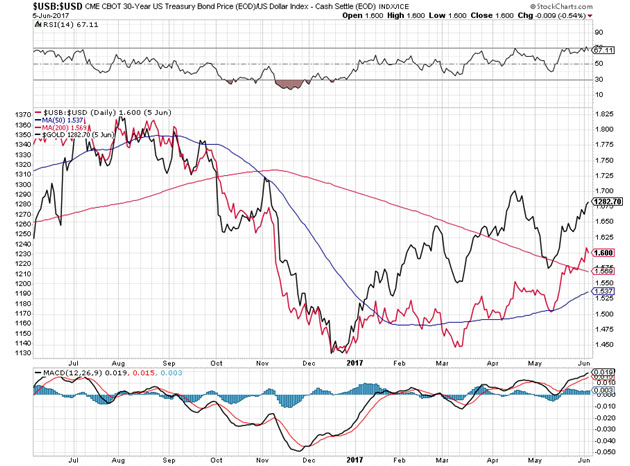
One of the better indicators for gold is the ratio of the price of the U.S. 30 year Treasury bond to the U.S. Dollar Index. Gold rises and falls with this ratio because it encapsulates two important factors driving the gold price. When the dollar is falling while the bond is rising (and rates are falling), as we see currently, gold tends to rise. A strengthening dollar and rising yields—as we saw after the Trump election—generate a headwind for gold. Here is a one year chart of the daily ratio. The red line is the ratio and the black line is the gold price.

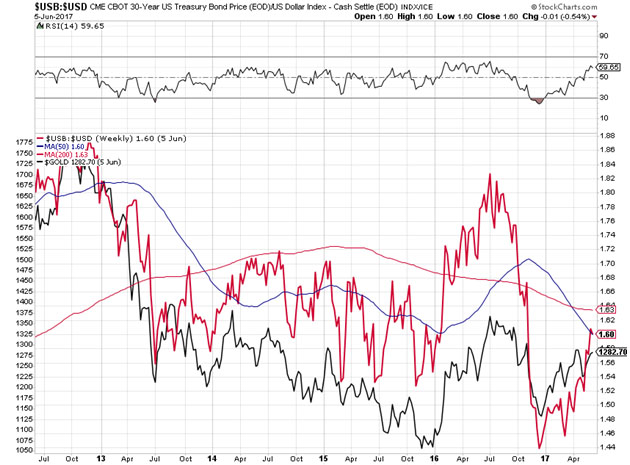
A five year weekly chart shows that the correlations have remained strong over an extended period.

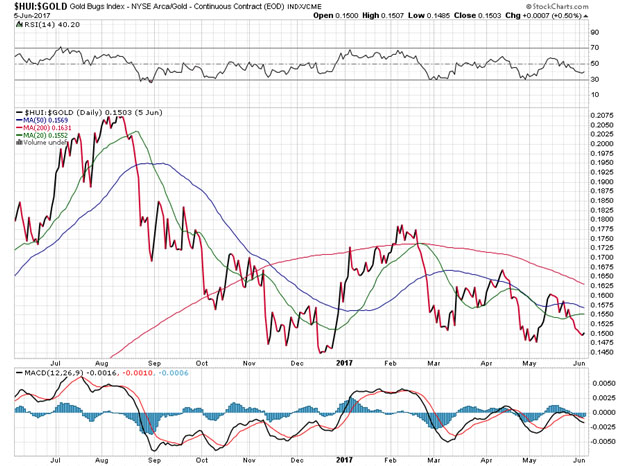
The next confirming step of a break out would be to see gold stocks outperform gold. Gold stocks have been conspicuous non-performers of late; as gold has stealthily risen, the gold stocks have been very lethargic, as noted below in this daily one year chart of the ratio of the HUI gold stock index to the gold price.

This article is the collaboration of Rudi Fronk and Jim Anthony, cofounders of Seabridge Gold, and reflects the thinking that has helped make them successful gold investors. Rudi is the current Chairman and CEO of Seabridge and Jim is one of its largest shareholders. The authors are not registered or accredited as investment advisors. Information contained herein has been obtained from sources believed reliable but is not necessarily complete and accuracy is not guaranteed. Any securities mentioned on this site are not to be construed as investment or trading recommendations specifically for you. You must consult your own advisor for investment or trading advice. This article is for informational purposes only.
Disclosures:
1) Statements and opinions expressed are the opinions of Rudi Fronk and Jim Anthony and not of Streetwise Reports or its officers. The authors are wholly responsible for the validity of the statements. Streetwise Reports was not involved in any aspect of the content preparation. The authors were not paid by Streetwise Reports LLC for this article. Streetwise Reports was not paid by the authors to publish or syndicate this article.
2) Seabridge Gold is a billboard sponsor of Streetwise Reports. Streetwise Reports does not accept stock in exchange for its services. Click here for important disclosures about sponsor fees. The information provided above is for informational purposes only and is not a recommendation to buy or sell any security.
3) This article does not constitute investment advice. Each reader is encouraged to consult with his or her individual financial professional and any action a reader takes as a result of information presented here is his or her own responsibility. By opening this page, each reader accepts and agrees to Streetwise Reports' terms of use and full legal disclaimer. This article is not a solicitation for investment. Streetwise Reports does not render general or specific investment advice and the information on Streetwise Reports should not be considered a recommendation to buy or sell any security. Streetwise Reports does not endorse or recommend the business, products, services or securities of any company mentioned on Streetwise Reports.
Charts provided by the authors.


