-- Published: Sunday, 11 June 2017 | Print | Disqus
By: Jordan Roy-Byrne CMT, MFTA
Traders and investors noted and celebrated Golds alleged breakout from a its downtrend that began in 2011. Tuesday Gold closed at $1297/oz after nearly touching $1299/oz. Gold appeared to break its downtrend on the many charts that made the rounds. However, upon further inspection, there was no breakout from the 6-year downtrend on the weekly chart nor is Gold likely to sustain its strength in the days ahead.
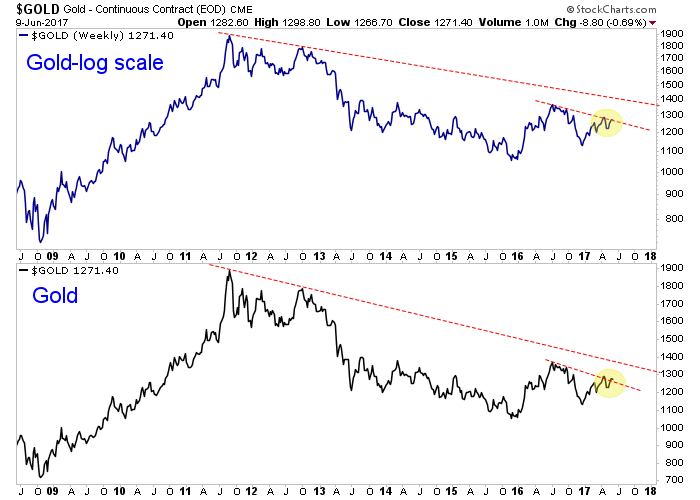
First, lets take a look at Golds weekly line chart on both a log scale and normal scale. Weekly charts are more significant than daily charts. We can see (in the following chart) that Gold has not come close to breaking the downtrend line that began in 2011. That trendline resistance comes into play at much higher levels. Gold has appeared to break the trendline resistance from the 2016 highs but it could prove to be a false breakout if Gold cant close above $1300/oz.
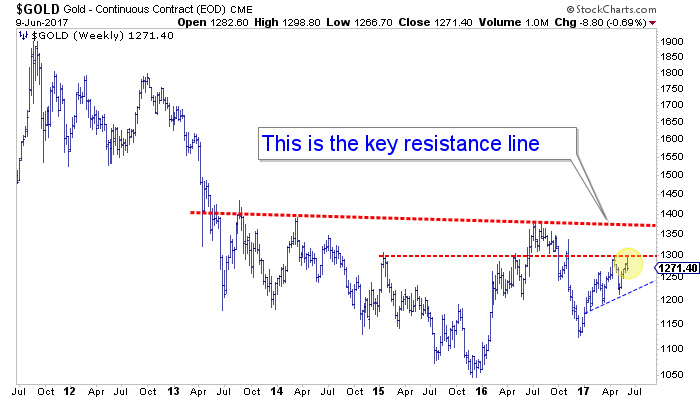
There are two things to highlight in the next chart. First, on the weekly chart we can see that Gold closed the week well off its high of the week. A bar or candle chart shows a weekly reversal. Gold closed the week below its April closing high and even below last weeks close! Second, the real important resistance for Gold is not the trendline from the 2011 peak but $1300/oz as well as the peaks from 2013 and 2014 when Gold began its attempt to bottom. Gold will only be in the clear when it can takeout $1350-$1375/oz.
The miners certainly arent supporting the bullish case for Gold. Both GDX and GDXJ have made lower highs since January and by weeks end they erased all the gains from Tuesdays surge. Their negative divergence to Gold remains well intact.
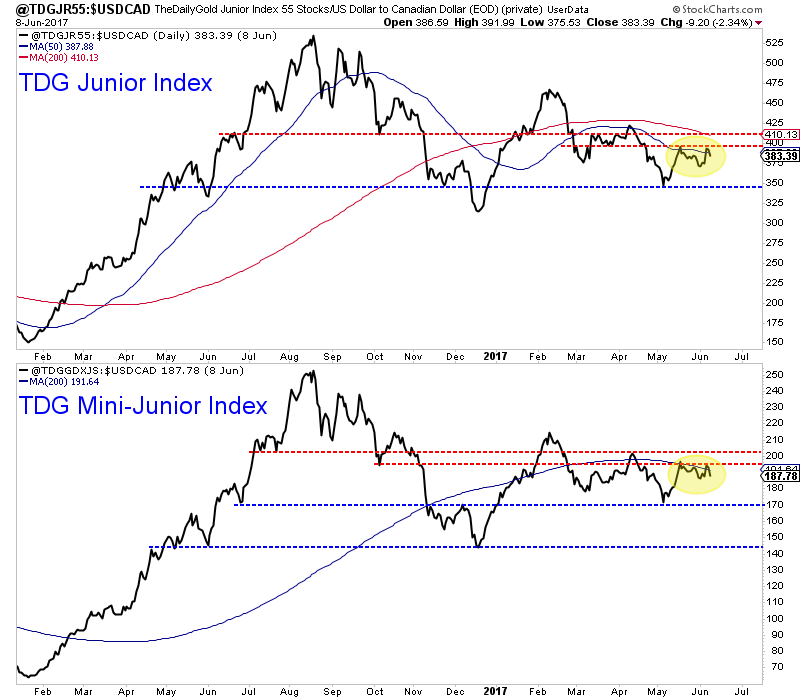
Meanwhile, in the charts below we focus on the junior sector, which is our preferred sector for investment. TDG Junior Index is an index of 55 junior companies. Over the past few months this index has failed thrice at a declining 50-day moving average. If the index cannot takeout Tuesdays high then it is at risk of falling at least 10% to its May low. TDG Mini Index highlights the bottom half of the index which has been the strongest part of the junior sector. This index failed at its 200-day moving average in April and has failed at the now declining 200-dma thrice in the last few weeks.
Golds failure at $1300 and weekly reversal have nullified any apparent breakout on the daily chart. Moreover, some traders and investors are neglecting the more important resistance levels of $1300/oz and the $1350-$1375/oz which stem from the 2013 and 2014 tops. The weekly reversal in Gold coupled with the continued poor performance from the gold stocks suggests a real breakout in Gold is not yet in the cards. The positive aspect is this failed breakout could lead to a selloff and ultimately lower risk entry points in a number of juniors. We will exercise caution and patience as we expect metals and miners to trend lower in the days and weeks ahead.
Jordan Roy-Byrne, CMT, MFTA
TheDailyGold.com
| Digg This Article
-- Published: Sunday, 11 June 2017 | E-Mail | Print | Source: GoldSeek.com


