-- Published: Friday, 16 June 2017 | Print | Disqus
By: Ira Epstein
Its been a while since Ive written a Gold Report, due to my finding it so much easier to produce Daily Metal Videos where you see live charts.
However, I want to keep my writing skills up and realize that not everyone likes to watch videos so heres a Gold Report that deals with the longer term view. As you read the report, youll see that instead of my focusing on the shorter term daily or weekly charts, in this report I focus on the Monthly Charts due to my belief that gold in the process of bottoming out.
Issues Facing Gold
Gold has had a difficult time in fighting off soaring stock markets both in the US and elsewhere ever since 2008 when Central Banks embarked on Quantitative Easing Programs. Easy money caused US stock indices to reflate. Its now 9-years later and the Fed has embarked on reflating interest rates and is discussing shrinking its balance sheet. The trick for the Fed will be to do this even though inflation is not where the Fed wants it and is staying stubbornly low. Employment is running at full tilt but wage inflation is missing. Stock indices are at or close to all-time highs and ideas of higher interest rates are being debated. Yesterdays rate hike, is NOT causing more than a normal correction in stock indices.
Inflation has been and is a key missing ingredient in Europe, Asia and the US. Think about all the events that have NOT driven or held gold prices up:
·Brexit
·North Korea
·Numerous, almost daily new accusations against President Trump
·Accusations against Russias involvement in our election process
There are of course other world events, but hopefully you get the point. Events that would normally send gold sharply higher have at best caused gold to creep higher.
As I said, a key ingredient thats been missing is inflation. Yes, we have moderate inflation but not the amount or kind of inflation thats worrisome or even healthy. WTI energy prices are now trading around $45 a barrel, not $60 or more. This is not an inflationary number. Gasoline prices are not only NOT spiking higher, theyre in fact dropping hard right into the summer driving season when they usually rally. Natural Gas prices are not spiking higher, even with hot weather out East and in the Midwest. Wage inflation according to the Phillips Curve a tool the Fed often refers to, is not taking place. The Fed often cites the Phillips Curve, which at its heart is this:
As unemployment rates increase, inflation decreases; as unemployment
rates decrease, inflation increases
The US employment rate is running at a near what is called full employment. Its now 4.3% and if the Fed is right, could go to 4%. The Eurozones unemployment is running at decade old numbers, under double digits there at 9.3%, yet wage inflation there is also missing.
When you have little inflation along with historically low interest rates, investors naturally seek out the best returns they can get their hands on, which in large part explains the stock
market rally thats been going on for 9 or so years now. Keep in mind that this was part of the Feds goal, one theyve accomplished. The Fed has also said its concerned about stock market valuations, so it doesnt seem overly concerned if stocks sink back a bit on interest rate hikes.
I dont see the stock market rally ending by the Feds move to raise interest rates a quarter point as they did today. Yes theres the dots the Feds talk about which portrays when and how many rate hikes Fed Governors expect down the road, but they are not in cement. They are but a guideline as to what theyd like to do, not what they have to do.
The brings us back to the Feds dual mandate. It is to maintain an economy as close to full employment as it can and to control inflation. Given the current spate of poor economic numbers, my take the June rate hike is this. The Fed sees inflation coming soon, or is willing to err on the side of coming inflation in its effort to get us to think inflation is just below the surface and they want to be ahead of the curve. If in the next few months, the economic data doesnt improve you can forget about a September rate hike but that doesnt mean a December one is off the table. Look for more Fed talk about shrinking its balance sheet by not reinvesting proceeds of notes as they mature. This poses a problem given Ms. Yellens term expires at the end of January and President Trump has not announced who will be the next Fed Chair. If its not Ms. Yellen, she might decide to leave the project of shrinking the balance sheet alone, leaving it to her predecessor.
When the shrinking of the balance sheet begins, it will have the dual impact of removing a major buyer of notes, the US, and in turn might cause rates to move lower unless another large buyer or buyers step in to replace the amount the US rolls over each month. China comes to mind as a potential buyer given that its foreign reserves are once again growing and the rift they had with President Trump seems to have been smoothed over.
FOMC Decision and Highlights June 14th 2017 Meeting
Fed Funds interest rate hiked by 25 bps to 1.00% to 1.25% range
Fed has begun setting out plan to shrink balance sheet
monitoring inflation developments closely
near term economic risks are roughly balanced
labor market continues to strengthen
household spending picking up in recent months
business investment continues to expand
votes came in at 8 for and 1 against today's rate action
core inflation has inched lower, which is seen as better barometer of future inflation
said core inflation will move up in the next couple years on better employment
real GDP is 2.2% this year inching down to 1.9% by 2019
inflation projection of 1.6% this year then rising to 1.8% next and following years
continue to expect to raise interest rates gradually
projected path of Fed Funds rate by members are largely unchanged from March outlooks
balance sheet reduction plans does not affect Fed's future interest rate policy use
balance sheet policy tools should be part of future toolkit for the central bank
after 5 years of undershooting inflation goal, the FOMC is still committed to that goal
dismisses low inflation on idiosyncratic elements
Phillips Curve remains flat
wage growth remains low
no sign of upward pressure on inflation
current Fed policy shows no evidence of changed investor or consumer spending
Chart Action
Those who follow me know I post Daily Videos on YouTube that can be watched by all. It requires no User ID or Password. In it I cover the daily charts of gold, silver, copper, platinum and palladium. Just go to YouTube and type in Ira Epstein, youll find me.
In this report I want to focus on longer term charts, specifically the monthly chart. Yes, its means you give the market more leeway, but this type of chart is about the bigger picture. As such it also stops you from being swayed by the day to day movements of gold, which can be volatile.
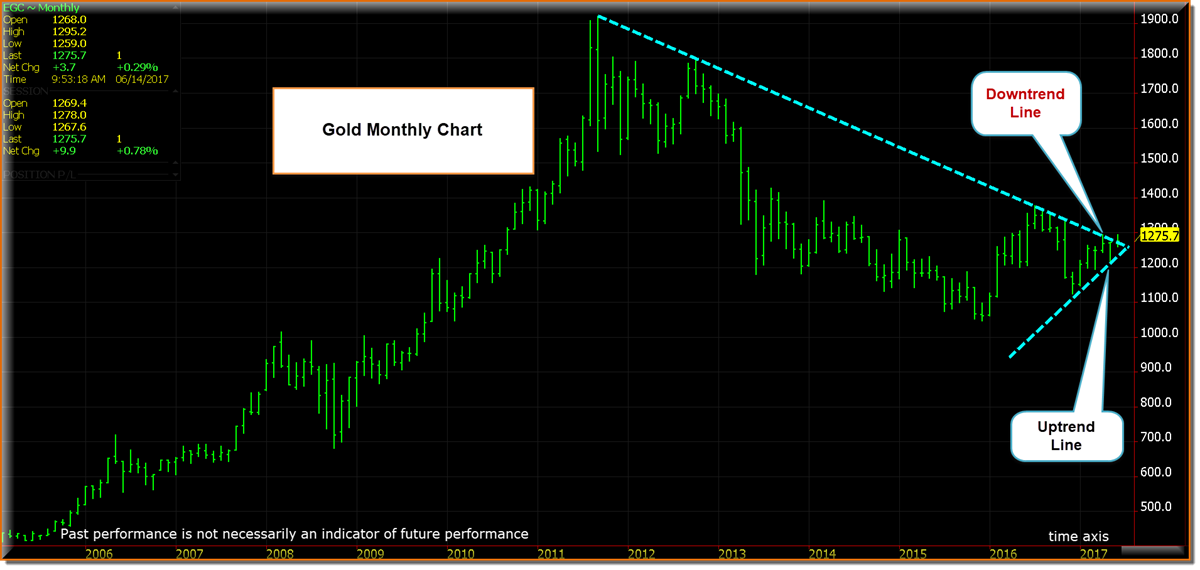
Monthly Chart with Uptrend and Downtrend Lines
Whats just taken place on the above chart was the challenging of the long-term downtrend line. Prices did so in 2016, and again in April of this year. Each time, theres been no follow through, which is causing the current Triangle Chart Pattern.
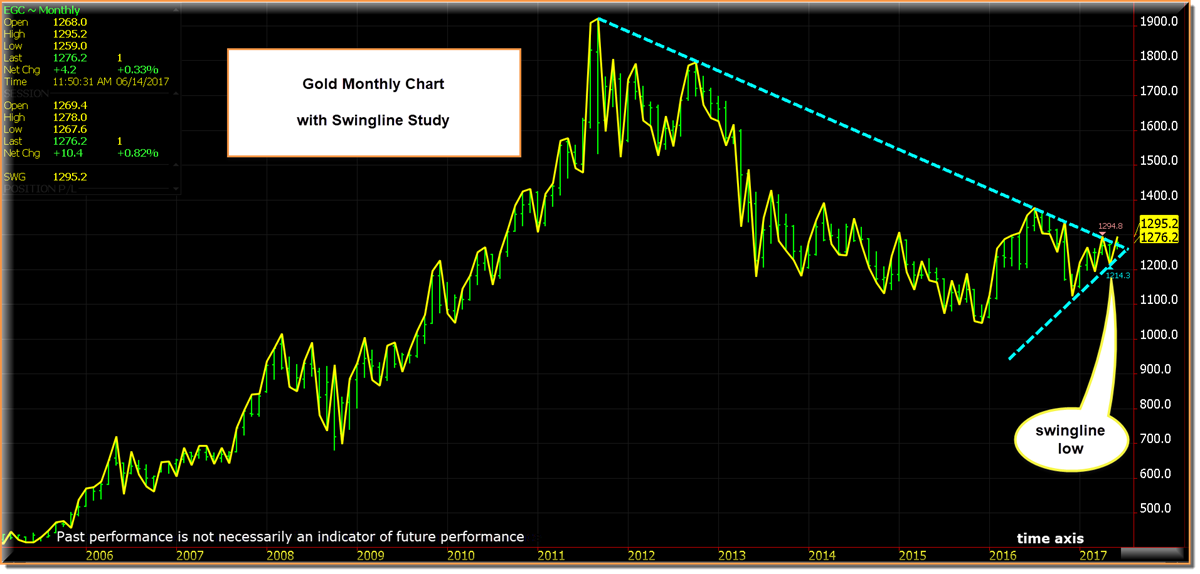
The support line looks valid to me. The current rally high of 1295.2 in June is higher than the rally high of 1294.8 made in April, which means we have a pattern of higher highs and higher lows in place. On the chart below, I have added my proprietary Swingline Study in yellow, which shows where the most recent current highs and lows are.
Keep in mind that taking out the current May low of 1214.3 and closing under it would result in a break out to the downside of the current chart pattern.
Monthly Chart with Swingline Study
The Swingline is a proprietary study I created to display current and past highs and lows on a chart. It works on both bar and candlestick charts.
The premise of the study is that it defines trend and risk associated with the current trend if you believe as I do that an uptrend is comprised of higher highs and higher lows, the pattern being displayed at this time.
A break low that would destroy the current pattern of higher highs and higher lows would take place if prices got under 1214.3. From the current price level, the one where I captured most of the chart action on the enclosed chart, that represents an approximate risk of $62 an ounce, as the chart price on some of these charts was close to 1276.2 when I created them.
A settlement price at month end over 1294.8 would seal the fate of the current downtrend line, rendering it no longer valid. Until that occurs, at mid-month, the current downtrend line is still valid.
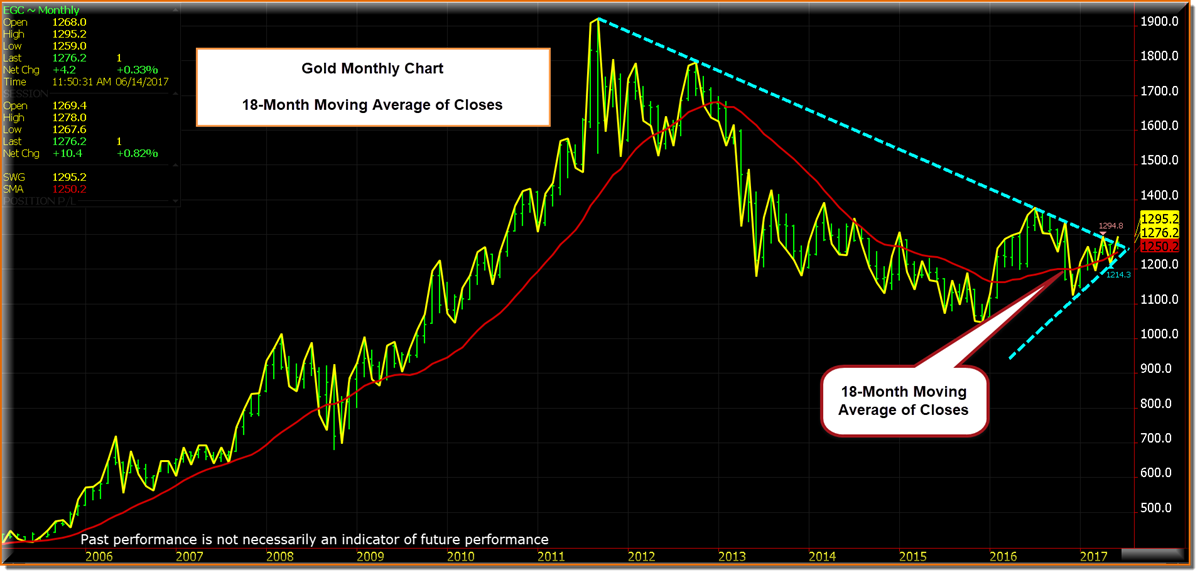
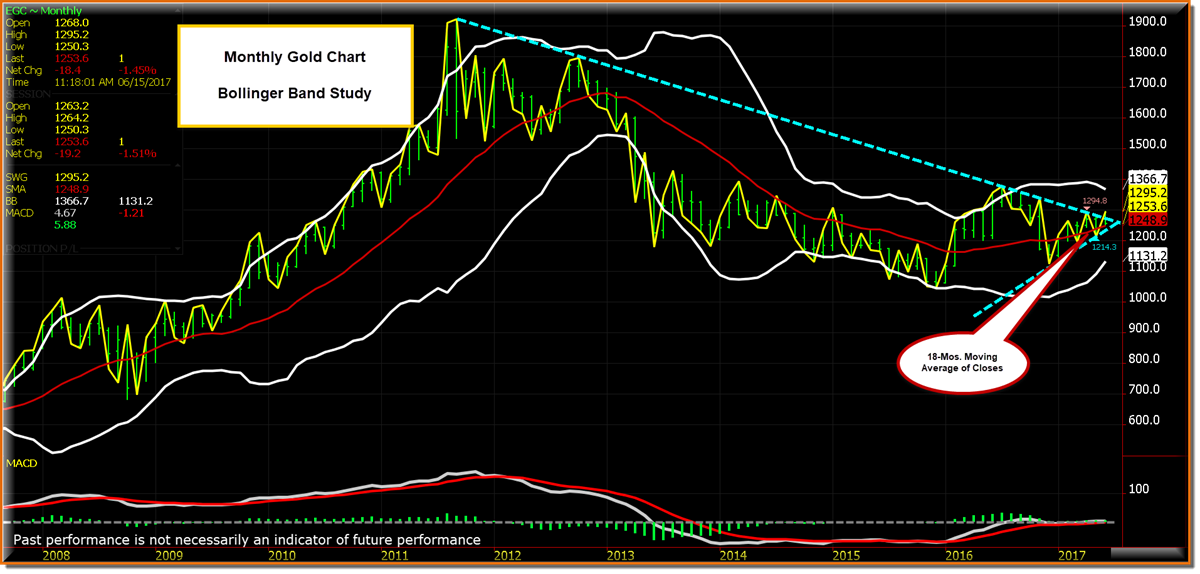
Monthly Chart with Swingline and 18-Month Moving Average of Closes
The 18-Month Moving Average of Closes is comprised of nearly a year and a half of past monthly closes. When the market is trading over it I maintain a bullish bias. When under it, a bearish one.
When important trend plays are being developed, either ones in a new direction or ones that were in place and are about to resume, they often come after a series of moves the hit this 18 Month Moving Average of Closes over and over. Thats now occurring.
Therefore, as I see it, gold is at a key point when taking into consideration that prices have been hitting the 18-Month Moving Average of Closes over the past 5 months and given the narrowing in of the Triangle Pattern on the chart.
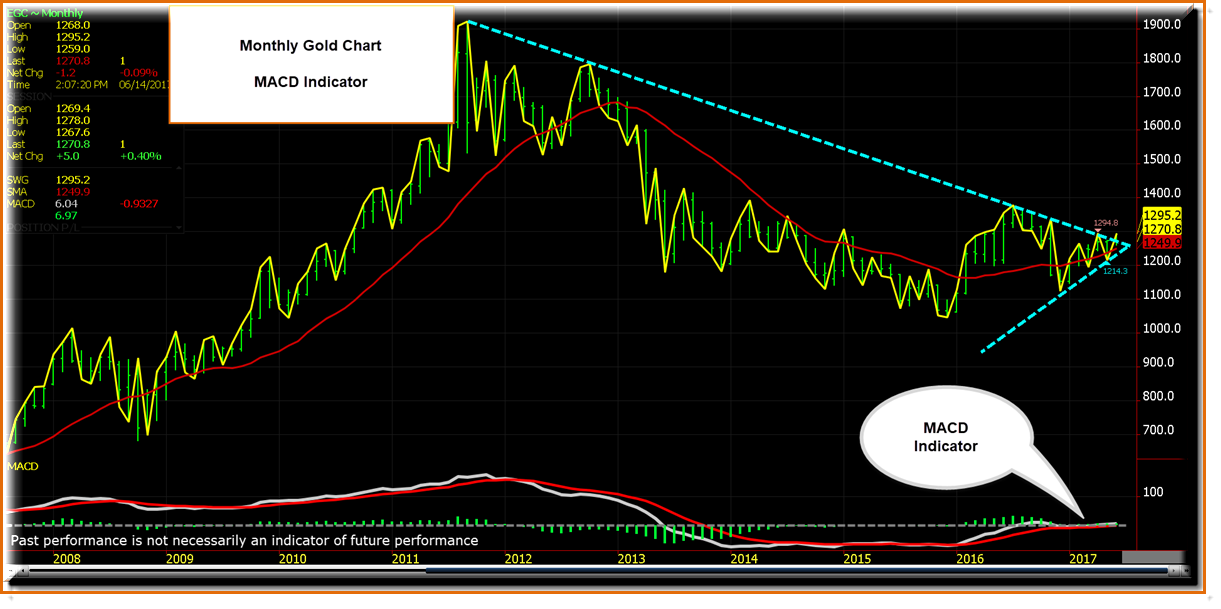
So that leaves me questioning whats going on in terms of internal momentum in gold. There are many ways to measure momentum, with one of the most popular being MACD, the Moving Average Convergence Divergence Indicator. I use Slow Stochastics on the Daily Charts, but for longer term charts, I often look to see what the MACD Indicator is doing.
Monthly Gold Chart with MACD Indicator
The MACD Indicator has crossed over its Zero Line, the light gray horizontal slashed line on the bottom of the above chart. However, its not displaying upside momentum. When markets trend, the green bars which represents changes between the two exponential averages that make up this indicator, typically expand. Were not seeing that which means momentum is lacking. The fact that the indicator is hanging around the Zero Line is a sign of market indecision in my opinion.
Aftermath of Fed Interest Rate Hike on June 14, 2017
The chart below was captured on Thursday, near noon, the day after the FOMCs ¼ point rate hike took effect along with the announcement by the Fed that it was looking for another rate hike this year and was formulating a plan to shrink its balance sheet.
In the aftermath of the Fed raising its key interest rate yesterday and stating that another hike is coming along with a plan to start soon the process of shrinking its balance sheet, the US Dollar is higher and gold is lower.
Gold however is still in a longer term uptrend pattern given that the Swingline has a pattern of higher highs and higher lows, prices are trading over the 18-Month Moving Average of Closes and momentum, while not pointing up, is also not pointing down.
Support is 1248.9, the 18-Month Moving Average of Closes. Thats just shy of todays low of 1250.3, also the low of the month.
Expect to see buying against this moving average and resistance up against the downtrend line on the chart. If prices get under 1214.3, the bull story is over and a bearish stance would be appropriate.
However, should prices breakout to the upside and close over 1294.8, the Upper Bollinger Band,at 1366, is my initial upside target.
Commentary
Gold is attempting to bottom out. Prices peaked in 2011 and are now in a consolidation phase.
The current triangle formation shows a market with prices narrowing in, made up of well-defined uptrend and downtrend lines.
I believe that the 18-Month Moving Average of Closes has done a good job of defining both support and resistance levels. When prices are over this number and break down to it, it offers support. When under it, and prices rally up to it, it offers resistance.
I think longer term traders are buying right here, against the 18-Month Moving Average of Closes and will likely risk their trade to just under 1214.3, the most recent Swingline Low.
If prices get under 1214.3, the downtrend will be back in place and a move down to the lower Bollinger Band of 1131 is possible.
Whats clear to me is that a move of importance is just around the corner. One this could produce a rather large move in gold prices given how long the current price consolidation has been taking.
If youd like more information, be sure to visit my website and signup for the Market Research.
Disclaimer: This publication is strictly the opinion of its writer and is intended solely for informative purposes and is not to be construed, under any circumstances, by implication or otherwise, as an offer to sell or a solicitation to buy or trade in any commodities or securities herein named. Information is taken from sources believed to be reliable, but is in no way guaranteed. Chart data is courtesy of LGP-IraCharts. No guarantee of any kind is implied or possible where projections of future conditions are attempted. Futures and Options on Futures trading involve risk. In no event should the content of this market letter be construed as an express or implied promise, guarantee or implication by or from The Ira Epstein Division of Linn & Associates or Linn & Associates LLC that you will profit or that losses can or will be limited in any manner whatsoever. No such promises, guarantees or implications are given. Past results are not indicative of future performance.
The content on this site is protected
by U.S. and international copyright laws and is the property of GoldSeek.com
and/or the providers of the content under license. By "content" we mean any
information, mode of expression, or other materials and services found on GoldSeek.com.
This includes editorials, news, our writings, graphics, and any and all other
features found on the site. Please contact
us for any further information.
Live GoldSeek Visitor Map | Disclaimer
The views contained here may not represent the views of GoldSeek.com, Gold Seek LLC, its affiliates or advertisers. GoldSeek.com, Gold Seek LLC makes no representation, warranty or guarantee as to the accuracy
or completeness of the information (including news, editorials, prices, statistics,
analyses and the like) provided through its service. Any copying, reproduction
and/or redistribution of any of the documents, data, content or materials contained
on or within this website, without the express written consent of GoldSeek.com, Gold Seek LLC,
is strictly prohibited. In no event shall GoldSeek.com, Gold Seek LLC or its affiliates be
liable to any person for any decision made or action taken in reliance upon
the information provided herein.