-- Published: Tuesday, 28 November 2017 | Print | Disqus
By Frank Holmes

I spend a lot of time writing and talking about inflation, especially as it affects the price of gold, oil and other commodities and raw materials. The year-over-year percent change in the cost of living has been reasonably low for the past five years, averaging about 1.3 percent on a monthly basis. For commodities, the average change has been even lower at negative 0.9 percent, as measured by the producer price index (PPI). This hasn’t been too constructive for gold and oil producers, but it’s been a windfall for American consumers and manufacturers.
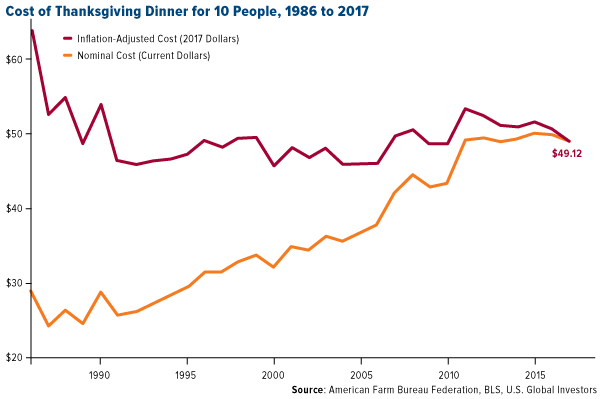
A helpful way to look at inflation is the changing cost of a typical Thanksgiving dinner for 10 people. For the second straight year, the cost actually declined from the previous year’s holiday, according to the American Farm Bureau Federation (AFBF). This year’s feast, including staples such as turkey, rolls, sweet potatoes and more, fell $0.75 to a five-year low of $49.12. On an inflation-adjusted basis, that’s down more than $10 from 30 years ago. The turkey alone cost about 1.6 percent less than last year.

click to enlarge
So why’s this happening? Obviously there’s no shortage in demand for turkey, with an estimated 88 percent of American households enjoying it during last week’s Thanksgiving feast. U.S. turkey consumption, in fact, has nearly doubled over the past 25 years, according to the National Turkey Federation (NTF). As you might expect, this has led to an explosion in production over the same period, which has helped keep costs relatively stable for a generation.
On Friday, shares of Tyson Foods, one of the top processors of the poultry, were trading above $80, up more than 30 percent year-to-date.
Again, this is good news for consumers. Also good? Multiple studies have found that Americans gain only about a pound in weight as a result of engorging themselves on Thanksgiving Day. So don’t feel so guilty about having helped yourself to that extra slice of pumpkin pie.
Record Number of Americans Hit the Road and Take to the Skies
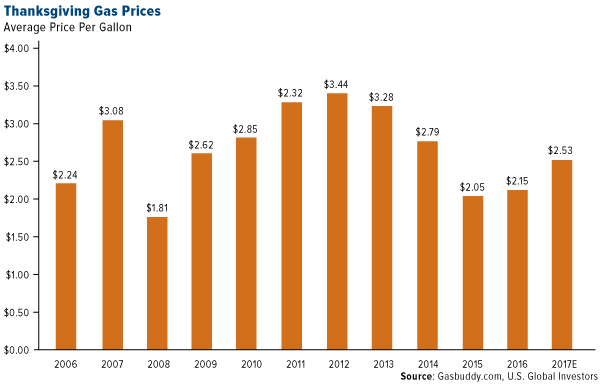
Holiday gasoline prices, however, are on the rise, with the cost per gallon rising to its highest level since 2014. A trip to the pump this past Thanksgiving will cost motorists an extra 18 percent compared to last year and nearly 25 percent more compared to 2015.

click to enlarge
As I shared with you earlier this month, oil prices climbed to two-year highs following Saudi Arabia’s purge of princes and ministers. Markets also appear to be pricing in expectations that the Organization of Petroleum Exporting Countries (OPEC) will extend production cuts to the end of 2018.
West Texas Intermediate (WTI) was trading on Friday at a 52-week high of $59 a barrel. The next stop is $60, a level we haven’t seen since May 2015. In a strategy report last week, BCA Research recommended an overweight position in energy.
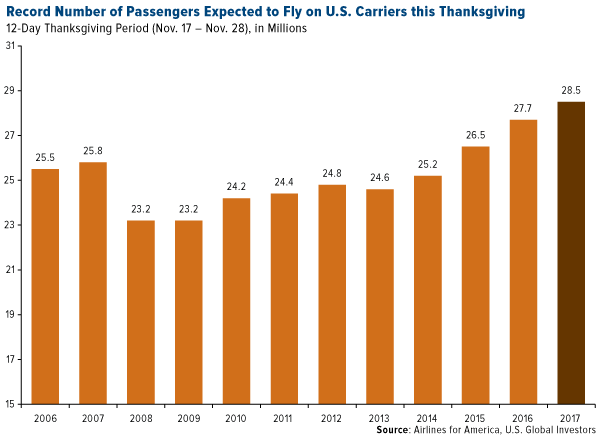
Higher fuel costs aren’t expected to discourage domestic travel, though. This Thanksgiving season, approximately 51 million Americans were projected to travel 50 miles or more from home on U.S. roads, highways, airlines, rails and waterways, according to the American Automobile Association (AAA). That’s up 3.3 percent from last year and the highest volume since 2005. President Donald Trump mentioned the impressive figure in a tweet last week, adding that “traffic and airports are running very smoothly!”

Looking at air travel alone, a record 28.5 million passengers were estimated to take to the skies this year during the 12-day Thanksgiving period, according to Airlines for America (A4A). That equates to an additional 2.38 million passengers a day.

click to enlarge
With the economy improving, incomes on the rise and consumer confidence at multiyear highs, airline executives expressed optimism in continued flight demand growth and profitability. According to October’s Airline Business Confidence Survey, conducted by the International Air Transport Association (IATA), 80 percent of airline chief financial officers (CFOs) said profits improved in the third quarter compared to the same three-month period in 2016. An overwhelming 87 percent were confident such profitability would persist or improve over the next 12 months. Eighty-six percent of CFOs reported increased passenger demand year-over-year in the third quarter, while 71 percent expected traffic volumes to rise a year from now.
Holiday Shopping Sales Could Exceed $107 Billion
On a final note, retailers were bracing for a blowout holiday shopping season. Earlier this month, Adobe Analytics released its forecast that U.S. sales during the Thanksgiving weekend and Cyber Monday could climb above $107 billion, a year-over-year increase of 13.8 percent. Cyber Monday alone might generate as much as $6.6 billion, 16.5 percent more than last year, making it the largest online sales day in history. Among the most hotly anticipated gift items this year are Apple Air Pods, home assistants (Amazon Echo and Google Home) and Sony PlayStation virtual reality (VR) headsets.
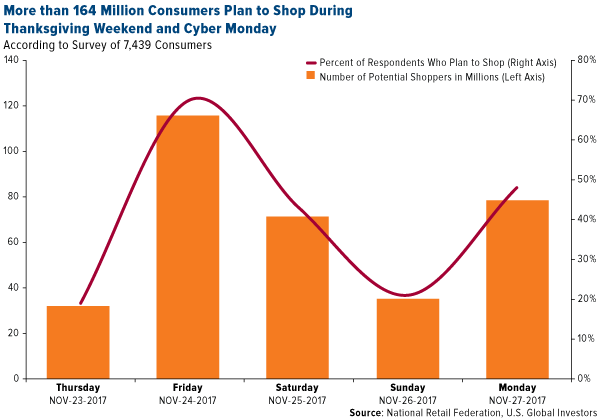
Looked at another way, more than 164 million consumers, or nearly 70 percent of all Americans, planned to shop during the Thanksgiving weekend and Cyber Monday, according to a survey conducted by the National Retail Federation (NRF). Today, Black Friday might have seen the largest volume of potential shoppers at 115 million, or 70 percent of those polled, followed by 78 million on Cyber Monday.

click to enlarge
So how could investors take advantage of these findings? According to a recent report from LPL Financial, since 2009 the S&P Retail Select Industry Index has seen the strongest gains during the months of February and March, after companies report sales for the fourth quarter. Retailers are actually down about 6 percent year-to-date, and LPL Financial adds that “it is likely that the performance of individual company stocks be more dispersed than they have been historically, which may favor active management in the sector moving forward.” I agree with this assessment, as we’ve seen quite a lot of volatility in the space.
I want to wish everyone a blessed week! I often say that having gratitude improves your altitude in life. It’s important that we take stock not only in our finances but also the people who matter most, from family and friends to coworkers and business associates.
All opinions expressed and data provided are subject to change without notice. Some of these opinions may not be appropriate to every investor. By clicking the link(s) above, you will be directed to a third-party website(s). U.S. Global Investors does not endorse all information supplied by this/these website(s) and is not responsible for its/their content.
The Producer Price Index (PPI) is a weighted index of prices measured at the wholesale, or producer level. A monthly release from the Bureau of Labor Statistics (BLS), the PPI shows trends within the wholesale markets, manufacturing industries and commodities markets.
The S&P Retail Select Industry Index represents the retail sub-industry portion of the S&P Total Market Index (TMI). The S&P TMI tracks all the U.S. common stocks listed on the NYSE, AMEX, NASDAQ National Market and NASDAQ Small Cap exchanges. The Retail Index is a modified equal weight index.
Holdings may change daily. Holdings are reported as of the most recent quarter-end. The following securities mentioned in the article were held by one or more accounts managed by U.S. Global Investors as of (09/30/2017): Tyson Foods Inc.
| Digg This Article
-- Published: Tuesday, 28 November 2017 | E-Mail | Print | Source: GoldSeek.com

