LIVE Gold Prices $  | E-Mail Subscriptions | Update GoldSeek | GoldSeek Radio 

Commentary : Gold Review : Markets : News Wire : Quotes : Silver : Stocks - Main Page 

 GoldSeek.com >> News >> Story  Disclaimer 
 
Latest Headlines

GoldSeek.com to Launch New Website
By: GoldSeek.com

Is Gold Price Action Warning Of Imminent Monetary Collapse Part 2?
By: Hubert Moolman

Gold and Silver Are Just Getting Started
By: Frank Holmes, US Funds

Silver Makes High Wave Candle at Target – Here’s What to Expect…
By: Clive Maund

Gold Blows Through Upside Resistance - The Chase Is On
By: Avi Gilburt

U.S. Mint To Reduce Gold & Silver Eagle Production Over The Next 12-18 Months
By: Steve St. Angelo, SRSrocco Report

Gold's sharp rise throws Financial Times into an erroneous sulk
By: Chris Powell, GATA

Precious Metals Update Video: Gold's unusual strength
By: Ira Epstein

Asian Metals Market Update: July-29-2020
By: Chintan Karnani, Insignia Consultants

Gold's rise is a 'mystery' because journalism always fails to pursue it
By: Chris Powell, GATA

 
Search

GoldSeek Web

 
GDX And GDXJ Targets


 -- Published: Wednesday, 6 December 2017 | Print  | Disqus 

By Rambus

I’m going to use the GDX and GDXJ as a proxy for the rest of the PM stock indexes which are very similar to these two. Last Wednesday we looked at the short term daily charts to the longer term weekly charts to see how things were setting in the PM complex.

We first looked at the short term daily chart which was showing the H&S top and the smaller blue consolidation pattern that was building out below the neckline. The smaller blue patterns were kind of morphing, but were giving us a hint of what they would eventually look like when they competed.

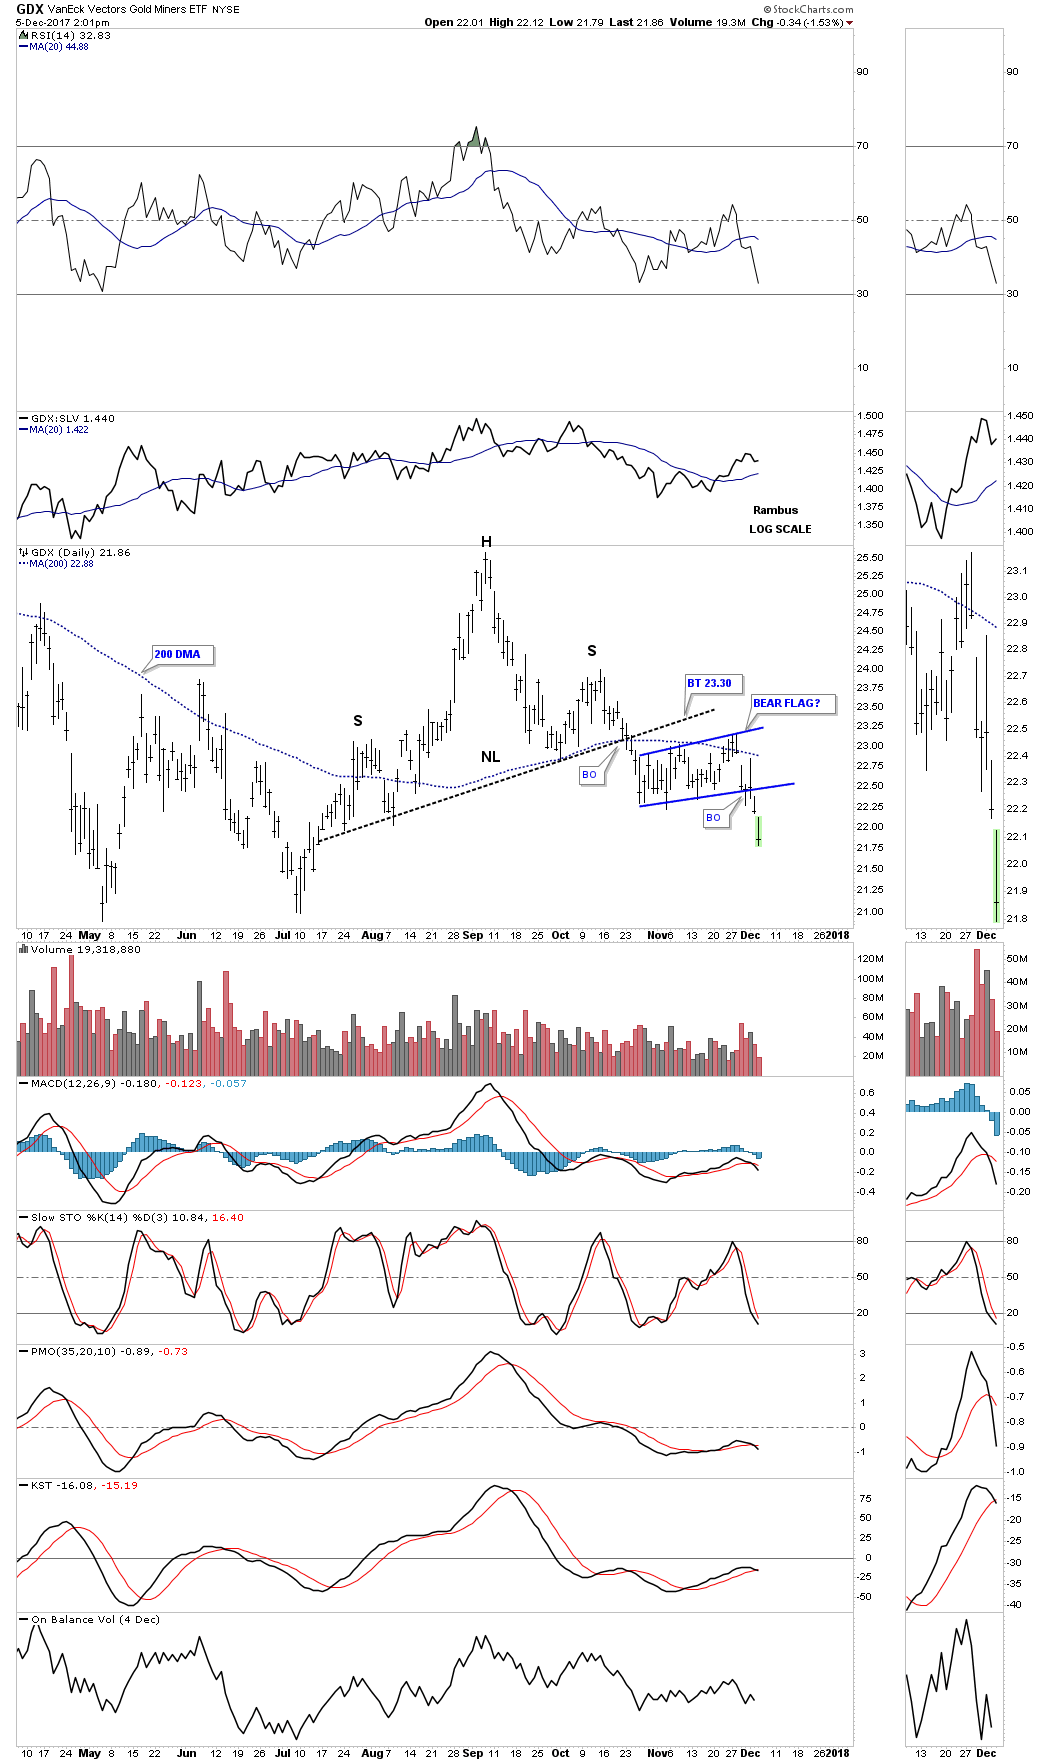
Below is the short term daily chart for the GDX which shows the H&S top with the completed bearish rising flag. The breakout was a little sloppy, but today we are getting some follow through to the downside.

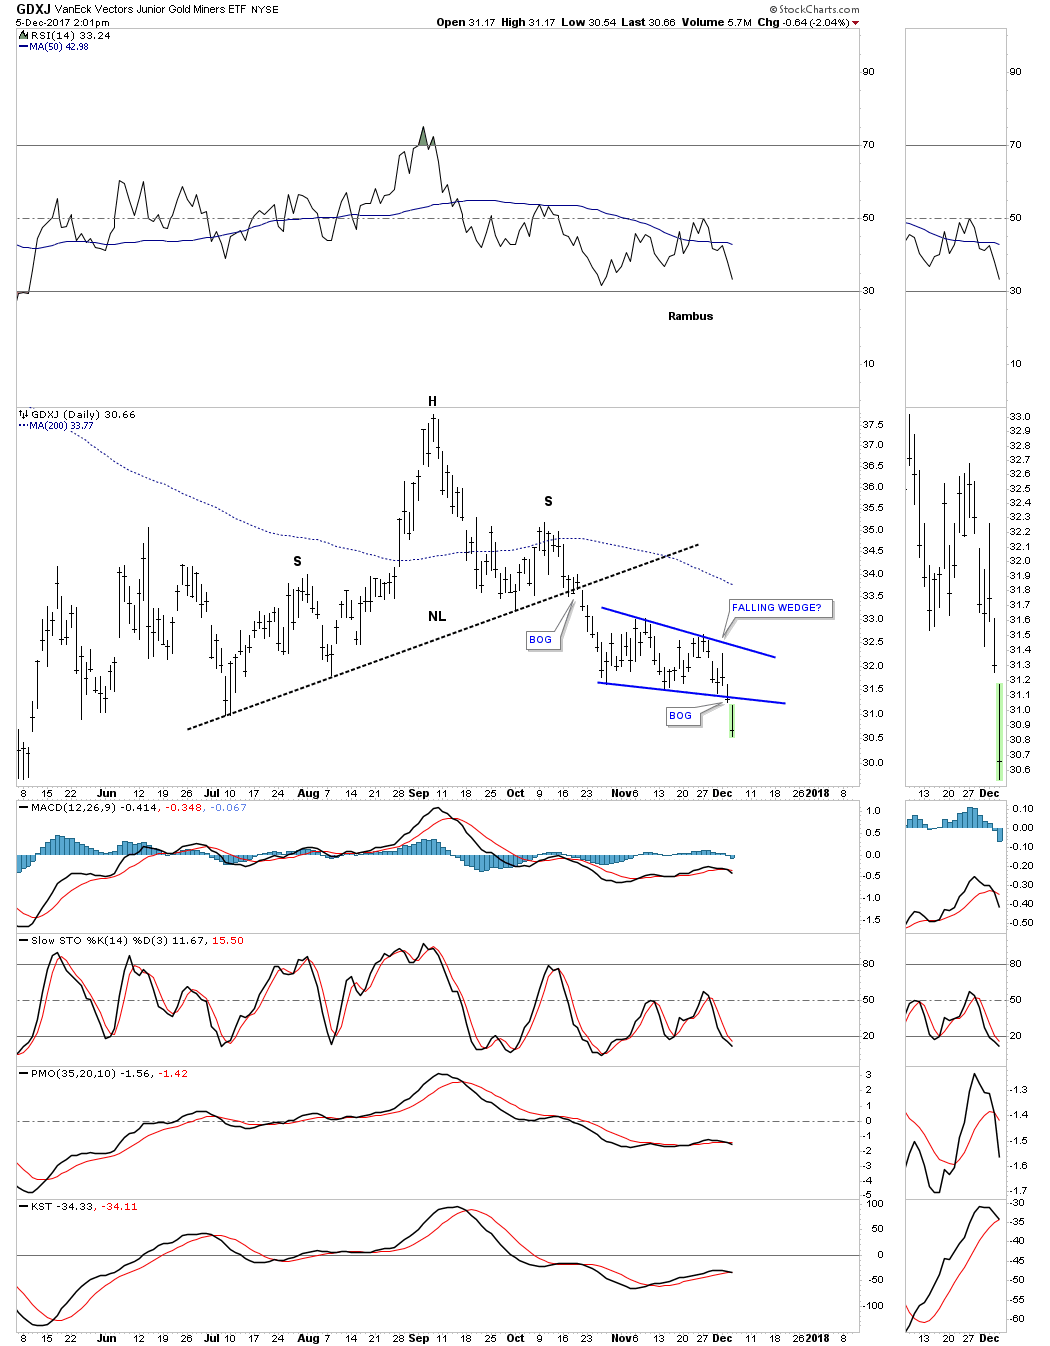
This short term daily chart for the GDXJ shows it broke out below the bottom rail of its bearish falling wedge this morning with a breakout gap.

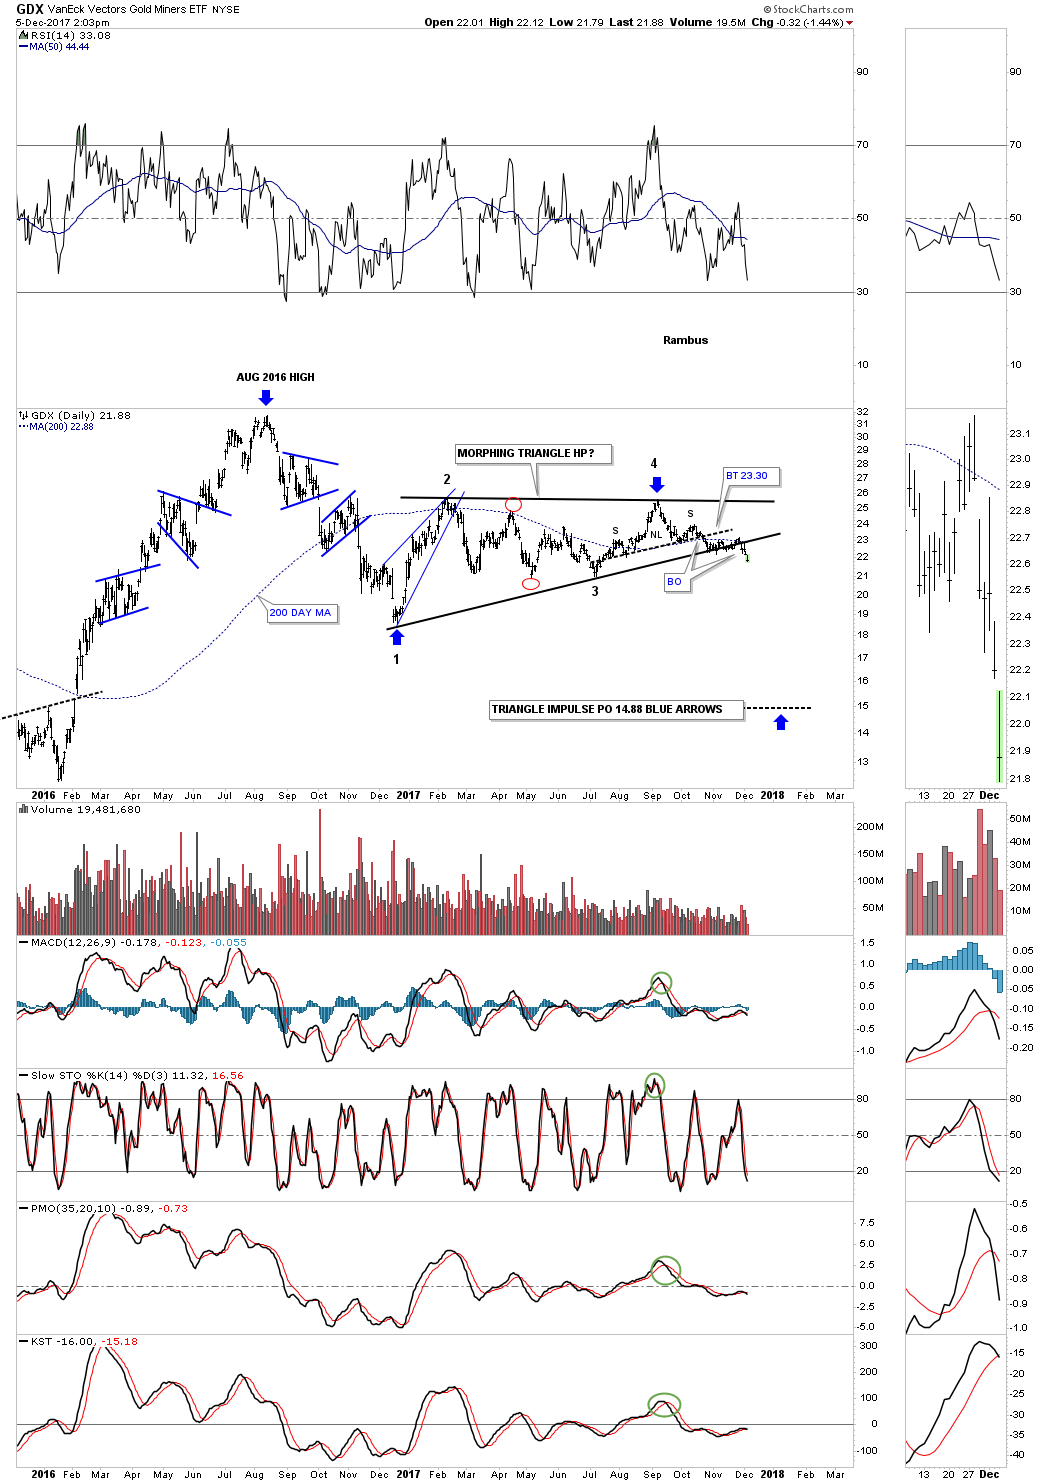
Now lets look at the longer term daily chart for the GDX which shows the one year triangle consolidation pattern with the breakout now visible. The chances are high that the triangle consolidation pattern will be a halfway pattern to the downside with a price objective to the 14.88 area as shown by the blue arrows.

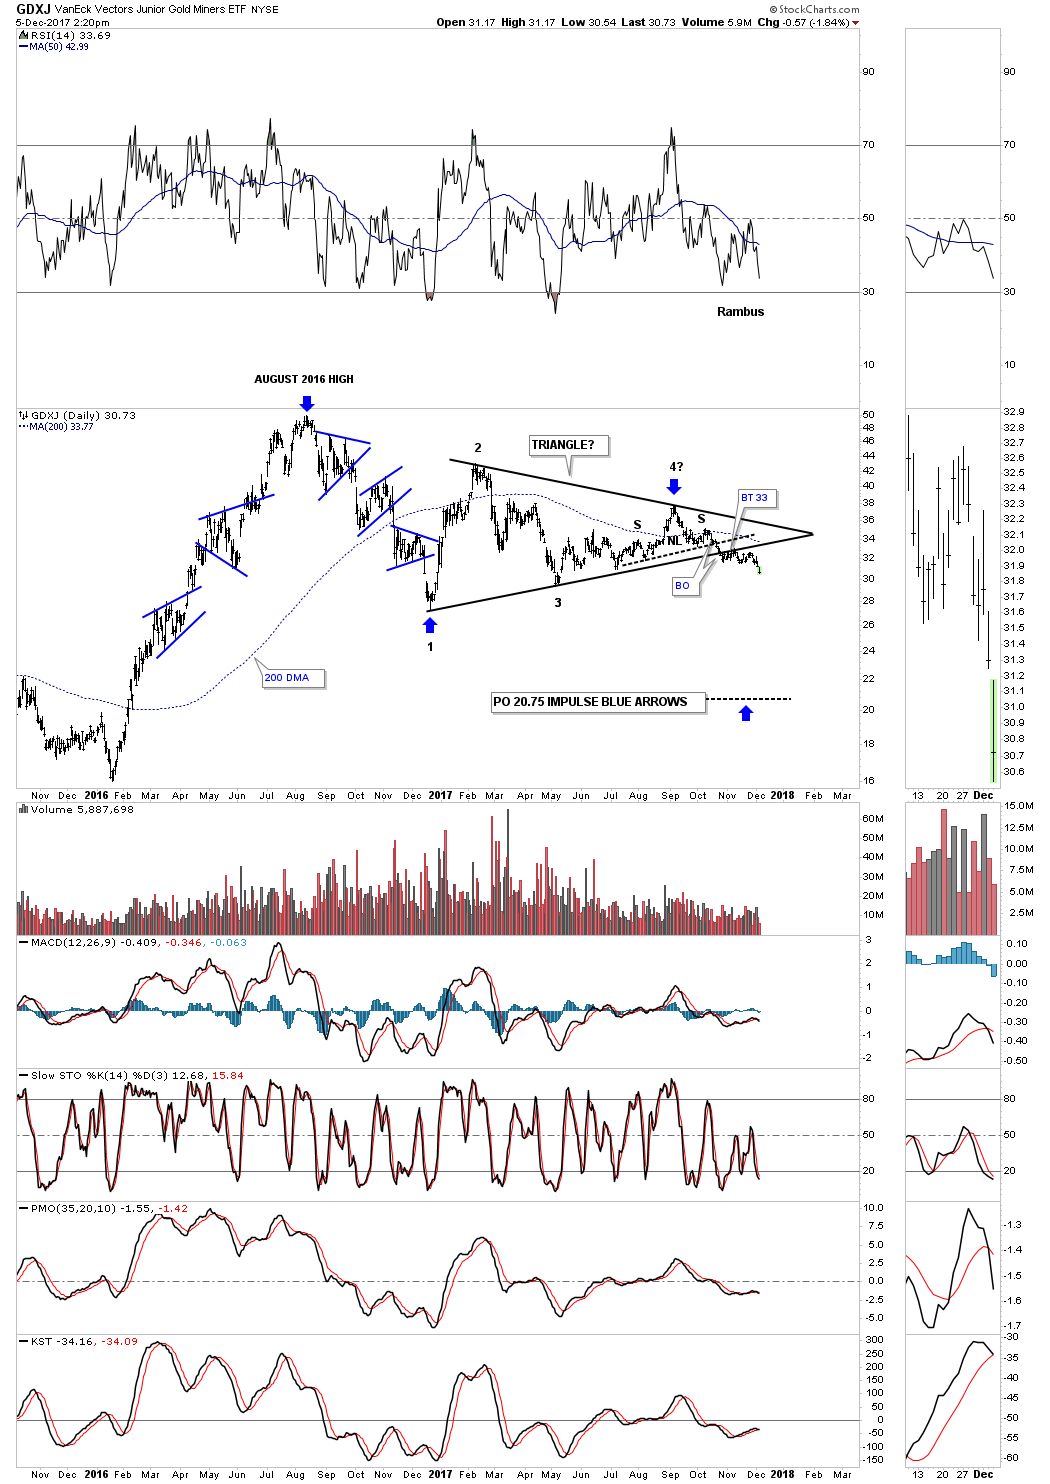
Below is the long term daily chart for the GDXJ which shows the H&S top on the short term daily chart as the 4th reversal point in its one year triangle consolidation pattern. The impulse measured move would be down to the 20.75 area as shown by the blue arrows.

This four year weekly chart for the GDX puts the triangle in perspective as a possible halfway pattern to the downside. It’s still possible we could see a backtest to the underside of the bottom rail of the triangle which would come into play around the 22.75 area.


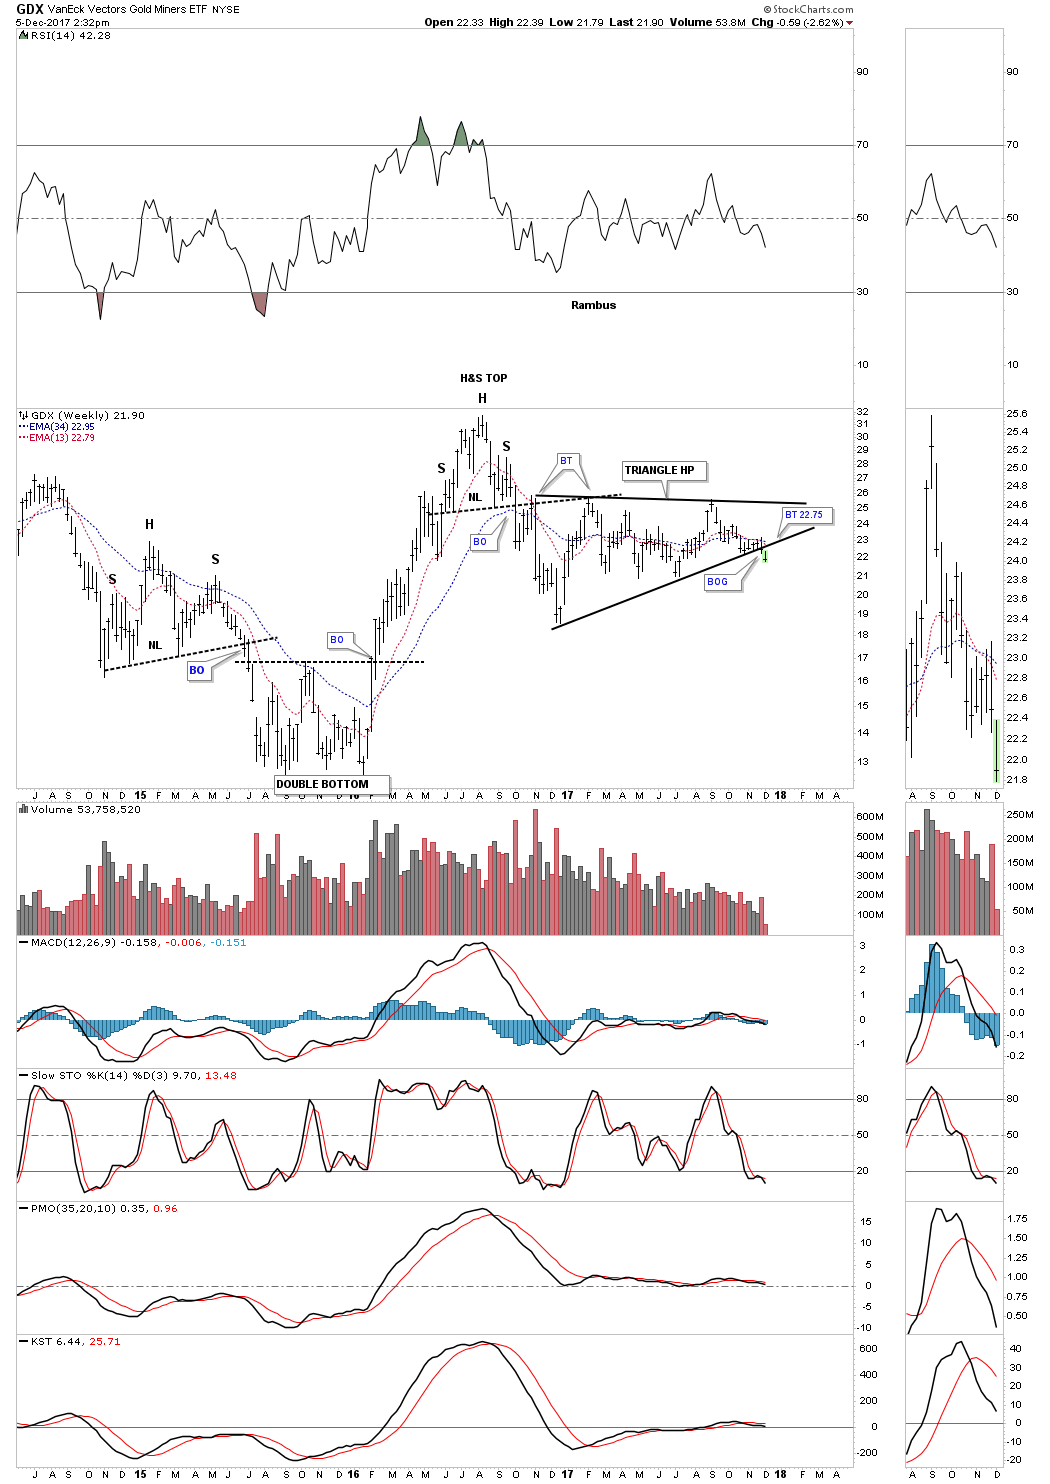
Until the bulls can take out the top rail of the downtrend channel the bears are still in charge.

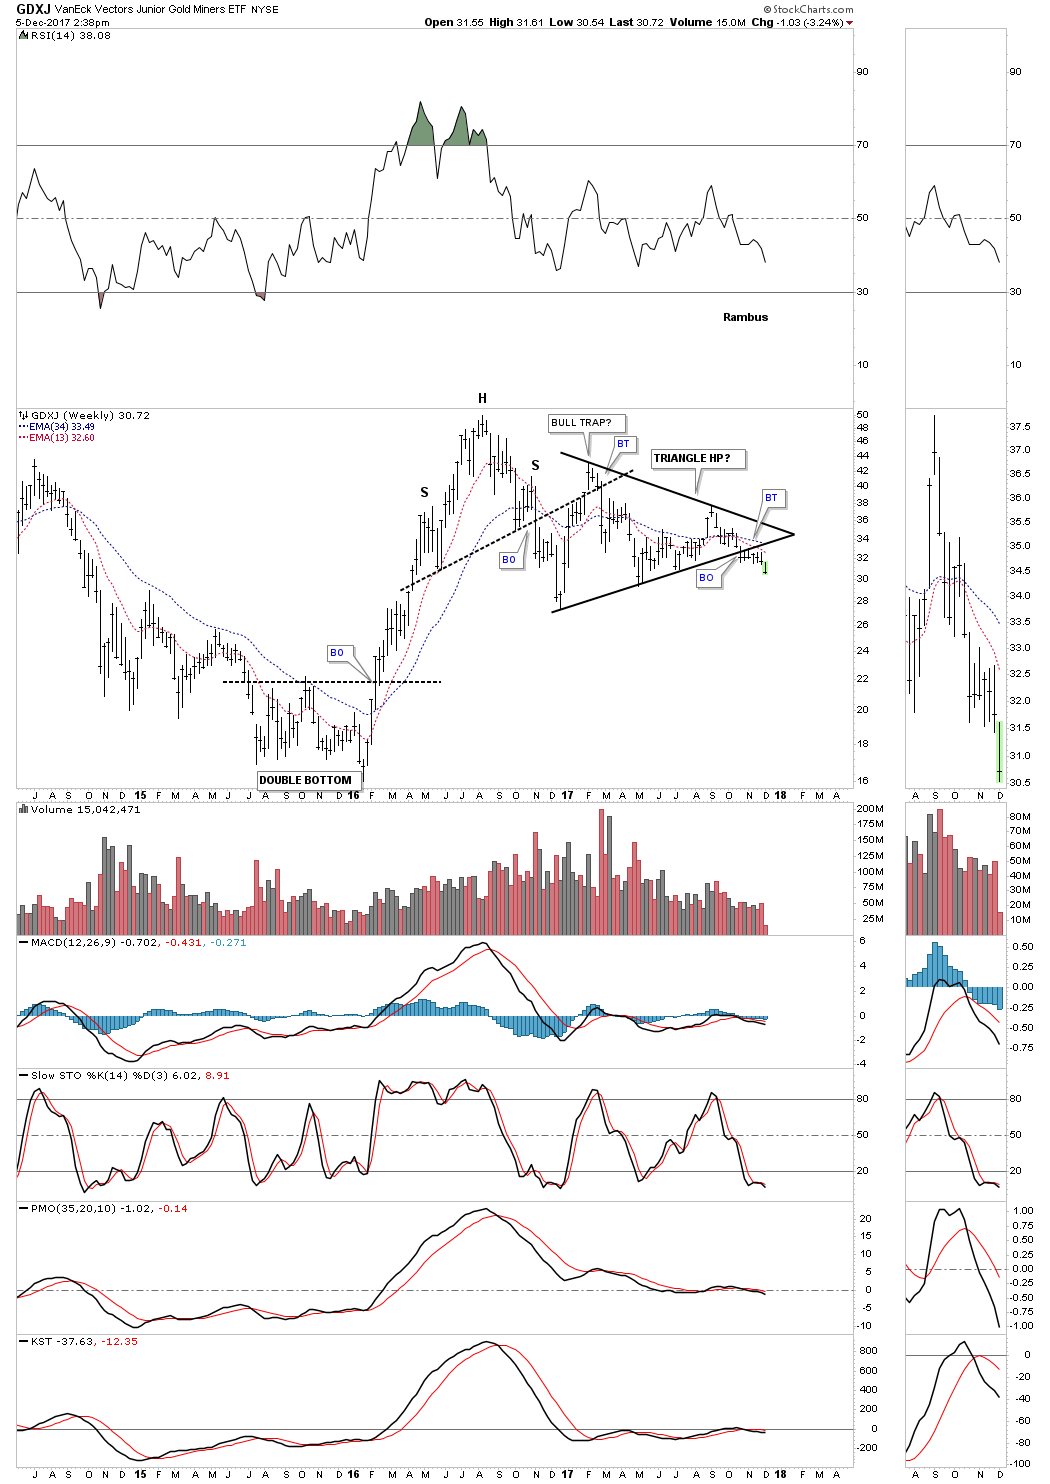
This short term weekly chart for the GDXJ puts its one year triangle in perspective as a possible halfway pattern to the downside.

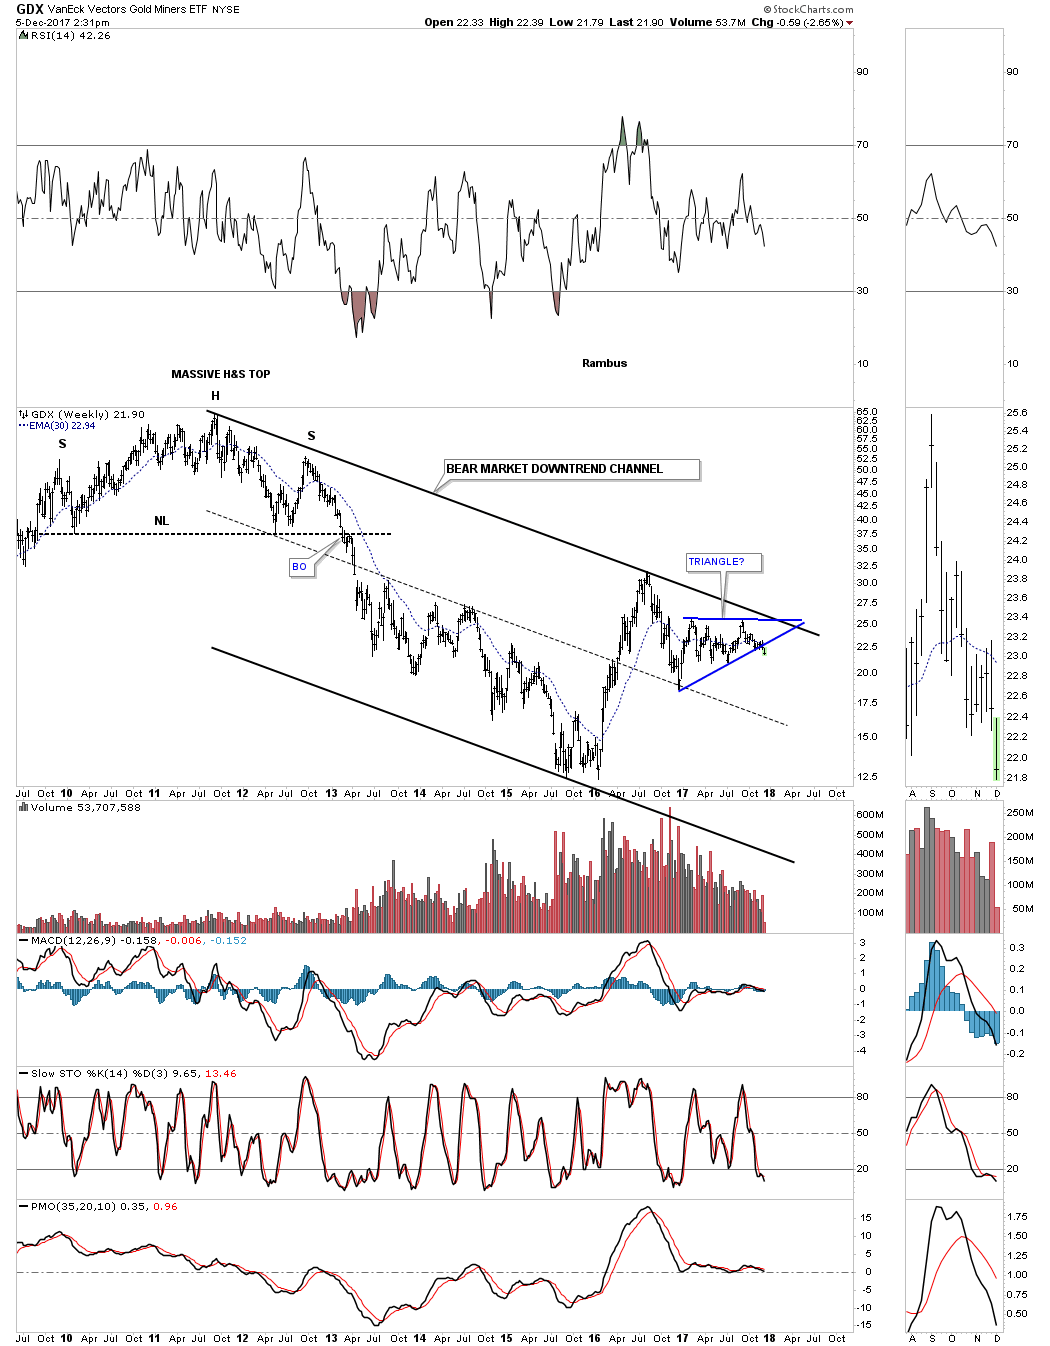
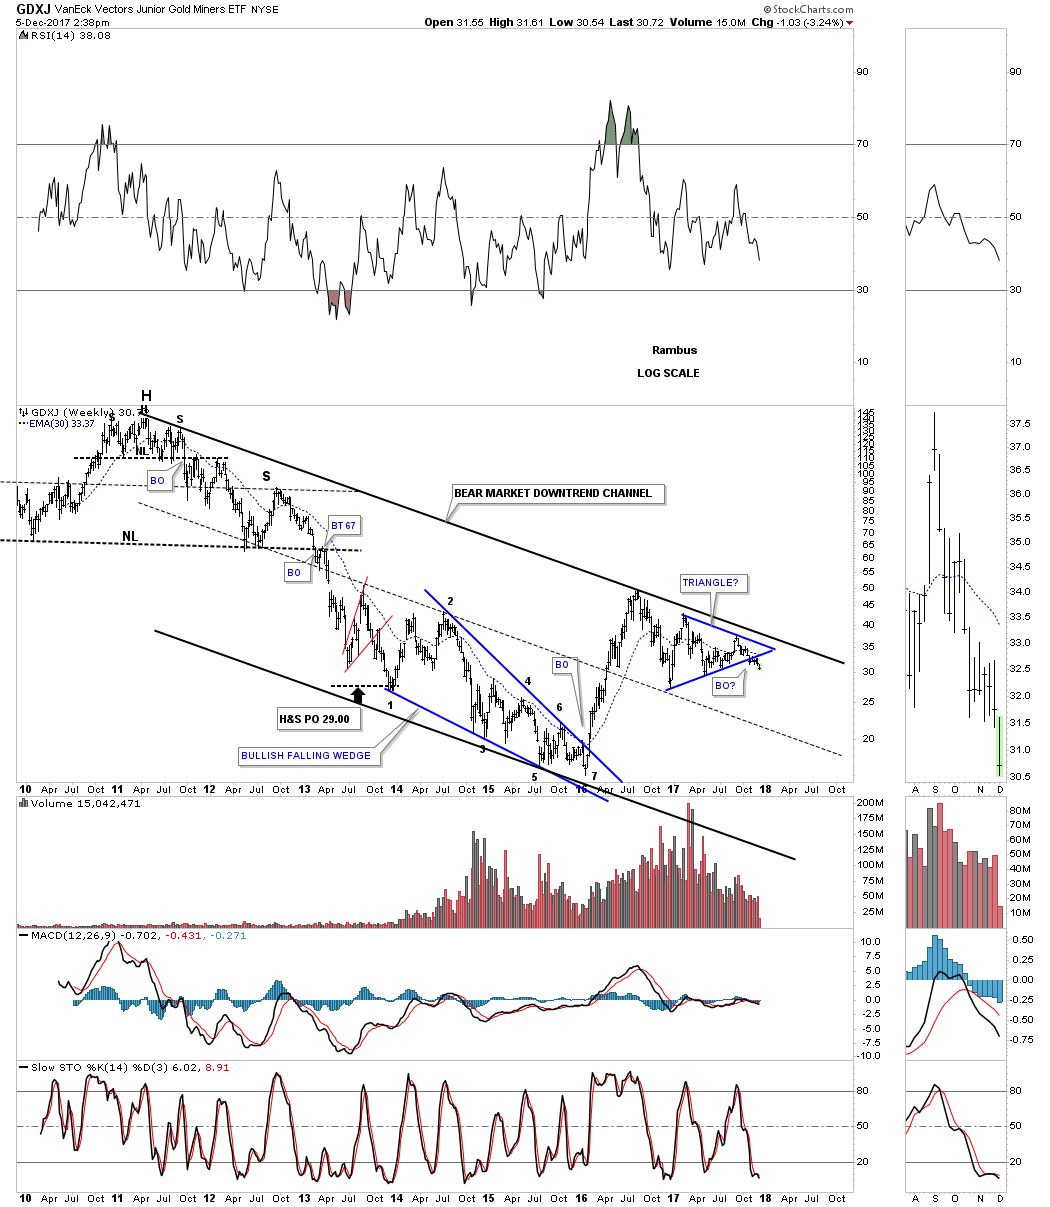
This long term weekly chart shows how the triangle fits into the very big picture. Again all the bulls need to do is take out the top rail of the bear market downtrend channel and all will be right with the world again. As you can see they have tried three times in the last year and a half, but so far haven’t been able to do it.

https://rambus1.com/


| Digg This Article
 -- Published: Wednesday, 6 December 2017 | E-Mail  | Print  | Source: GoldSeek.com

comments powered by Disqus


Increase Text SizeDecrease Text SizeE-mail Link of Current PagePrinter Friendly PageReturn to GoldSeek.com

 news.goldseek.com >> Story

E-mail Page  | Print  | Disclaimer 


© 1995 - 2019


GoldSeek.com Supports Kiva.org

© GoldSeek.com, Gold Seek LLC

The content on this site is protected by U.S. and international copyright laws and is the property of GoldSeek.com and/or the providers of the content under license. By "content" we mean any information, mode of expression, or other materials and services found on GoldSeek.com. This includes editorials, news, our writings, graphics, and any and all other features found on the site. Please contact us for any further information.

Live GoldSeek Visitor Map | Disclaimer


Map

The views contained here may not represent the views of GoldSeek.com, Gold Seek LLC, its affiliates or advertisers. GoldSeek.com, Gold Seek LLC makes no representation, warranty or guarantee as to the accuracy or completeness of the information (including news, editorials, prices, statistics, analyses and the like) provided through its service. Any copying, reproduction and/or redistribution of any of the documents, data, content or materials contained on or within this website, without the express written consent of GoldSeek.com, Gold Seek LLC, is strictly prohibited. In no event shall GoldSeek.com, Gold Seek LLC or its affiliates be liable to any person for any decision made or action taken in reliance upon the information provided herein.