World is $233 Trillion In Debt: UK Personal Debt At New Record
-- Published: Tuesday, 9 January 2018 | Print | Disqus
The World is $233 Trillion In Debt: Its Time to Rebalance To Gold
Record level global debt level hit $233 trillion in Q3 2017 Worlds per capita debt now more than $30,000 UK personal debts climbed to the highest level since credit crunch, reaching more than £200bn US consumer credit highest jump in 2 years by 8.8% in November to $3.83 trillion BofE warn UK banks could incur £30bn of losses if interest rates and unemployment rise sharply
Graph updated September 2017.
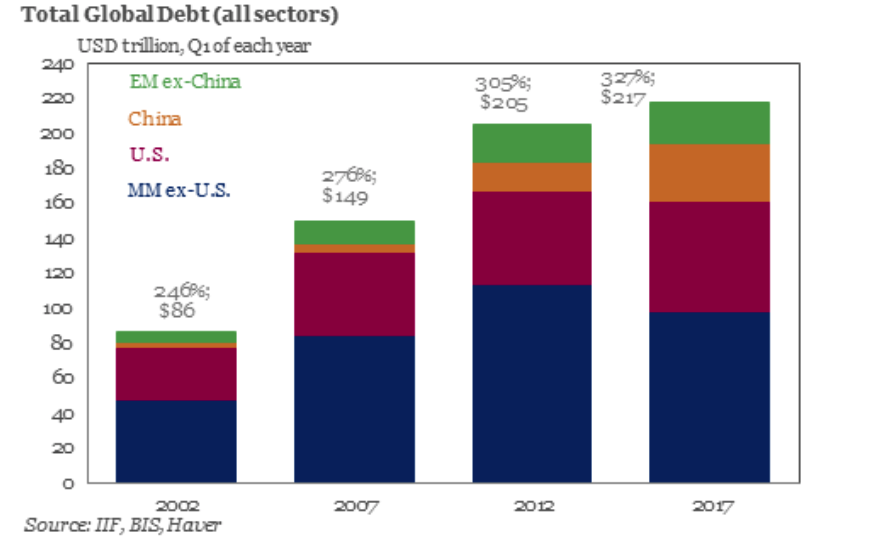
Global debt levels have soared to a record high of $233 trillion, according to the Institute of International Finance (IIF).
Since the end of 2016 to the end of Q3 2017, the total debt incurred by the household, government, financial and non-financial corporate sectors increased by $16 trillion. A major increase in just nine months.
The institute reported that the rise was splitbetween $63tn in government debts, $58tn in financial, $68TN in non-financial and $44tn in household sectors.
Just consider for one moment that prior to the financial crisis global debt was only around $150 trillion. How have we managed to add over $80 trillion in less than a decade?!
On a country-by-country basis both the UK and US saw worrying data when it came to their own levels of consumer debt.
Here in the UK personal borrowing on credit cards, loans and car finance, is now outpacing the rate of growth in UK pay five-times over.
In the US consumer credit jumped by its highest in two years, by 8.8% in November to $3.83 trillion.
Countries that saw a major increase in non-financial debt wereCanada, France, Hong Kong, South Korea, Switzerland and Turkey, all saw all-time highs. Debt is increasing not because low-earners are borrowing more, but data is showing that increasing numbers of middle-class earners are driving up levels of leverage.
Why would those in usually stable jobs and comfortable earning levels be driving themselves into debt?
UK middle-class pushing up borrowing levels
UK personal debt is now rising at almost five times the rate of growth in UK pay. According to debt charities, many families are now living on the colloquially termed never-never i.e. they rely on the prayer that they can keep transferring debt and therefore never repay it.
These are not all people who have directly suffered from the financial crisis by losing their jobs or losing their homes. Many are suffering from the repercussions of the solutions to the downturn. According to StepChange the majority of those they help are employed, some even have senior roles and one in five are homeowners.
Last year credit card debt levels grew at their fastest rate in 11 years. In April alone £606 million was put on plastic. Previously the Bank of England and other organisations have not expressed too much concern about the ability of households to pay this back. Until now that is.
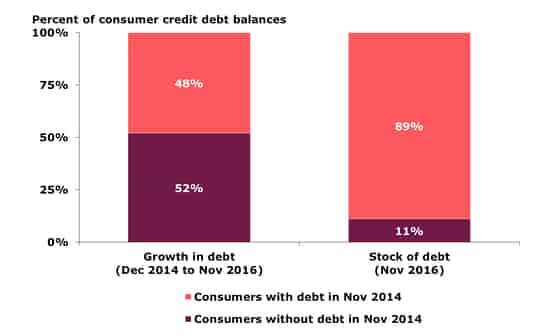
This week a report by the Bank of England and FCA, stated that British consumers are trapped by credit card debt for longer than previously thought.
Nine out of every £10 of outstanding credit card debt in November 2016 was owed by people who were also in the red two years earlier, according to the study.
The analysis follows the rapid growth in personal borrowing on credit cards, loans and car finance, now rising at almost five times the rate of growth in UK pay. Households are finding themselves increasingly squeezed by meagre earnings growth and rising inflation, as the weak pound after the Brexit vote pushes up the cost of imported goods.
Bank data shows personal debts have risen to the highest level since before the credit crunch, reaching more than £200bn with credit cards accounting for more than £70bn of the total.
Households are also facing a year of stagnant real earnings growth in 2018, which may push them further into debt should they wish to maintain their living standards.
Writing on the Bank Underground blog where Threadneedle Street staff can air their views in public the officials said: Although a consumer may clear their debt on one credit product, it is not uncommon for them to remain in debt as they transfer balances, take out new credit products or draw down on existing credit lines, such as credit cards.
US consumers feel confident to borrow more
The US Federal Reserve had a notable 2017 given their actions to both reduce their balance sheet and increase interest rates. One would have thought that an increase in the cost of borrowing would have given consumers pause for thought when it came to taking out loans.
This was not the case. In November 2017 consumer credit grew rapidly by $28.0bn in November. This was the largest gain in 16 years, according to Nomura. In the month previous it had climbed by $20.5bn.
Nomura, reporting on the data, pointed to the figures as if they are a sign of strength in the economy This appears consistent with a strong labor market with low unemployment and elevated consumer confidence, which we expect will continue in the near term.
In the US consumer spending accounts for roughly 7-0% of the economys activity. Last month surveys showed that American shoppers are feeling increasingly confident in the state of the countrys future. Early holiday reports suggest spending did not take a hit. However it was big loans such as student and auto which accounted for the major leap in debt levels.
So, if student loans accounted for a near $16.8 billion leap in the countrys spending, can one really argue that the increase is thanks to confidence levels. To me that sounds like a form of borrowing which is thanks to necessity rather than confidence.
Soon those student loans will need to be paid back, in an economy which is not currently creating that many jobs for graduates.
The student debt bubble is not a new phrase. It is something that has been reported on widely but with the logic that if we talk about it loud enough it might just skulk away and not rear its head. We should be so lucky.
It is worth noting that over the past 10 years the amount of student loan debt in the US has grown by 170 per cent, to a whopping $1.4tn more than car loans, or credit card debt.
In America, 44m people have student debt. Eight million of those borrowers are in default. Thats a default rate which is still higher than pre-crisis levels unlike the default rate for mortgages, credit cards or even car loans. Rising college education costs will not help shrink those numbers. While the headline consumer price index is 2.7 per cent, between 2016 and 2017 published tuition and fee prices rose by 9 per cent at four-year state institutions, and 13 per cent at posher private colleges.
This is not something that can be magicked away by economic growth. Investors are worrying about their portfolios thanks to a financial crisis caused by rising, unsustainable debt levels. We appear to be in the same, if not worse, position that got us here in the first place.
Rebalance to combat global imbalance
These raging debt levels, whether government or consumer, are clearly unsustainable. These figures should serve as an indicator to investors that now is the time to look at their portfolios and rebalance them for this unbalanced world.
A shift from risk assets to safe haven assets such as gold and silver bullion seems to be a timely move, right now.
The concern with debt-levels such as these is that they end up scuppering the period of accelerated growth in global GDP, that we are currently witnessing. At the moment this high growth is the only way central banks and governments can justify the high levels of debt.
Central banks are obviously keen to start reigning in their balance sheets as well as increase interest rates. Unsustainable levels of debt could force them to park these plans should debtors begin to struggle with repayments.
This is quite the vicious circle. As we all know it was low interest rates which propelled such a highly-leveraged situation in the first place. This is an unsustainable path, something the central banks have become aware of all too late but now it seems theyve buried themselves in real deep red hole.
Needless to say the future of global growth has been built on the Emperors New Clothes of foundations. There is little value really propping up an economy when it relies on its citizens drowning itself in debt in order to keep the charade going.
Theres little we can do to prevent individuals wracking up credit card debts or buying cars on finance. All we can do is prepare our portfolios for when the world realises that its standing on thin air.
Gold that is held in a segregated, allocated portfolio is a key way to protect your savings from counter-party risk in the financial system. Golds performance in 2017, along with low gold liquidations, increased demand for gold coins and bars and central bank purchases suggests that gold buyers have identified that this really is all a mirage.
It is obvious from both political and economic events that the global economic crisis is not over. Data shows that we are fast approaching circumstances worse than those seen prior to 2008. Sadly no one is acknowledging them and solutions and preparations are not being considered.
The content on this site is protected
by U.S. and international copyright laws and is the property of GoldSeek.com
and/or the providers of the content under license. By "content" we mean any
information, mode of expression, or other materials and services found on GoldSeek.com.
This includes editorials, news, our writings, graphics, and any and all other
features found on the site. Please contact
us for any further information.
Live GoldSeek Visitor Map | Disclaimer
The views contained here may not represent the views of GoldSeek.com, Gold Seek LLC, its affiliates or advertisers. GoldSeek.com, Gold Seek LLC makes no representation, warranty or guarantee as to the accuracy
or completeness of the information (including news, editorials, prices, statistics,
analyses and the like) provided through its service. Any copying, reproduction
and/or redistribution of any of the documents, data, content or materials contained
on or within this website, without the express written consent of GoldSeek.com, Gold Seek LLC,
is strictly prohibited. In no event shall GoldSeek.com, Gold Seek LLC or its affiliates be
liable to any person for any decision made or action taken in reliance upon
the information provided herein.