-- Published: Wednesday, 17 January 2018 | Print | Disqus
By Rambus
My past two weekend reports have armed the investor with ideas for the coming year 2018. This weeks report summarizes those ideas, updates the current PM rally and adds more ideas to the list. It is important to understand the driving force which will fuel the coming bull market in precious metals so I lay it out. I will then focus on what I consider the best risk/reward Precious Metals Royalty company
Sandstorm Gold Royalties.
Previous reports have detailed that we are in the end game of this Economic expansion and bull market in stocks. Numerous interest rate indicators suggest the economy and stock market have further to go before they peak as it appears likely the expansion has about 12-18 months remaining. During this time the FED plans to allow the economy to run HOT with inflation exceeding its 2% target. Mind you this will not be the good kind of inflation as it is likely to manifest itself as stag-flation. Think 1970s.
Eventually the FED will be forced to respond to the threat of galloping inflation by raising rates which will result in pricking the bubble. Thats when things get very interesting, we will pick this theme up below, but first lets analyze the current rally in gold and PM stocks.
GOLD- Puts in an Isolated Low
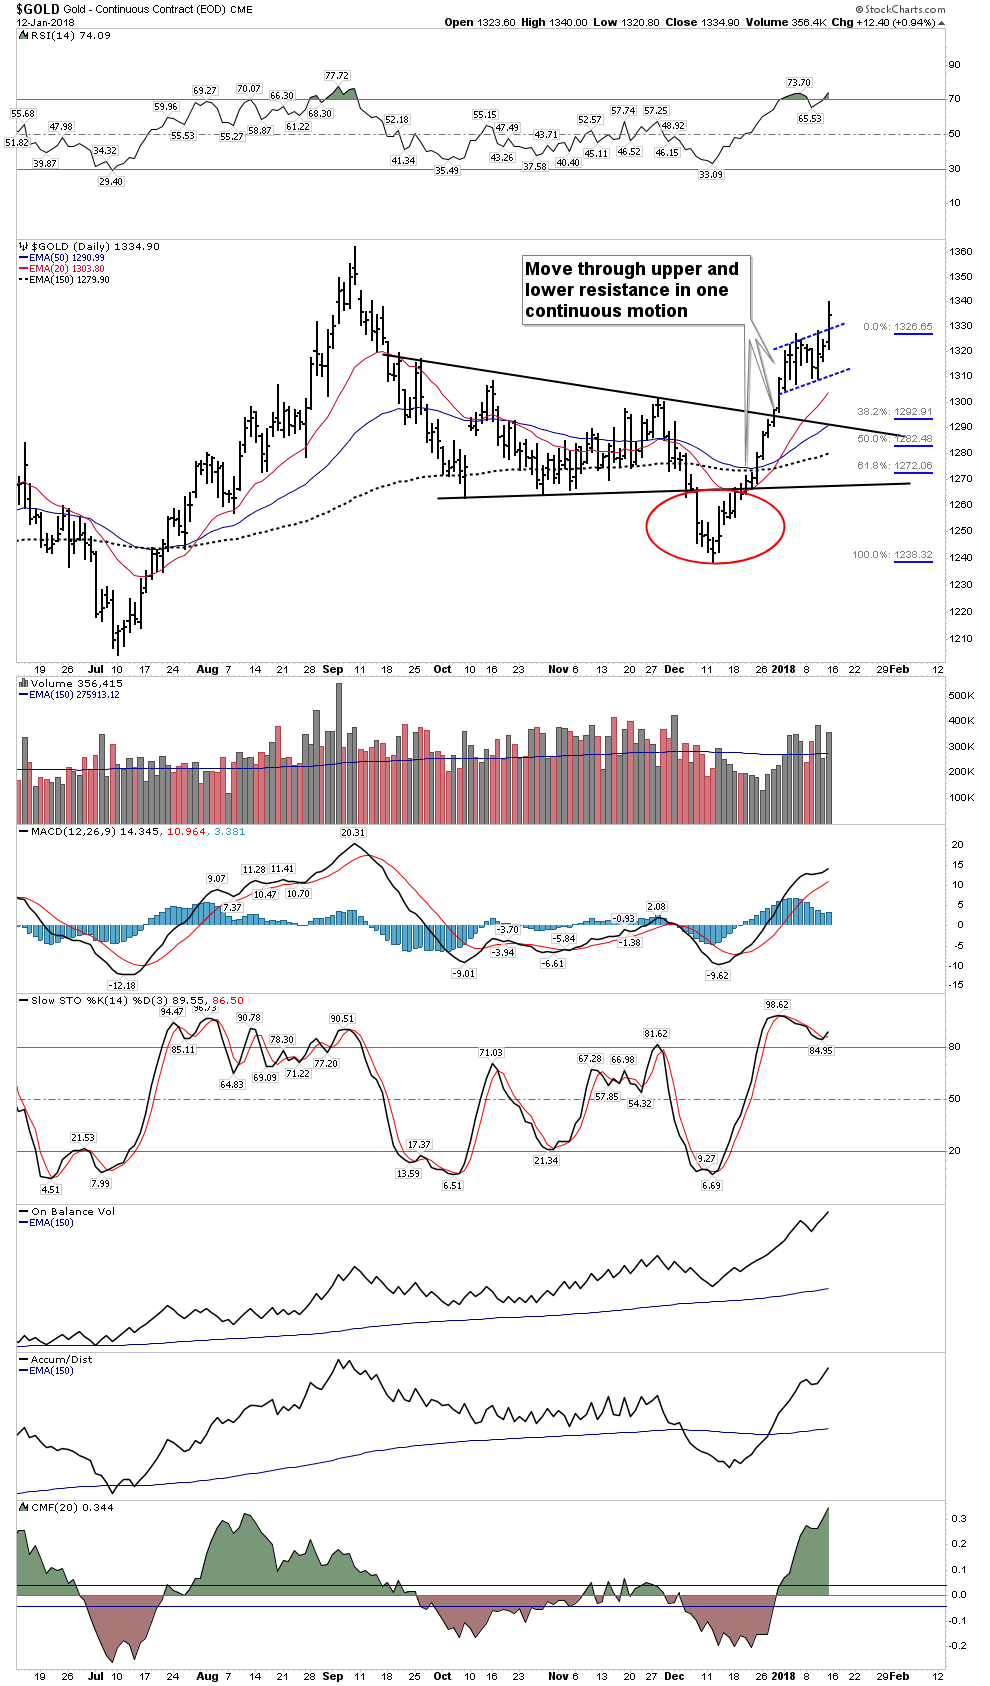
On 12 December gold put in a low of $1238 USD. The tell was the previous days volume was the lowest since August 7th. Very few sellers were willing to sell at that depressed price while others simply stayed home. Furthermore, the COT was generating a major buy signal as commercials used early December to cover their shorts and retail longs finally gave up and sold their long positions. In the chart below we see how gold underwent a 2-week power dive from late November to early December, slicing down through its horizontal contracting triangle.
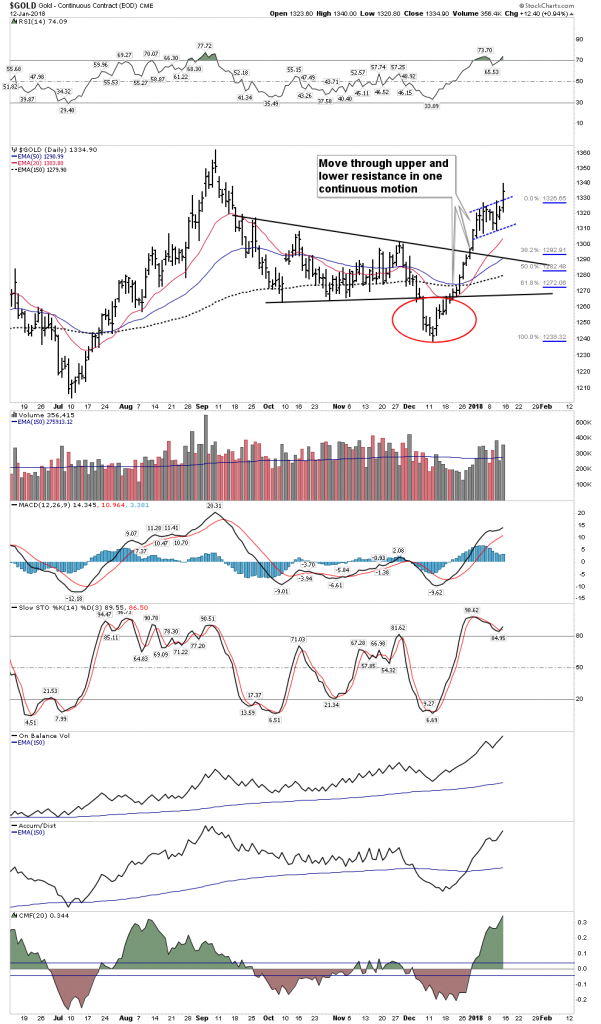
This breakdown was a capitulation move which can now be seen as an isolated low. Gold was now primed for a sling shot move which then ripped up through upper and lower resistance lines without pause in one continuous motion. This past week it paused in a consolidation of the 4-week move but Friday broke out above above it. The consolidation lasted 2 weeks and can be considered an upward running consolidation.
I do not believe this is the beginning of Phase II in golds bull market which started in Dec 2015, however one cannot know for sure this early. It is my assessment that it is simply just another rally within an on going correction of the upside move from Dec 2015-Aug 2016. It is however, a tradable rally which is likely now approaching its halfway point. Late February to early March would be appropriate timeframes for it to end. If this is how it actually unfolds I will be taking profits at that time.
So here is what to look for: The 2-week running consolidation now appears to be over as of Friday. During that consolidation it was essential that any pullback not be any deeper than 50% of the initial move. That level is $1282 as can be seen on the FIB retracements. A daily close below this level aborts the rally. These type of rallies off of isolated lows typically last on average 9 weeks plus or minus 3. That would bracket an interval from 18 Jan-15 Mar. If the dashed running correction bull flag I have drawn resolves into an upside breakout this would be a markedly strong move and could point towards a measured move slightly above $1400. After Fridays action this appears to be the case.
As always I defer to Rambus exceptional charts of the PM sector, but I also post my own below to show a different approach to compliment his work.
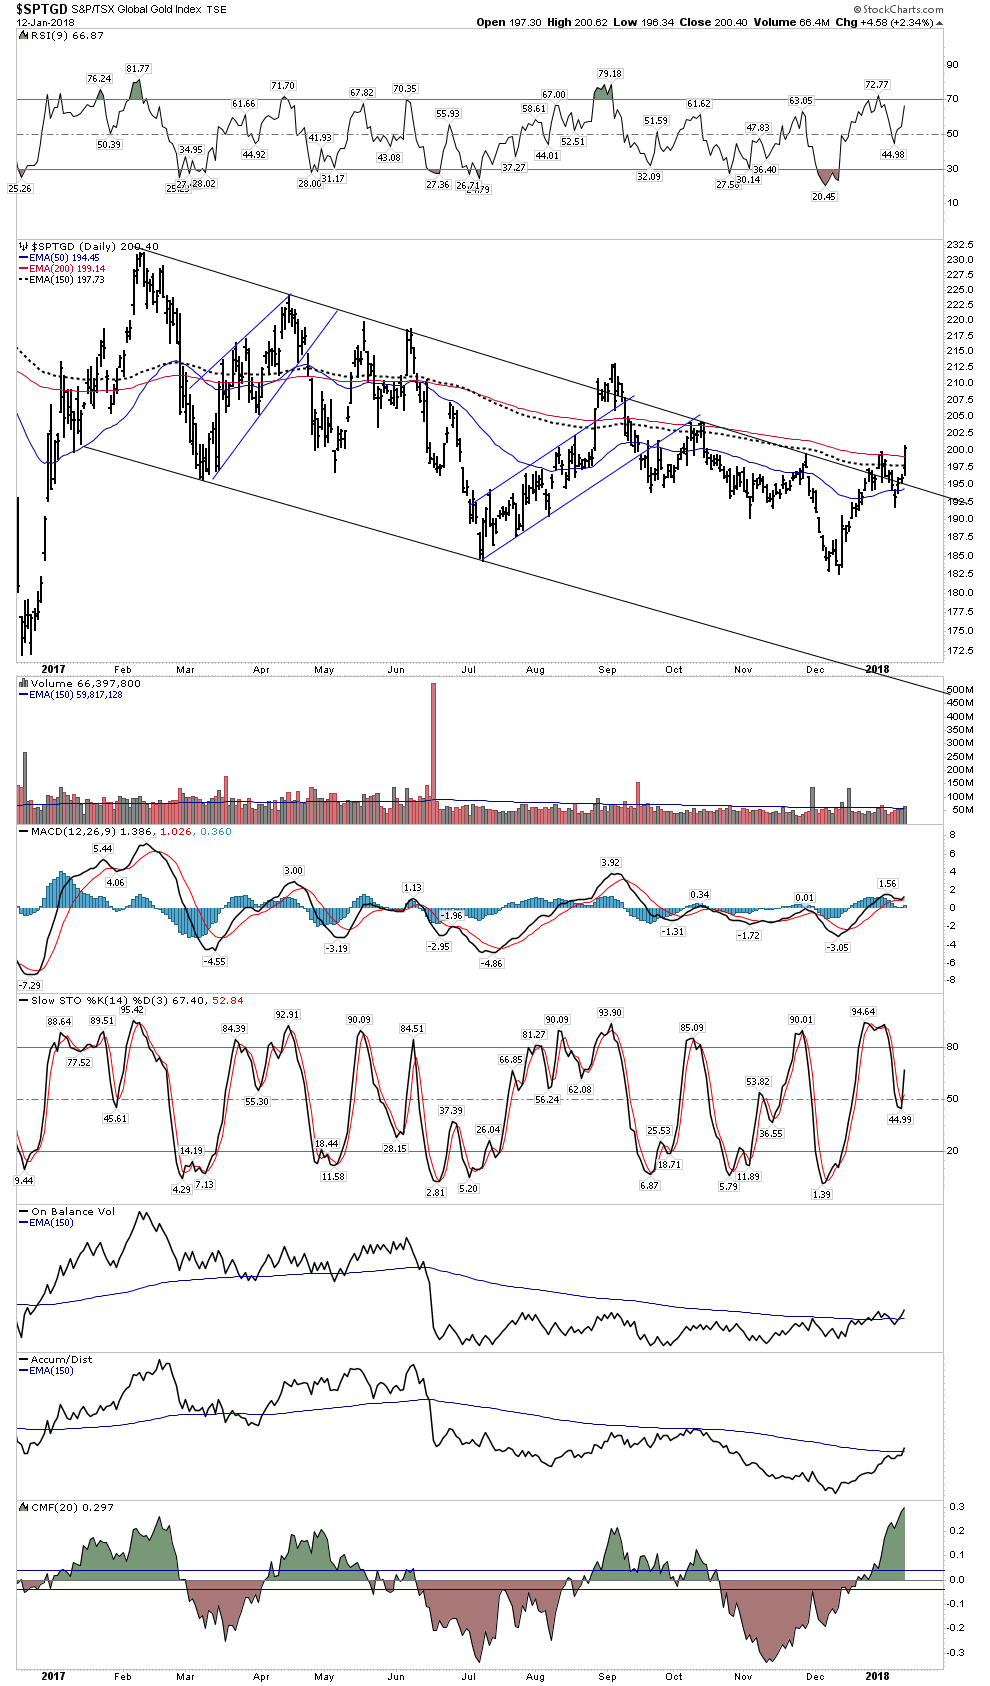
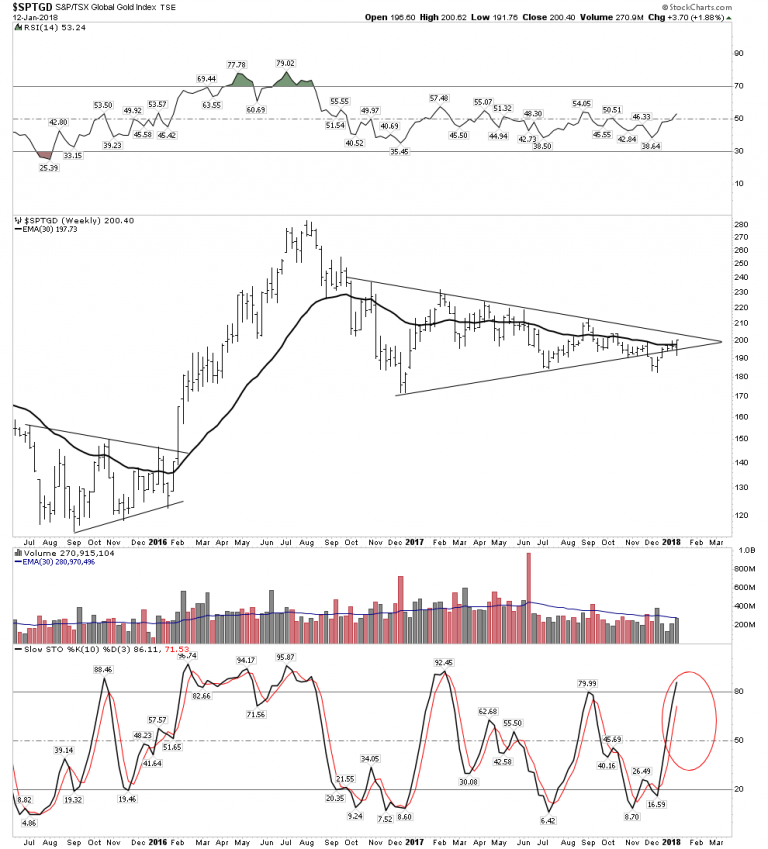
Weekly Global Gold Index- Shaping up for an end around apex breakout?
Daily Global Gold Index- Surged right up through the 200 & 150 EMA in one day:

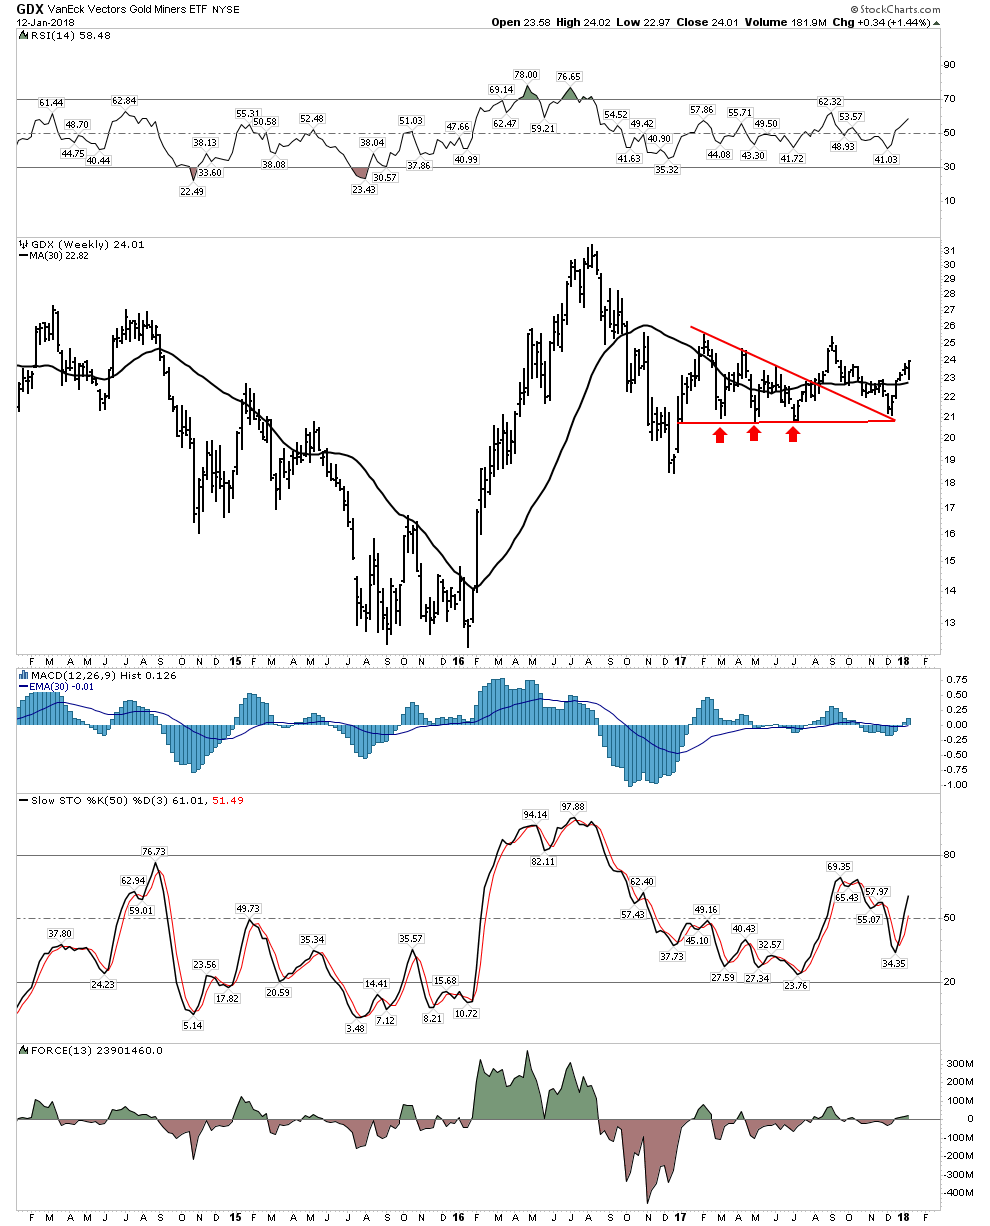
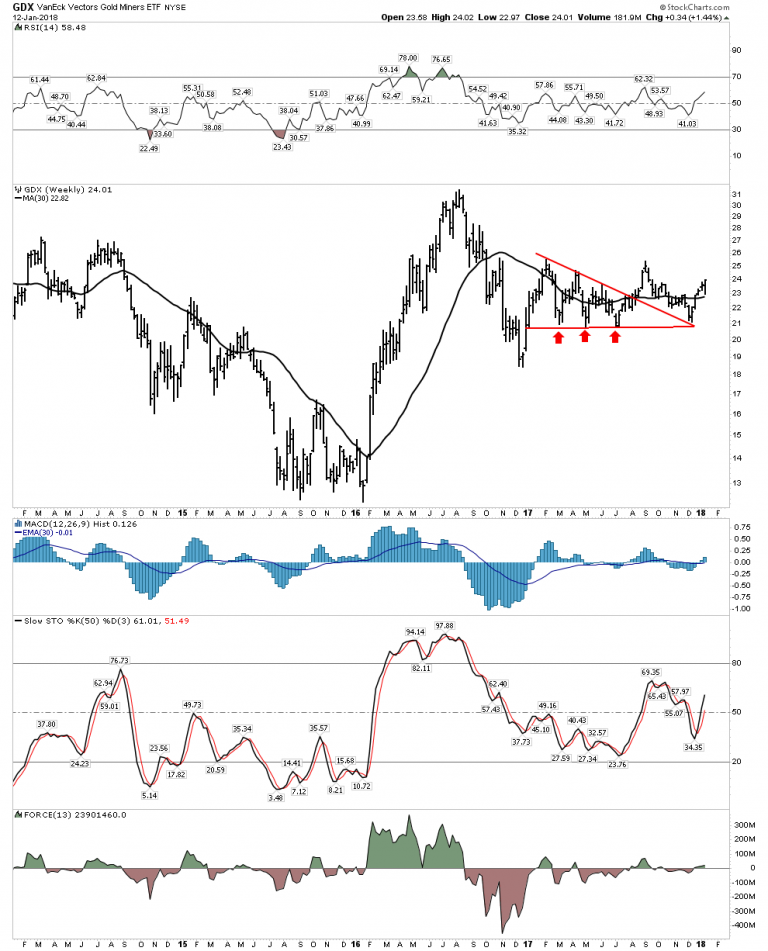
GDX- Fridays action shows the move resuming:
The USD
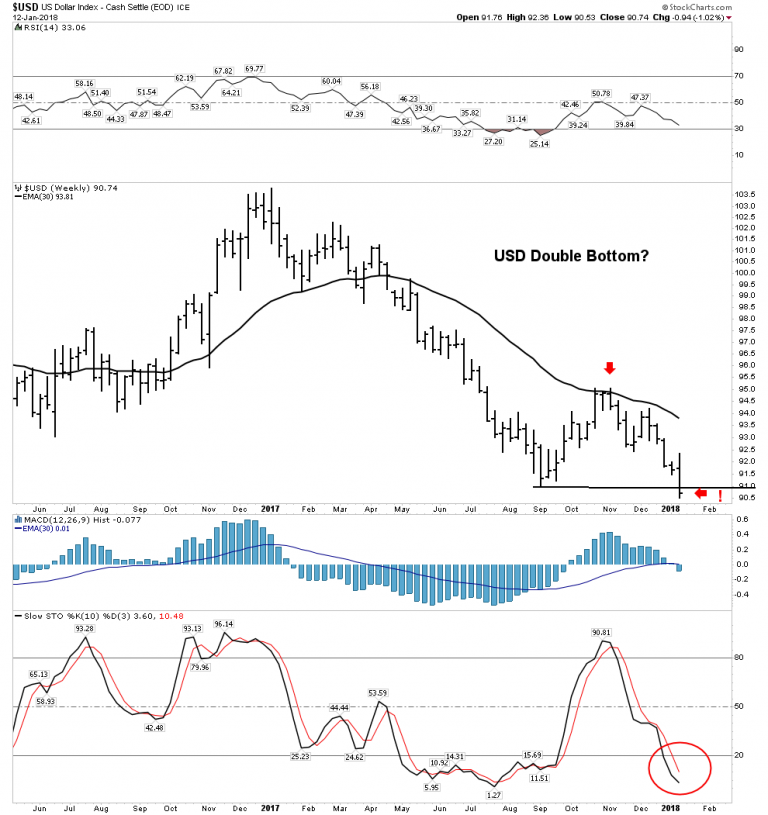
Yes, we all know the ultimate destination for the USD is to lose its status as the world reserve currency and to become simply a regional currency as the British Pound is today. But how it gets there no one really knows. It is my understanding that before it loses its reserve status it will undergo a rally of strength during the post bubble contraction phase after the bubble bursts. I have forecast that the bubble begins to burst within 1-2 years.
Below we see a chart of the USD from 1989-1991 where it reversed a 2 year bear market with another example of an isolated bottom. The pattern we see has similarities to what the current bear market in the dollar shows today. Note the prolonged accelerated decline and the bounce up to the 30 W EMA. This average then repelled three weekly price bars before the price resumed downward. The USD then went on to violate the previous low and put in an isolated low.
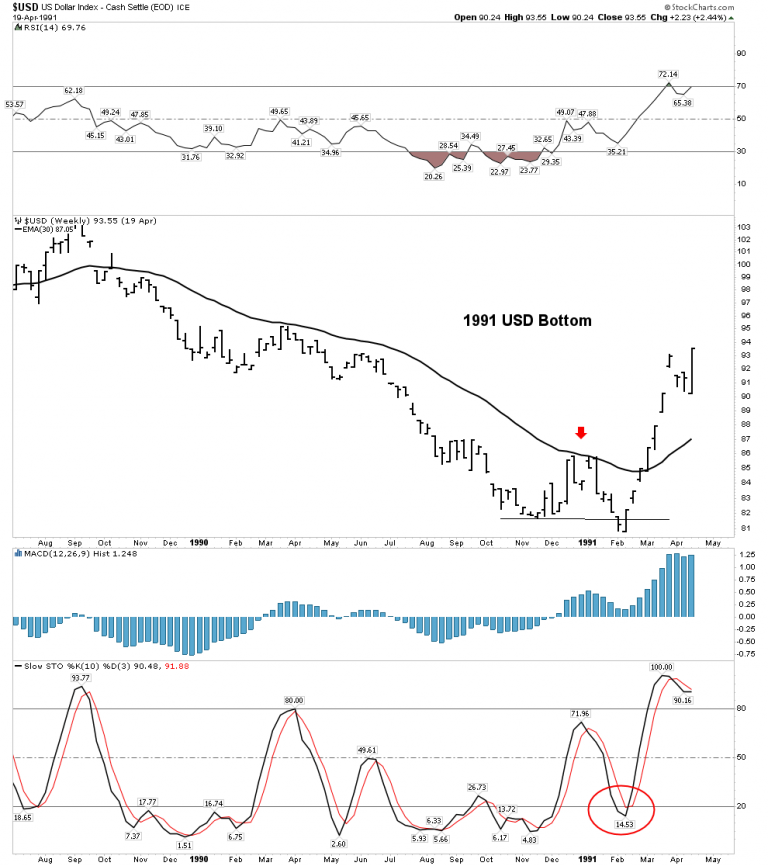
The current chart of the USD has a similar appearance. If the same outcome were to occur it would support the scenario of the gold rally I have described above. Over the next two months a breakdown below previous lows would juice the gold price, perhaps above $1400. However, a bottom in the USD followed by a renewed uptrend would likely crush the existing gold rally. We will be keeping an eye on this as a possible outcome.
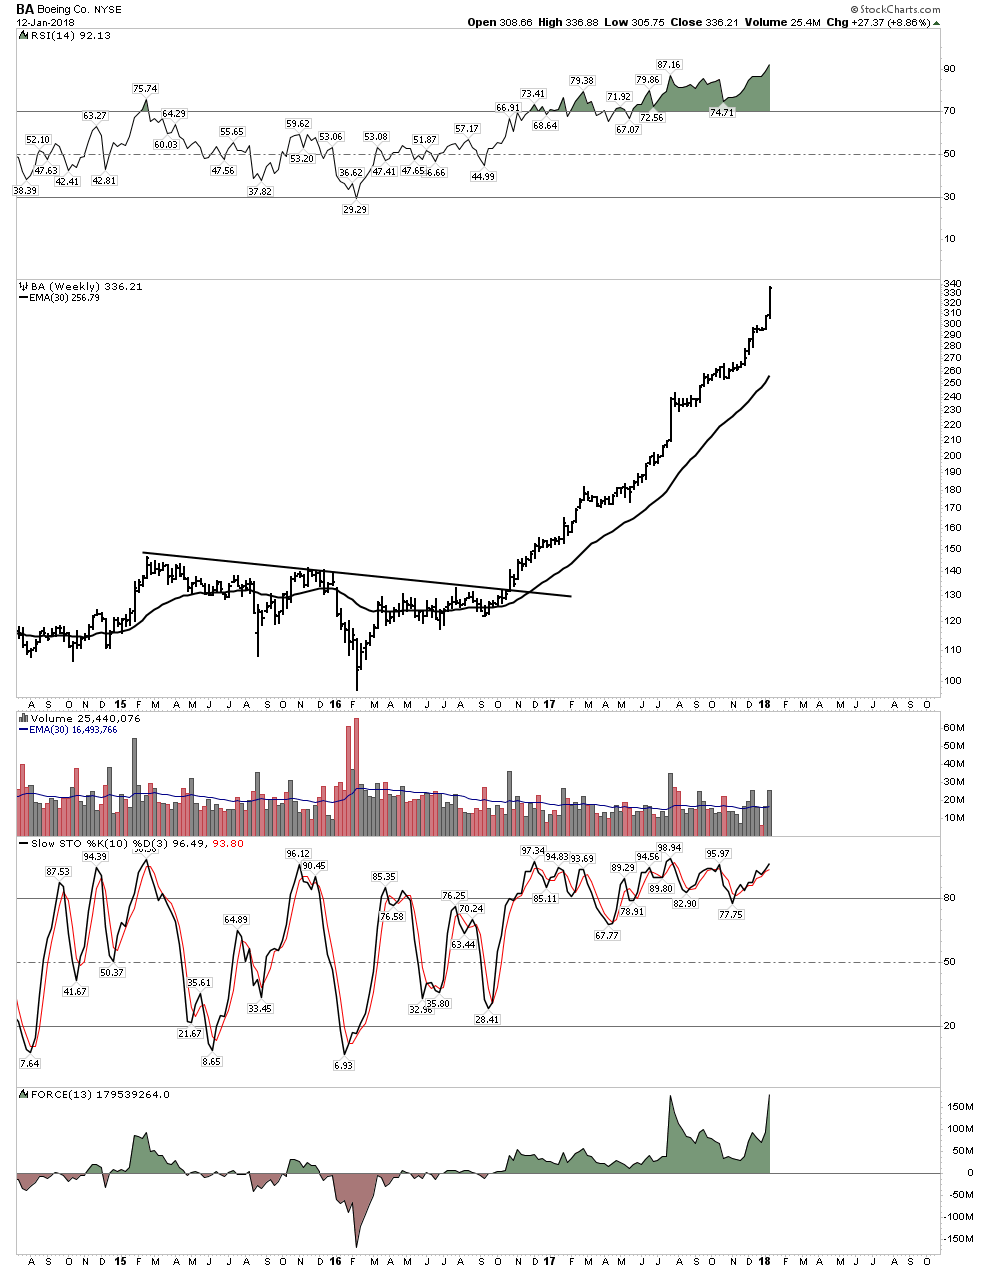
Boeing (BA) is it starting to sniff out a USD devaluation?
Boeing has a historic pattern of declining after the Paris Airshow in June, similar to mining stocks declining after PDAC. Therefore I attempted to short Boeing last summer at the time of the airshow. It was a short-lived unsuccessful trade. Judging by the huge rally in the stock one would think their earnings are going vertical as well, however they are not. So whats behind the parabolic rise in the stock? Maybe its the market sniffing out an eventual devaluation of the USD? Boeing more than any company would profit from such an event. Their product pricing would then have a huge advantage over Air Bus or Bombardier.

Put Your Macro Hat Back On- The Fuel for The Upcoming Bull Market in Gold.
The transition of the USD from the worlds reserve currency to a regional currency will be wildly bullish for gold and the mining stocks.
Gold is historically undervalued relative to the US Governments outstanding debt position. When these debt obligations are finally resolved either through default, inflation or renegotiation, gold will become the prime asset that collateralizes the FEDs balance sheet since the value of its existing collateral made up of its bonds will be diminished. This process will cause gold to rise to levels which the general public cannot remotely conceive of today.
In the next financial crisis gold will serve the role which the CDO fulfilled in the last crisis in 2008. As debts imploded the short sellers used the CDOs as their vehicles to capture the trade. However, those CDOs didnt move until the crisis was well developed. This is why the characters in the movie The Big Short underwent prolonged pain before their accounts finally rose. I suspect gold may perform the same way, with its vertical rise not arriving until late in the sequence since its price is principally determined through paper instruments. However, once the paper is swept away the spring tension will be released. This means that its rise should be instantaneous and could occur literally overnight. This is what occurred in 1934 when FDR reset the gold price and its why one needs to be in the trade early on. Keep in mind that central banks create not only bubbles, but they also create anti-bubbles. The foremost anti-bubble in the world today is of course gold. When the compressed spring gets released in the next crisis it will be too late to acquire a position.
Inflation is Coming
Recall the visual picture of massive FED QE analogous to record snowfall in the mountains. Its not a problem to valley dwellers until the temperature rises. A warming economy (increased monetary velocity) has the same effect, it releases the stored up credit in the economy. Lets look at another visual picture that portrays the process of FED money printing:
A man in the shower initially turns on the water only to get a trickle of cold water. So he turns the knob up a notch
more water, but still cold. He turns it some more
still cold. Finally he turns it all the way and eventually gets scalded with gushing hot water. This is what the FED has done with each QE program, unsatisfied with the result they continued turning the knob. Recall the last turn was called QE to infinity
no different than the man in the shower turning it full hot.
We can now see their efforts unfolding in the charts, the Chartology has set up, inflation is getting ready to bust out. Eventually the FED will respond to it and will prick the bubble.
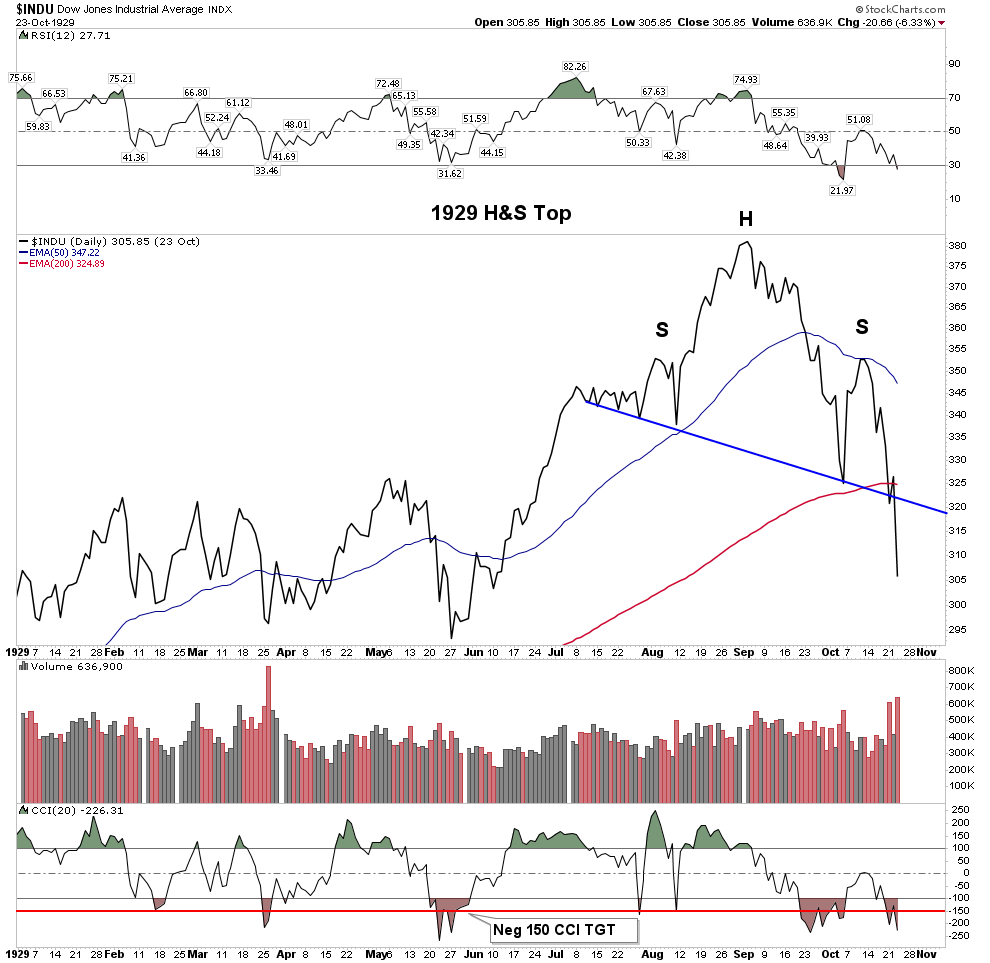
A 1929 Review- Past is Prologue
1925 The FED believed they had abolished panics (sound familiar) so they lowered rates which ignited the boom phase of the bull market. This was done to accommodate the British in their need to stem the flow of gold out of England due to Churchill pegging the gold price too low at the pre-war exchange rate.
1926 Commerce Secretary Herbert Hoover warned of the danger of excessive speculation and excess use of credit.
1927 Benjamin Strong, NY FED chairman again helped the British by lowering USD rates to 3.5% to strengthen the British Pound. He literally referred to this as administering a coup de whiskey to the stock market. It indeed worked!
1928 With speculation getting out of hand by February 1928 the FED changed policy and began raising interest rates.
1929 Paul Warburg, prominent banker, warned that speculative overexpansion invariably ends in overcontraction and distress.
The FED was not able to reign in the excesses as they had now taken on a life of their own. With no remedy provided by any authority the excessive speculation was left to produce its own cure.
The bursting
by August 1929 the FED had raised rates over the past 19 months by 2.5% thus reaching 6.0% This 2.5% rise served to prick the bubble. There was no other outright visible catalyst for the crash of 1929. The overheated, over indebted edifice simply began it implode onto itself.
Other historical bubbles such as the British Railway boom had its bubble pricked in 1845 by the Bank of England when they raised rates from 2.5% to 3%. The worst depression in USA history began with the bursting of the railroad bubble in 1873. The country had been engaged in speculation for the past 13 years leaving it with mountains of bonds that came crashing down ushering in a 20 year depression.
The point here is that prolonged excessive speculation leads to contractions. The FED has been enabling rampant speculation since the mid 1980s starting with Michael Milkens bond orgy.
The FED has been intent on blowing a bubble to induce speculation. This plan is revealed in the below quote taken from FED minutes by none other than the new FED chairman Jerome Powell in this rather shocking revelation:
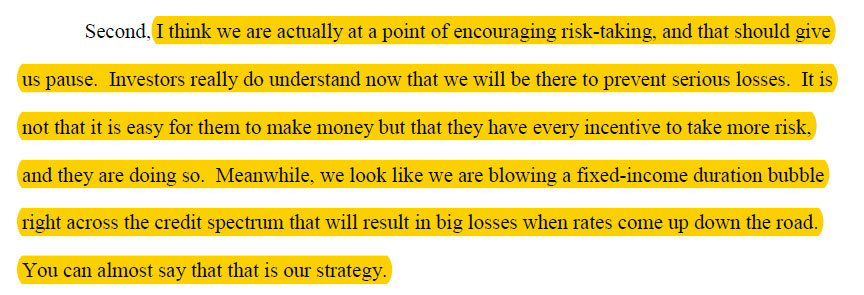
Almost say?
Von Mises made clear that a credit bubble can have only one resolution: liquidation. The historical record bears this out and gold is the only asset one can count on to rise during such liquidation. Credit bubbles run in cycles and they inevitably end. Our keynesian overlords have blown this bubble beyond all historical boundaries. It will deflate, however this time the process could entail an inflationary outcome due to the purposeful devaluation of the USD.
Preparing for the next 10 years
It is now time to prepare for the next cycle. One can ride the tiger of the current stock market and try to jump off at the top, but as I have said
good luck with that, Sir Issac Newton tried that in the South Sea Bubble and lost everything. I prefer to start positioning early with long term buy and hold assets. This requires one to take on non-consensus positions and eventually be proven right. I have said it before, I want everyone to agree with me, only later.
Whenever the next crisis comes it will undoubtedly include a contraction in the economy and the stock market. Its not really hard to imagine how the FED will react. Quite simply, they will buy everything that is not bolted down. The government cannot survive a 1930s style deflationary contraction. Such a contraction would lead to a loss of legitimacy since the government will not be able to fulfill their promises and obligations. The promises of medicare, social security and other social spending can only be met through rising tax receipts. They can accomplish this through inflation which solves their problems. So we see that once the crisis arrives the FED will not choose to fight inflation, instead they will surrender to it.
...
The key to success in the next cycle is to know your companies and to get there early. Once the market starts moving there will be huge initial gains eliminating any chance of a near bottom entry. Its time to saddle up and ignore the naysayers.
https://rambus1.com/
| Digg This Article
-- Published: Wednesday, 17 January 2018 | E-Mail | Print | Source: GoldSeek.com