-- Published: Sunday, 21 January 2018 | Print | Disqus
By John Mauldin
Global Growth Cap
Repeating History
Flying Blind at 20X
China Chills
Sonoma and San Diego
The holidays are fading from memory, and 2018 is off to a good start, economically speaking. Most of the forecasts Ive read expect a good year not a blockbuster year or a horrendous one, but a mild pickup that ought to satisfy investors. Even the bears seem less confident than usual.
The holidays are fading from memory, and 2018 is off to a good start, economically speaking. Most of the forecasts Ive read expect a good year not a blockbuster year or a horrendous one, but a mild pickup that ought to satisfy investors. Even the bears seem less confident than usual.
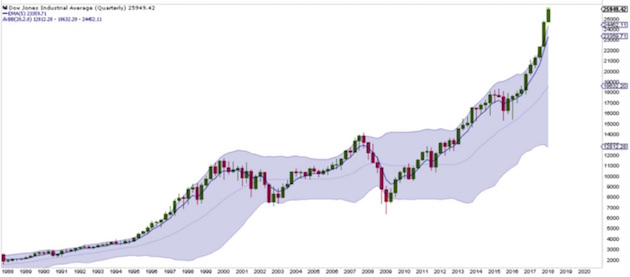
The stock market is off to a rip-roaring start. For the first time ever, the Dow Jones Industrial Average has spent an entire quarter above its upper Bollinger band. That is, its more than two standard deviations above its 21-day moving average. You can click on the link for more detail. This might be a little technical for some of you, but it does demonstrate that theres a great deal of exuberance in the market.
Tony Sagami
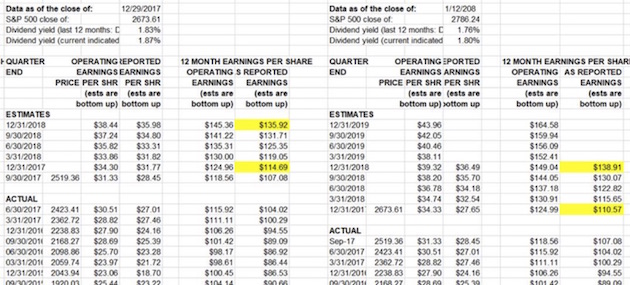
Further, Howard Silverblatt at S&P just came out with his forecasted earnings for 2018 (hat tip Ed Easterling for sending this to me). He revised 2017 earnings down by a few dollars to $110 as S&P analysts realized that companies are going to have to take write-downs for their deferred tax losses. But oh my is Howard positive about 2018. Look at this table straight from the S&P site. Focus on the reported earnings highlighted in yellow. Howard is expecting earnings to grow from $110 to $138 in 2018. That $28 jump in earnings represents about 25% earnings growth. If it actually materializes, the S&P 500 is going to be on a royal tear upwards.
Standard & Poors
The contrarian part of me wants to scream, Aha! No one expects catastrophe, so thats exactly what well get. While I dont completely rule out anything, Ive lived through several recessions and bear markets. This just doesnt feel like another one. I can certainly see a correction in the markets as a possibility, but without a recession we would have a V-shaped recovery, somewhat like 1987s or 1998s. Annoying, but not portfolio-threatening.
In my own forecast (see Economy on a Roll if you missed it), I characterized todays economy in terms of Newtons first law of motion: An object in motion stays in motion until something interferes. I said the force most likely to change this economys course would be an overly hawkish Federal Reserve. However, we wont know the Fed is too hawkish until we start seeing its policies depressing growth in some way. And remember, Fed policy generally acts with at least an 18-month lag time, so we would see the real effects in 2019. So where might we encounter an exogenous (outside) force? Today I have a possible answer, and its one weve met before.
Before we get to it, I want to share with you a short video message on my upcoming 2018 Strategic Investment Conference. Many of the people I have featured in my weekly Outside the Box letter will be presenting at SIC 2018, including Lacy Hunt, David Rosenberg, Louis Gave, and Niall Ferguson. Jeffrey Gundlach, and Mark Yusko are just two of the other luminaries will be sharing their latest insights with attendees at SIC.
I just finalized two of the panels yesterday, and Im excited about them. The first one will be on the social fabric of the US and where the country is headed. It will feature three distinguished guests: Neil Howe, author of The Fourth Turning; Democratic political pollster Patrick Caddell; and the Heritage Foundations Steve Moore. In the run-up to the 2016 election Pat Caddell identified the angst among voters before any other pollster did. But rather than reexamine what happened in 2016, were going to be talking about 2018, 2020, 2024, and 2028. There are trends among the Millennials that have far-reaching implications.
The second panel will focus on cryptocurrencies and will feature John Burbank (who just set up a cryptocurrency fund) and George Gilder, a cryptocurrency fan and a man who has been at the forefront of every technological revolution for the past 30 years. Our own Jared Dillian, who is somewhat of a Bitcoin skeptic, will be moderating the panel. We are finalizing the third panelist.
I really hope you can make it to SIC 2018, held March 69 at the Manchester Hyatt in San Diego. Its going to be a high-octane, intellectually thrilling three days. Heres my video invitation:

Global Growth Cap
Well start with one more 2018 forecast that I havent mentioned yet. The World Banks annual Global Economic Prospects report forecasts that worldwide economic growth will be 3.1% in 2018. That figure breaks down to 2.2% in developed economies and 4.5% in emerging-market and developing economies.
Those numbers arent much different from others, but I bring them to your attention because the World Bank also suggests that we should get used to global growth in the 3% ballpark because it may be stuck there awhile. They believe global output is now approaching its maximum capacity, constrained by rising interest rates and full employment.
These factors are, in turn, the result of demographic and political forces. The world population is aging rapidly, and governments are not well prepared to support large numbers of retirees nor are the retirees well prepared to support themselves. The populations of many countries are actually shrinking. Assorted barriers prevent labor and technology from migrating to the places where they can produce the most output. Unless something changes, the World Bank thinks the global economy will grow more slowly going forward than it has in the last 2030 years much as weve seen happening in the US the last few years.
Of course, 3% growth isnt disastrous. It is far better than the subzero growth phases (i.e. recessions) weve come to expect every decade or so. We dont need the great years as much if we have fewer bad ones but I doubt the central banks will give us that happy outcome. They have models to follow.
Add constrained growth to the global picture and it looks less attractive. If the World Bank is correct that were near maximum output, nothing the Fed and its peers do will help very much. But they can still do things that hurt, and they almost certainly will. What might those missteps look like? You may already know.
Repeating History
History never repeats, but sometimes it rhymes. The trigger for our last recession and financial crisis was an excessively leveraged US housing sector. Other factors contributed, but home mortgages and housing speculation were at the core. So its easy to assume that the next crisis, whenever it comes and whatever causes it, wont be about housing.
That may not be right, though. While US homeowners and lenders learned some hard lessons in the last crisis, and while I dont see that kind of exuberance this time around in the US, I do see signs of it elsewhere. Canada is the most obvious case, but also Australia and parts of Asia and Europe.
Imagine this: Rising interest rates and reduced foreign capital flows combine to push housing prices down in places like Vancouver. Leveraged players who own speculative homes start to liquidate their properties, pushing prices down further. Banks find themselves holding properties they neither need nor want. The dominoes begin to topple.
So we might have another housing-driven crisis, but starting elsewhere. It would still affect the US, but differently from last time. Our healing ointment could turn out to have a fly in it.

Getty Images
Flying Blind at 20X
The housing sector has two characteristics that lead to these problems. First, its highly leveraged. In the US its common for people to buy houses with only 5% or 10% of the purchase price in cash, leaving the buyer instantly leveraged 10X or 20X. Thats asking for trouble even if the sale price is fair, and its often not.
Price is the other rub. Houses are illiquid because transactions occur infrequently and each property is unique. They arent like shares of stock. You can look at tax valuations and appraisals, but those are estimates. You cant really know a houses value until you try to sell it.
Flying blind at 20X leverage is not the ideal way to learn about investing, but thats how many Americans do it. Weve even convinced some of our closest neighbors and allies to adopt our ways. Last week Josh Steiner of Hedgeye kindly sent me a slide deck he assembled on housing in Canada, Australia, and the US. It was a revelation. Consider the following chart. Note the sidebar: On a relative basis, broker commissions and other ownership transfer fees have now eclipsed levels reached during the US housing peak. Those fees are now 3% of Canadian GDP! Really? How is that producing anything other than income for brokers?
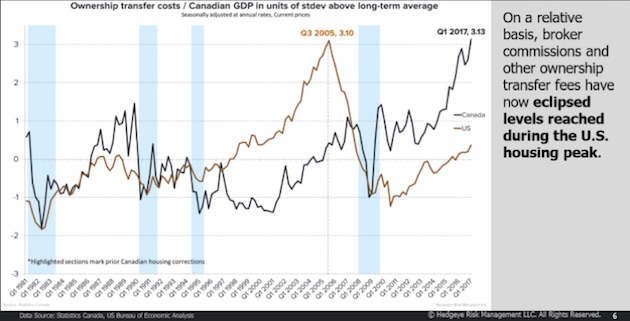
Hedgeye
The two lines represent real estate transaction costs in the US (brown) and Canada (black), as a percentage of GDP. We see that the costs peaked in the US in late 2005, then fell rapidly the next couple of years as the economy tumbled into recession.
Canada was less exuberant at the time; but, post-recession, housing in Canada climbed far faster than it in the US. By early 2017, Canadian homebuyers and sellers were spending as much on housing, relative to their economys size, as the US did at its 2005 peak. Meanwhile you have the Bank of Canada raising rates, slowly but surely. This seems like an ominous combo.
Now, you could argue that Canada has something the US didnt: cash-bearing Chinese buyers. Those buyers might make higher interest rates less harmful to home prices. True enough, but other things could discourage prices. Well come back to that later.
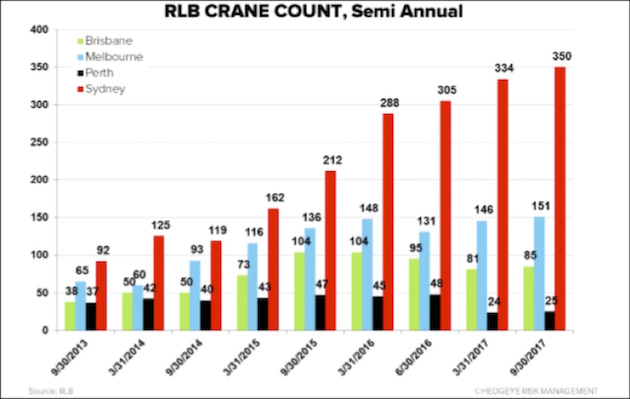
The situation in Australia is even crazier, at least as Josh describes it. He works with an indicator that never occurred to me: crane count. The number of cranes operating in a city and the kinds of properties they are being used to build turns out to be a pretty good measure of housing activity.
The chart below shows the crane count for Australias four largest cities. As of three months ago, Sydney alone had 350 cranes being used to build high-rise residential properties. Thats more cranes than were deployed in all of North Americas twelve largest cities. Construction is booming in Australia. In fact, the comparison is even more stark. On a per capita basis, Australia has 14.6 times as many residential construction cranes working as North America does.
Hedgeye
It gets crazier still. Australians engage in negative gearing. For tax reasons, people intentionally buy investment property that produces losses. We do that in the US, too, but we have ways to keep cash flow positive even as properties produce tax losses. In Australia, investors get interest-only loans to buy properties, then rent them for less than the loan payments and absorb the difference. They think they will make it up by selling at a profit.
Josh Steiner describes it this way:
Negative gearing is (and should be) a truly bizarre concept to an investor, but it makes perfect sense to most Australians because home prices have only gone up for the last 25 years. There is a pervasive and genuine belief that they cant lose.
If this is right (and Im sure my Australian readers will tell me), it will likely end in disaster. But actually, I get why younger Aussies might think this way. Those under 40 have never seen a recession in their adult lives. They have seen a resource-driven boom as Australia exported staggering quantities of raw materials to China. That incoming cash kept the country afloat even as others sank. Its easy to think that condition is normal if youve never known anything else.
Good times never last forever
which brings us to China.
China Chills
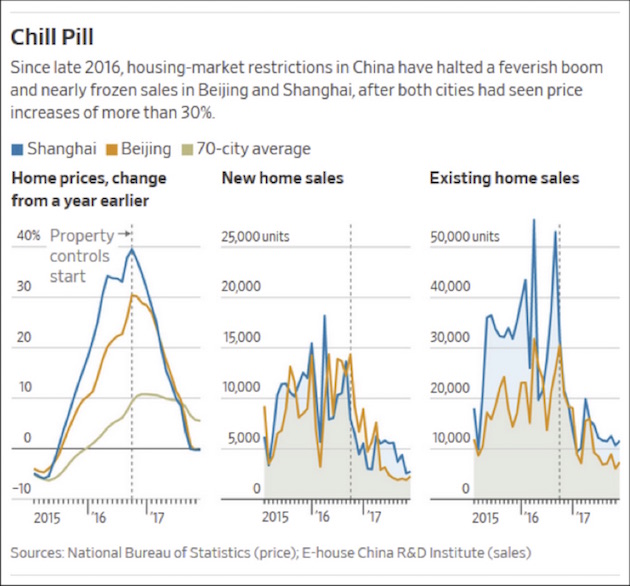
People have been predicting Chinese real estate crashes for years. Eventually they will be right. Is that time approaching? Heres the lead from a January 16 Wall Street Journal story, Chinas Hot Housing Market Begins to Cool.
BEIJINGChinas housing market has defied gravity and government restraints for two years, floating on a tide of bank loans and speculation. Until now.
In Beijing and Shanghai two of the countrys largest markets and other megacities, sales have stalled and prices have dropped, falling slightly in some pockets and dramatically in others.
Demand has dried up in these areas as a result of government measures including higher mortgage rates, higher down-payment requirements and limits on buying a second or third home. Would-be sellers are increasingly putting plans on hold in hope that prices will rebound.
That doesnt sound good at all. WSJ backs up the gloomy language with data, though:
Hedgeye
Some of this shake-out is happening by design as the government tries to manage growth on a sustainable path. The picture also varies greatly by city and region. Beijing and Shanghai are Chinas equivalents of Washington and New York except that they are much, much larger. What happens to them affects the whole country to some degree and other countries, too.
By some estimates, Chinas property market accounts for a third of GDP growth. Falling construction activity will mean less need to import construction materials from Australia and maybe fewer Chinese buyers in Canada. Falling demand wont be good for housing prices in either of those places.
Then there are wild cards. President Trump has so far held back on promises to crack down on trade with China, in part because he wants Beijings help managing the North Korea issue. I doubt he will wait forever. He has a lot of latitude to impose tariffs, quotas, and other restrictions on China. Ironically, a peaceful resolution on the Korean Peninsula might be economically negative if it removes a barrier to trade war.
We havent even talked about housing in the UK or in Europe. London home prices are crazy and have been so for years. Ditto for many places in the EU. The European Central Bank is still accommodative for now, but it wont be forever. Between higher rates and fewer oligarchs buying mansions, Europe could see trouble, too.
As I said earlier, the housing market is inherently opaque. We can look around and see craziness everywhere, but it can get crazier still. Calling the top is hard. It took a couple of years for the US carnage to become obvious last time. I dont foresee imminent disaster, and its possible these international markets will deflate gradually and not spark a crisis. But given the propensity of central bankers to overplay their hands, the risk is significant.
And that takes us back to the very beginning of the letter. The World Bank is forecasting roughly 3% global growth. If some of the main drivers of global growth experience recessions, that is going to slow growth and reduce US exports and total global trade. And analysts are going to have to reduce those projected earnings I highlighted at the beginning of the letter.
Plus, if the Federal Reserve insists on raising interest rates in that environment, while reducing their balance sheet and slowing the growth of M2 and the monetary base, they are going to be effectively tightening monetary policy in the US far more than by simply raising rates 75 to 100 basis points.
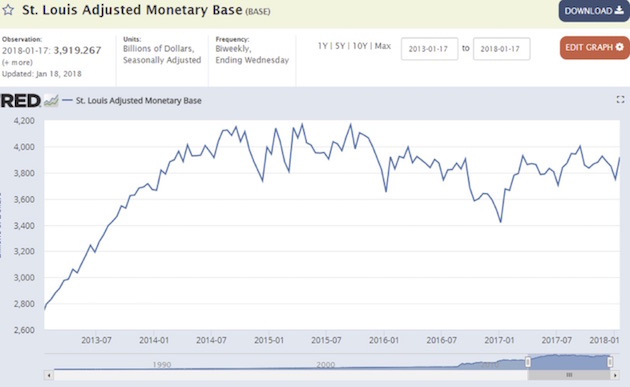
Federal Reserve Bank of St. Louis
A lot of factors go into the monetary base. When the US Treasury deposits or removes money from its account at the Fed, that changes the monetary base. When you take money out of your bank and or put it in, that affects the monetary base. Same for large corporations. The monetary base is an exceptionally noisy set of data. But in general, we can see that each Federal Reserve rate hike has reduced the monetary base by about $50 billion over time. If the Feds tightening trend continues (and there are very good reasons to think that it could actually increase), we could see another $150 billion reduction in the monetary base.
In addition, this latest federal tax cut is deficit-financed. The Treasury is going to have to borrow an extra $150 billion in addition to the deficit thats already in the budget. And that figure assumes they receive the increase in revenue they are expecting from the tax cuts and from growth. It remains to be seen whether they will actually see additional revenue; I expect more people than they think are going to game the system. That is just what taxpayers do.
(I can guarantee you that I am sitting down with my accountants, and we are trying to figure out what we can do to reduce my taxes under the new law. Whatever actual tax cut I can get is going to have to be used to pay the additional taxes Im going to owe from the loss of deductions of state and local taxes. Right now, unless we can figure out how to game the system, my actual out-of-pocket tax bill will be about the same.)
Further, the Fed is going to reduce its balance sheet $60 billion this quarter, $90 billion in Q2, $120 billion in Q3, and $150 billion in Q4. They have already said they are not going to discuss that issue further in FOMC meetings, so those amounts are baked into the cake. That is an additional $450 billion out of the monetary base.
Im not going to get too wonkish on you here, but those reductions in the monetary base are going to have an effect on the M2 money supply. The growth rate of M2 is already down from its normal 7% to around 2%. The Fisher equation basically tells us that GDP is equal to the money supply times the velocity of money. It is not entirely out of the realm of possibility that the growth of M2 will go negative. Unless there is a corresponding increase in the velocity of money (something we have not seen for a long time), that negative monetary growth could spell an actual recession.
The moves the Fed is making are flattening the yield curve. With all of the monetary background noise that Ive been detailing, it is not entirely clear that the yield curve will remain positive. The Federal Reserve seems unconcerned that quantitative tightening will have the opposite effect that quantitative easing did. I have seen no work or research from the Federal Reserve on that topic. I know I have said this before, but I just dont see the fire that the Fed is so intent on putting out. I can understand their reasoning for raising rates, but I dont understand why they have to reduce their balance sheet at the same time.
The factors Ive reeled off are not going to produce a recession in 2018 (at least I dont think so), because monetary policy acts with a long lag time. But Republicans are not going to be very happy if they see a recession in 2019 or 2020, as there will be no time to make any corrections before the 2020 election, and they will get blamed. That you can take to the bank. And Trump wont be able to pass the blame to the Fed, because it will be a Fed that he appointed.
All that said, every time I have a conversation with manufacturers or folks in construction, their biggest complaint is they cant get enough workers. Businesses are booming all over this country. A great deal of that activity stems from the reduction in regulations and from the less stringent enforcement of regulations on the books. It is making a difference. And while I may moan about tax cuts not helping me, those cuts are going to make a big difference to people at the lower end of the income scale; and, more importantly, they are going to make a big difference to corporations.
Maybe, just maybe, we could actually see some expansion in capital expenditures, especially as a lot of overseas money comes back to the United States. That influx will be a one-time major boost to tax revenues!
So I still think we approach 2018 feeling relatively optimistic but just watch the Fed, the yield curve, the velocity of money, and M2. It is not entirely out of the question that the Fed might reverse course and decide we dont need as much tightening as they had planned on. I keep trying to figure out where all this inflation is going to come from. Maybe from energy prices in the short term, but wage inflation? That just doesnt appear to be happening yet. Lets hope it does higher wages would be a good problem to have.
Sonoma and San Diego
I will be in Sonoma with my friends at Peak Capital in late February and then of course in San Diego for my conference, where I will arrive a few days early and maybe stay an extra day just to relax from the adrenaline rush.
I had an extraordinarily good time in Boston, meeting first with my Mauldin Economics management team, Olivier Garret and Ed DAgostino. They started out with good news on the revenue front, which of course made me happy; and then I could see they were a little worried about what they were going to say next. They really did have some significant changes they wanted to implement, and I think they were pleasantly surprised that I not only agreed, I was quite enthusiastic about what they proposed. One change is that we are going to be sending you fewer items to your inbox. Every piece of research we do shows that everybody is overwhelmed with the amount of material they are getting, and we are going to try to make sure that when you get something from us it is of really high quality.
One thing that will not change is that Thoughts from the Frontline will still be free, and they are going to help me readjust my schedule so that when you wake up on Saturday morning, the letter will be in your inbox, the way it was back when I first wrote TFTF, some 18 years ago.
The publishing industry has changed dramatically over the last 40 years. I have been involved in one aspect or another of that industry for that whole span of time. I obviously enjoy writing and publishing, or I would have given it up years ago.
Most of all, I enjoy meeting readers everywhere I go. When I sit down to write, I imagine that I am writing to one person you and Im just talking to you as a friend, sharing my thoughts. I really do feel that personal connection. And I enjoy reading your responses and trying to incorporate them into my thought process. Thanks for being one of my readers and, more importantly, my friend.
And with that I will hit the send button. Have a great week!
Your enjoying being optimistic analyst,

John Mauldin
subscribers@MauldinEconomics.com
Copyright 2018 John Mauldin. All Rights Reserved.
| Digg This Article
-- Published: Sunday, 21 January 2018 | E-Mail | Print | Source: GoldSeek.com


