-- Published: Monday, 12 February 2018 | Print | Disqus
By Jordan Roy-Byrne
It was a rough week for investors in stocks and stocks of all kinds. The S&P 500 lost 5%. Emerging Markets also lost 5%. Gold Stocks, which had weakened before the broader equity market have been hit hard. They (GDX, GDXJ) also lost 5% last week. The HUI Gold Bugs Index (which excludes royalty companies unlike GDX) lost 7%. After a strong start to the year, gold stocks have essentially given back all their gains. Nevertheless, we remain extremely optimistic on gold stocks over the next 12-18 months as trends in the economy and stock market should begin to support Gold after the second quarter.
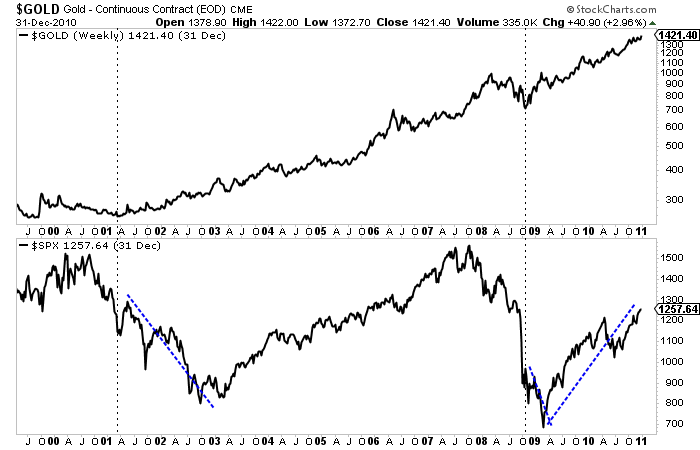
Historically speaking some of the best performance in Gold and gold stocks occurred during or after a bear market in stocks. The best examples can be found in the 1970s and 2000s as the charts show. Gold surged after the bottom in stocks in 1970 and continued to perform very well during the 1973-1974 bear market. After a brief but sharp bear in 1975-1976 Gold rebounded strongly as the S&P 500 began a mild bear market in 1977. Years later Gold emerged from a significant bottom in 2001 while the stock market endured its worst bear market in a quarter century. Gold continued to perform even after the market bottom in late 2002. Gold emerged from the global financial crisis before the stock market but continued to make new highs after the stock market bottomed in March 2009.
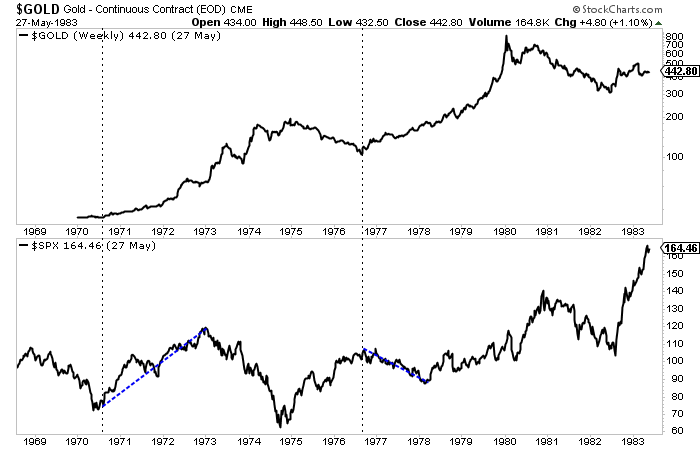
This performance is not just random. It makes quite a bit of fundamental sense. As we know, Gold is driven by falling or negative real rates. Typically policy makers in response to a recession or bear market will pursue policies that lead to falling or negative real rates. These policies are not reversed until the economy gains strength. Gold can also benefit from inflationary recessions, which we saw in the 1970s. Perhaps we are headed for that outcome at somepoint but I digress.
The best comparison to today may be the mid 1960s. Although the Gold price was fixed until 1971, we can use gold stocks to study the macro picture of the 1960s and how it may relate to today.
Gold stocks and the stock market were positively correlated during the 1960s but gold stocks dramatically outperformed and especially from 1964 to 1968. That outperformance accelerated after 1963 as inflation and bond yields began to rise to higher and higher levels in the years ahead. That would soon negatively impact the stock market in both nominal and real terms. The Dow peaked in 1966 while the S&P 500 did not peak until 1973 (as it made marginal new highs in 1969 and 1973). In real terms stocks would peak in 1966 or 1968 (depending on which index you use).

Economic fundamentals appear to be headed in a direction that is bullish for Gold and gold stocks and less positive for the stock market. While inflation has yet to be unleashed, the markets are showing that inflationary pressures are forming. This will impact corporate margins (which are extremely high) as well as profits. Higher inflation also leads to higher bond yields which means higher costs to service debt. That is a problem for the economy and equity market due to the debts that have piled up in recent years.
So the question now is where is the threshold for when inflation and bond yields start affecting the economy and stock market in a way that is favorable for precious metals?
With respect to the 1960s and 1970s, the answer would be 1964.
When precious metals begin and sustain outperformance against the stock market it will signal that the threshold or inflection point has been reached. That outperformance will also go a long way in helping Gold make its major breakout.
It is not yet time for Gold and gold stocks to shine but it is getting very close. Gold remains in a bullish consolidation pattern that should give way to a breakout later in the year. Meanwhile, gold stocks and Silver are lagging badly but that does not have us concerned. The next few months could prove to be the best buying opportunity in precious metals since the end of 2015. Quality juniors that are bought on weakness over the medium term should deliver fantastic returns over the ensuing 12 to 18 months. To follow our guidance and learn our favorite juniors for 2018, consider learning more about our premium service.
Jordan@TheDailyGold.com
| Digg This Article
-- Published: Monday, 12 February 2018 | E-Mail | Print | Source: GoldSeek.com


