-- Published: Thursday, 15 March 2018 | Print | Disqus
By Frank Holmes

As our loyal readers know, at U.S. Global Investors we carefully monitor the price of gold. We pay close attention to the macro drivers moving the yellow metal, like government policy and cultural affinity spurring demand globally. We also monitor the micro drivers, like company management and quant factors that make one gold stock superior to the next.
Goldís qualities make it one of the most coveted metals in the world and a popular gift in the form of jewelry Ė this is what I call the Love Trade. From the beginning of the Indian wedding season in September until Chinese New Year in February, the price of gold tends to rise due to higher demand from the two biggest consumers of gold, China and India.

On the other hand is the Fear Trade, driven by negative real interest rates and the fear of poor government or central bank policies that could result in currency devaluation or inflation. This fear triggers people to buy gold as a hedge against possible negative returns in other asset classes, which in turn, pushes the gold price higher.
Gold in a Portfolio
We believe gold is an essential part of a portfolio due to its history as a protector against inflation. Iíve always recommended a 10 percent weighting in the metal, 5 percent in gold bullion or jewelry, and 5 percent in gold stocks, mutual funds and ETFs.
In fact, current economic conditions make an even greater case for gold. The stock market is still on a historic bull run, and the tax reform bill is helping ratchet up share prices. Itís important to remember that the precious metal has historically shared a low-to-negative correlation with equities. For the past 30 years, the average correlation between the LBMA gold price and the S&P 500 Index has been negative 0.06.
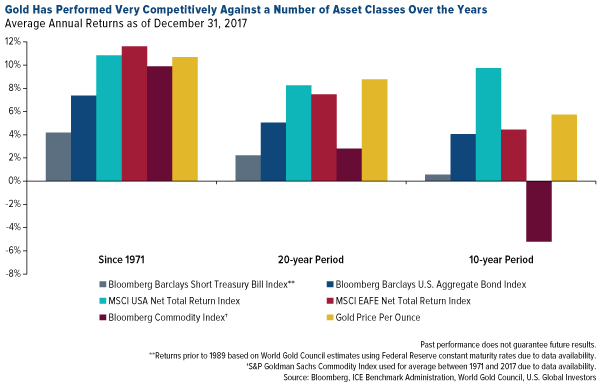
Gold has also performed competitively against many asset classes over the past few decades, as seen in the chart below. This makes the metal, we believe, an appealing diversifier in the event of a correction in the capital markets or an end to the bull market.

click to enlarge
Our investment team brings knowledge and experience in a variety of fields, with one of the most notable being gold. As such, we have written numerous pieces about the precious metal. One of our most popular is the Many Uses of Gold slideshow that outlines eight different uses of gold, other than in your portfolio. From dentistry to electronics and space travel to currency, gold remains widely used in everyday life.
We believe itís important to truly understand the asset class you are investing in, and we hope this slideshow does just that. Explore goldís many uses here!

All opinions expressed and data provided are subject to change without notice. Some of these opinions may not be appropriate to every investor.
The Standard & Poor's 500, often abbreviated as the S&P 500, or just the S&P, is an American stock market index based on the market capitalizations of 500 large companies having common stock listed on the NYSE or NASDAQ. The S&P 500 index components and their weightings are determined by S&P Dow Jones Indices.
The LBMA Gold Price is the global benchmark prices for unallocated gold delivered in London. The auctions are run at 10:30 am and 3:00 pm London time. The final auction prices are published to the market as the LBMA Gold Price AM and LBMA Gold Price PM.
Correlation, in the finance and investment industries, is a statistic that measures the degree to which two securities move in relation to each other. Correlations are used in advanced portfolio management. Correlation is computed into what is known as the correlation coefficient, which has value that must fall between -1 and 1.
The Bloomberg Barclays Short Treasury Bill Index tracks the market for Treasury bills issued by the U.S. government.
The Bloomberg Barclays US Aggregate Bond Index, which until August 24, 2016 was called the Barclays Capital Aggregate Bond Index, and which until November 3, 2008 was called the "Lehman Aggregate Bond Index," is a broad base index, maintained by Bloomberg L.P. since August 24, 2016, and prior to then by Barclays which took over the index business of the now defunct Lehman Brothers, and is often used to represent investment grade bonds being traded in United States.
The MSCI USA Net Total Return Index is a market capitalization weighted index designed to measure the performance of equity securities in the top 85% by market capitalization of equity securities listed on stock exchanges in the United States.
The MSCI EAFE Net Total Return Index is a stock market index that is designed to measure the equity market performance of developed markets outside of the U.S. & Canada. It is maintained by MSCI Inc., a provider of investment decision support tools; the EAFE acronym stands for Europe, Australasia and Far East.
The Bloomberg Commodity Index (BCOM) is a broadly diversified commodity price index distributed by Bloomberg Indexes. The index was originally launched in 1998 as the Dow Jones-AIG Commodity Index (DJ-AIGCI) and renamed to Dow Jones-UBS Commodity Index (DJ-UBSCI) in 2009, when UBS acquired the index from AIG. The S&P GSCI (formerly the Goldman Sachs Commodity Index) serves as a benchmark for investment in the commodity markets and as a measure of commodity performance over time. It is a tradable index that is readily available to market participants of the Chicago Mercantile Exchange.
Diversification does not protect an investor from market risks and does not assure a profit.
| Digg This Article
-- Published: Thursday, 15 March 2018 | E-Mail | Print | Source: GoldSeek.com

