-- Published: Tuesday, 17 April 2018 | Print | Disqus
By Frank Holmes
Youve no doubt heard that everythings bigger in Texas. Thats more than just a trite expression, and Im not just saying that because Texas is home to U.S. Global Investors.
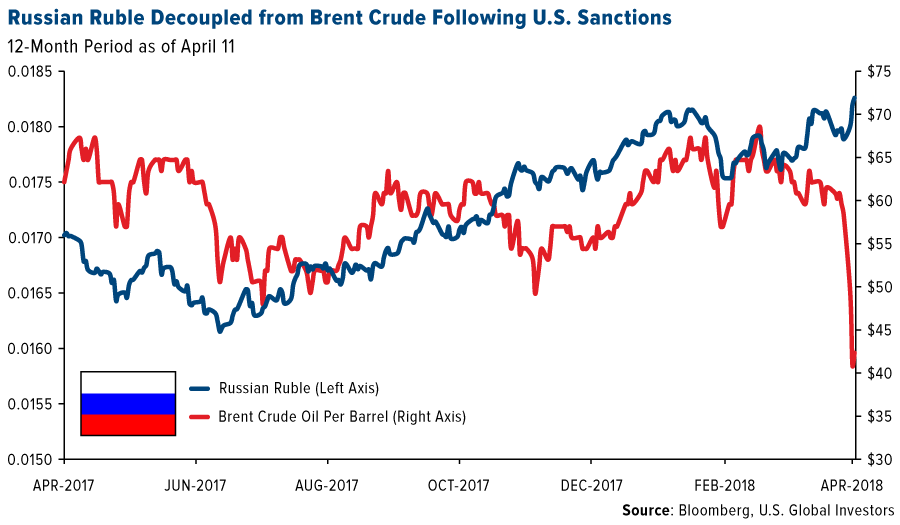
Want to know how big Texas really is? Lets compare its economy with that of Russia, the worlds largest country by area. As you probably know, Russias been in the news a lot lately, so the timing of this comparison makes sense. The U.S. just levied fresh sanctions against the Eastern European country for its alleged meddling in the 2016 presidential election, and early last week President Donald Trump warned Russia that the U.S. military could soon strike its ally Syria in response to its use of chemical weaponsa promise he kept Friday evening.
The Russian ruble traded sharply down following the news, decoupling from Brent crude oil, the countrys number one export.

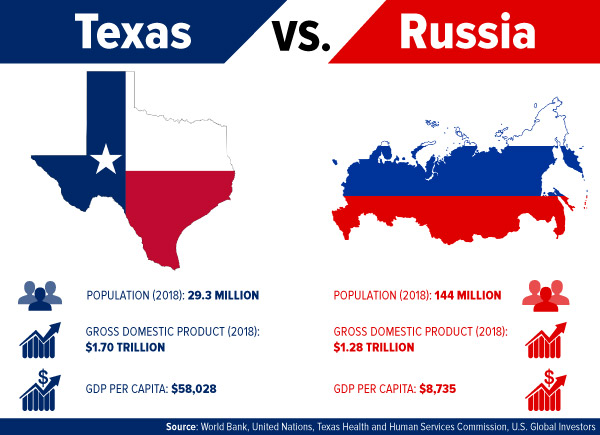
click to enlarge
But back to the comparison. Even though Russia has nearly five times as many residents as Texas, the Lone Star State's economy is more than $40 billion larger. Texans, therefore, enjoy a gross domestic product (GDP) per capita of around $58,000, whereas Russians have one closer to $8,700.
Texas Is So Much More than Oil Country
The Russian Federation is the largest single producer of crude in the world, pumping out 10.95 million barrels per day (bpd) in January, according to the countrys energy minister. Texas is no slouch, though, as its output came close to 4 million bpd in January. Thats the most ever for a January since at least 1981. And from December 2017 to February 2018, its oil and gas industry accounted for nearly 30 percent of the states employment growth, according to the Federal Reserve Bank of Dallas.
But whereas Russias economy is highly dependent on exports of oil and petroleum products, the Texas economy is broadly diversified. The state ranks first in the U.S. for not only oil production but also wind energy. It has a robust agricultural sector, and its a leading hub for advanced technology and manufacturing, aeronautics, biotechnology and life sciences. Austin, the state capital, is steadily emerging as the most dynamic U.S. filmmaking city outside of Hollywood.

All of this has helped contribute to Texas being among the fastest growing states in the U.S. In 2017, it grew by more than 1,000 new residents per day.
Meanwhile, Russias population is slowly shrinking because of low birth rates and low immigration. Its population peaked at 148 million in the early 1990sright around when the Soviet Union felland by 2050, its estimated to sink to 111 million.
Can Russia Root Out Its Corruption?
One area where Russia trumps Texas is in corruption. If you think Texasor any other statehas a corruption problem, Russia takes it to a whole new level.
But Russia takes it to a whole new level. Last year, it ranked 135 out of 180 countries on Transparency Internationals Corruption Perceptions Index (CPI), released in February. Among Eastern European countries, only Uzbekistan, Tajikistan and Turkmenistan ranked lower. Watchdog group Freedom House was similarly critical in its most recent analysis, giving the country an overall democracy score of 6.61 out of 7, with 7 being least democratic.
So notorious and widespread is Russias mafia that a number of movies have been made about it. One of the best among them is David Cronenbergs excellent Eastern Promises (2007).
Having said all that, I believe its prudent for investors to underweight Russian stocks for the time being and overweight Western Europe. Because of U.S. sanctions, Americans have until May 7 to divest completely from a number of Russian names, including Rusal, En+ Group and GAZ (Gorkovsky Avtomobilny Zavod), all of which saw serious outflows last past week. The MSCI Russia Index, which covers about 85 percent of Russian equities total market cap, plunged below its 200-day moving average, but last Thursday it jumped more than 4 percent, its best one-day move in two years.
Weaker Greenback and $1 Trillion Deficit Helps Gold Glitter
Gold is rallying right now, but as I told Daniela Cambone in last weeks Gold Game Film, it has little to do with Russian geopolitics, or even trade war fears, which have subsided somewhat in the past couple of weeks. Instead, the price of gold is responding primarily to a weaker U.S. dollar. For the 30-day period, the greenback has dipped close to 20 basis pointsfor the year, more than 11 percent.
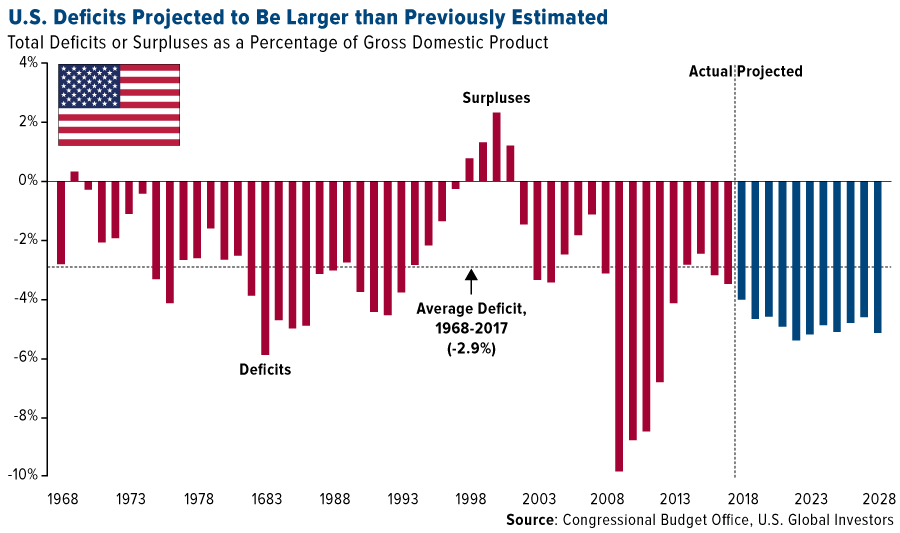
I think whats also driving the yellow metal right now are concerns over the U.S. budget deficit and ballooning government debt. This week the Congressional Budget Office (CBO) said it estimated the deficit to surge over $1 trillion this year and average $1.2 trillion each subsequent year between 2019 and 2028, for a total of $12.4 trillion. By the end of the next decade, then, debt held by the public is expected to approach 100 percent of U.S. GDP.

click to enlarge
According to the U.S. National Debt Clock, government debt now stands at over $21 trillionor, put another way, $174,000 per taxpayer. Imagine what the interest payments on that must be.
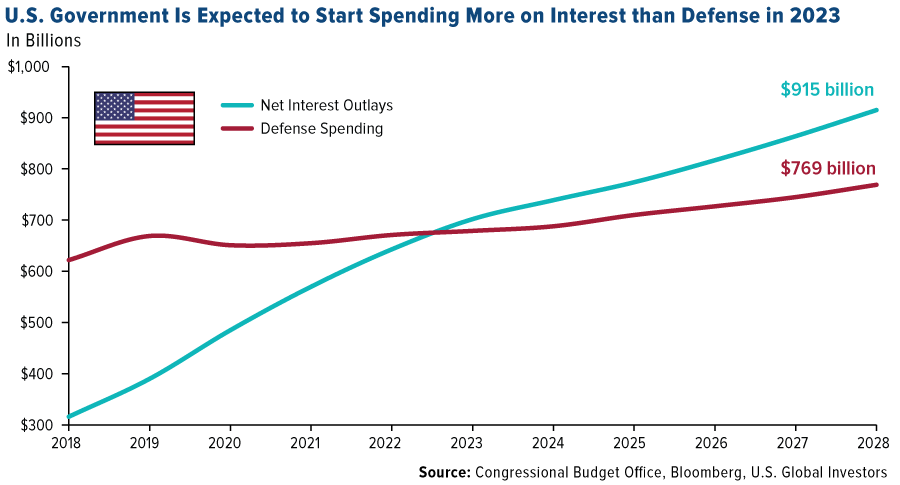
The CBO, in fact, commented on this. Believe it or not, the governments annual payments on interest alone, made even more burdensome by rising rates, are expected to exceed what it spends on the military by 2023. And remember, defense is one of the countrys top expenditures, alongside Medicare, Medicaid and other entitlement programs.

click to enlarge
There was even more news last week on debt and the deficit, as Congress tried, and failed, once again to amend the Constitution by requiring a balanced budget. The amendment could not get the two-thirds support it needed.
You can probably tell where Im headed with all of this. Savvy investors and savers might very well see this as a sign to allocate a part of their portfolios in safe haven assets that have historically held their value in times of economic contraction.
Gold is one such asset thats been a good store of value in such times. As Ive shown before, gold has tracked U.S. government debt up since 1971, when President Richard Nixon ended the gold standard. I always recommend a 10 percent weighting in gold5 percent in bars and coins; 5 percent in high-quality gold stocks, mutual funds or ETFs.
Asset Allocation Works
On a final note, I think its important that investors remember to stay diversified, especially now with volatility hitting stocks and geopolitical uncertainty on the rise. Ive discussed Roger Gibsons thoughts on asset allocation with you before, and I believe his strategy still holds up well today to capture favorable risk-adjusted returns.

click to enlarge
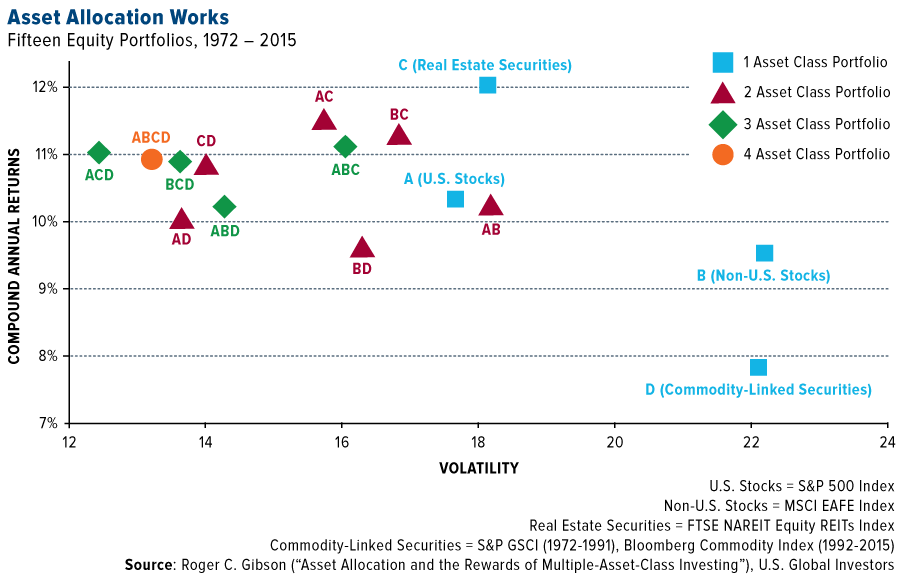
In the chart above, based on Gibsons research, you can see that a portfolio composed of U.S. stocks, international stocks, real estate securities and commodity securities gave investors an attractive risk-reward profile between 1972 and 2015. This diversified portfolio, represented above by the orange circle, delivered good returns with a digestible amount of volatility, compared to portfolios that contained only one, two or three asset classes. Concentrating in only one or two asset classes could possibly give you higher returns, but youd also likely see much greater risk, which many investors arent willing to accept.
I believe adding fixed-incomespecifically short-term, tax-free municipal bondscould improve these results. Munis with a shorter duration, as Ive explained in the past, have a history of being steady growers not just in times of rising rates but also during market downturns. In the past 20 years, the stock market has undergone two massive declines, and in both cases, short-term, investment-grade munisthose carrying an A rating or higherhelped investors stanch the losses.
Learn more about the $3.8 trillion municipal bond market by clicking here!
All opinions expressed and data provided are subject to change without notice. Some of these opinions may not be appropriate to every investor. By clicking the link(s) above, you will be directed to a third-party website(s). U.S. Global Investors does not endorse all information supplied by this/these website(s) and is not responsible for its/their content.
The Corruption Perceptions Index (CPI) scores countries on how corrupt their governments are believed to be. A country's score can range from zero to 100, with zero indicating high levels of corruption and 100 indicating low levels.
The MSCI Russia Index is designed to measure the performance of the large and mid-cap segments of the Russian market. With 22 constituents, the index covers approximately 85% of the free float-adjusted market capitalization in Russia.
The MSCI EAFE Index is an equity index which captures large and mid-cap representation across Developed Markets countries around the world, excluding the US and Canada. With 927 constituents, the index covers approximately 85% of the free float-adjusted market.
The FTSE Nareit All Equity REITs Index is a free-float adjusted, market capitalization-weighted index of U.S. equity REITs. Constituents of the index include all tax-qualified REITs with more than 50 percent of total assets in qualifying real estate assets other than mortgages secured by real property.
The Bloomberg Commodity Index, formerly the DJ-UBS Commodity Index, is a broadly diversified index that tracks the commodities markets through commodity futures contracts. Since its launch in 1998, it has emerged as a leading benchmark of commodity markets.
A basis point, or bp, is a common unit of measure for interest rates and other percentages in finance. One basis point is equal to 1/100th of 1%, or 0.01% (0.0001).
Diversification does not protect an investor from market risks and does not assure a profit.
Holdings may change daily. Holdings are reported as of the most recent quarter-end. None of the securities mentioned in the article were held by any accounts managed by U.S. Global Investors as of 3/31/2018.
| Digg This Article
-- Published: Tuesday, 17 April 2018 | E-Mail | Print | Source: GoldSeek.com