Commodities Are Flashing a Once-in-a-Generation Buy Signal
-- Published: Tuesday, 24 April 2018 | Print | Disqus
By Frank Holmes
Since the commodities supercycle began unwinding 10 years ago, many investors have been waiting for the right conditions to trigger mean reversion and lift prices. I believe those conditions are either firmly in place right now or, at the very least, in their early stages. Among them are factors Ive discussed at length elsewherea weaker U.S. dollar, a steadily flattening yield curve,heightened market volatility, overvalued U.S. stocks, expectations of higher inflation,trade war jitters, geopolitical risks and more.
In addition, nearly 60 percent of money managers surveyed by Bank of America Merrill Lynch believe 2018 could be the peak year for stocks. A recent J.P. Morgan survey found that three-quarters of ultra-high net worth individuals forecast a U.S. recession in the next two years.
All of this makes the investment case for commodities, gold, and energy more compelling than at any other time in recent memory.
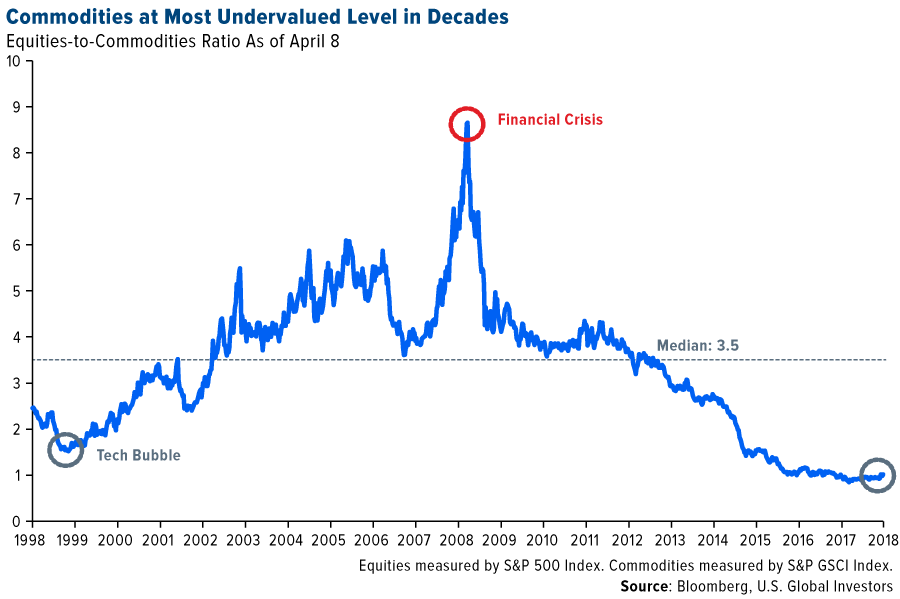
Exhibit A is the chart below, which Ive shared before but recently updated with new data. Relative to equities, commodities are as cheap right now as theyve been in decades. This is literally a once-in-a-generation opportunity that investors with a long-term view should seriously consider. For perspective, had you invested in a fund tracking the S&P GSCI or an equivalent commodities index in 2000, you would have seen a compound annual growth rate (CAGR) of around 10 percent for the next 10 years, according to Bloomberg data.
We all know that past performance is no guarantee of future results, but its doubtful youre going to get a clearer or resounding signal that now could be an ideal time to add to your commodities exposure. If you feel as if youve been stuck at a traffic light these past few years, just waiting to put your foot on the accelerator, you can breathe a sigh of relief because the light may have just turned green.
Goldman: Time to Overweight Commodities
I'm not alone in my bullishness. In a note last week, analysts at Goldman Sachs wrote that the strategic case for owning commodities has rarely been stronger. The bank recommends an overweight position, estimating that commodities will yield at least 10 percent over the next 12 months, with most of the gains being made by crude oil and aluminum.
Whereas crude traders are responding primarily to concerns that output could be disrupted by intensifying conflict in the Middle East, specifically oil producer Syria, aluminum prices have skyrocketed following the imposition of fresh U.S. sanctions against a number of Russian firms. Among them is United Company RUSAL, the worlds second-largest aluminum company, responsible for producing as much as 6 percent of global supply.
WTI Testing $70 Resistance
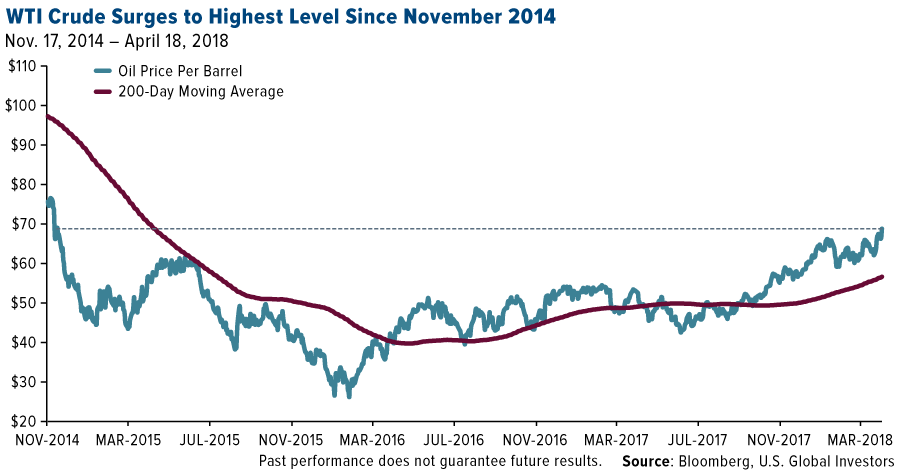
Since its low of $26 per barrel in February 2016, the price of West Texas Intermediate (WTI) crude has surged nearly fivefold and is currently at its highest level in more than three years. Last Wednesday, oil jumped nearly 3 percent on reports that U.S. inventories had fallen more than expected, suggesting the global glut continues to recede. And on Thursday, WTI tested resistance at $70, a level we havent seen since November 2014.
But prices retreated again Friday after President Donald Trump blasted OPEC on Twitter, proving once again how quants comb through social media at lightning speed and use sentiment analysis to inform their trades. With record amounts of Oil all over the place, including the fully loaded ships at sea, Oil prices are artificially Very High! No good and will not be accepted! the president said.
As I shared with you earlier this month, OPEC and Russia are planning to work more closely together to limit output for a number of years, possibly as many as 10 or 20. Such an agreement would help support oil pricesSaudi Arabia, in particular, seeks higher prices to take Saudi Aramco, the worlds largest energy company, publicbut its likely American shale producers would ramp up production to fill the void. The U.S. is now the number two oil producer in the world, having overtaken Saudi Arabia late last year.
Will We See $3,000 Aluminum?
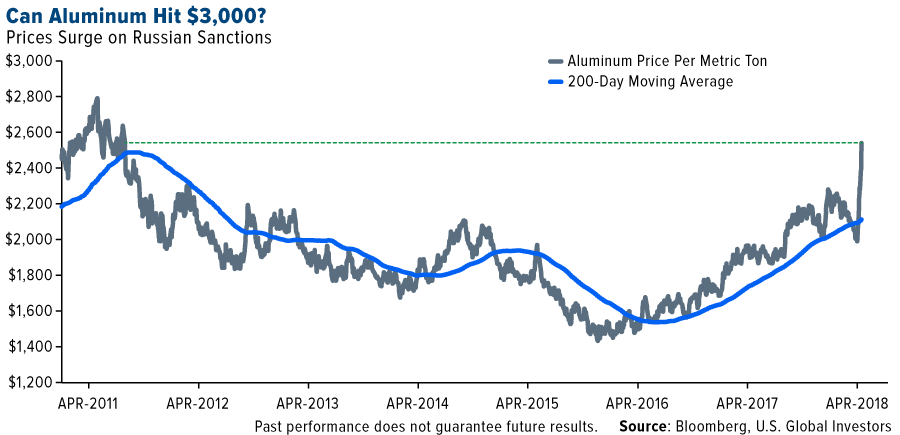
Aluminum is likewise enjoying a strong rally, jumping sharply more than 23 percent since the White House announced sanctions against select Russian firms and oligarchs in response to the Eastern European countrys alleged interference during the 2016 presidential election. In nine of the past 11 trading days through Thursday, the metal posted positive gains, surging nearly 6 percent on Wednesday alone.
Aluminum soared to $2,715 per metric ton in intraday trading Thursday, the highest weve seen since April 2011. The rally may have further to run, writes Goldman Sachs, which forecasts a price range of between $2,800 and $3,000 this year.
Australian-British multinational Rio Tinto and Melbourne-based BHP, two of the worlds top aluminum producers, were both upgraded to BUY this week by CLSA, partly in response to rising aluminum prices but also because they maintain strong balance sheets and are expected to generate favorable free cash flow (FCF) this year.
Chinas One Belt, One Road Still Needs Biblical Amounts of Materials
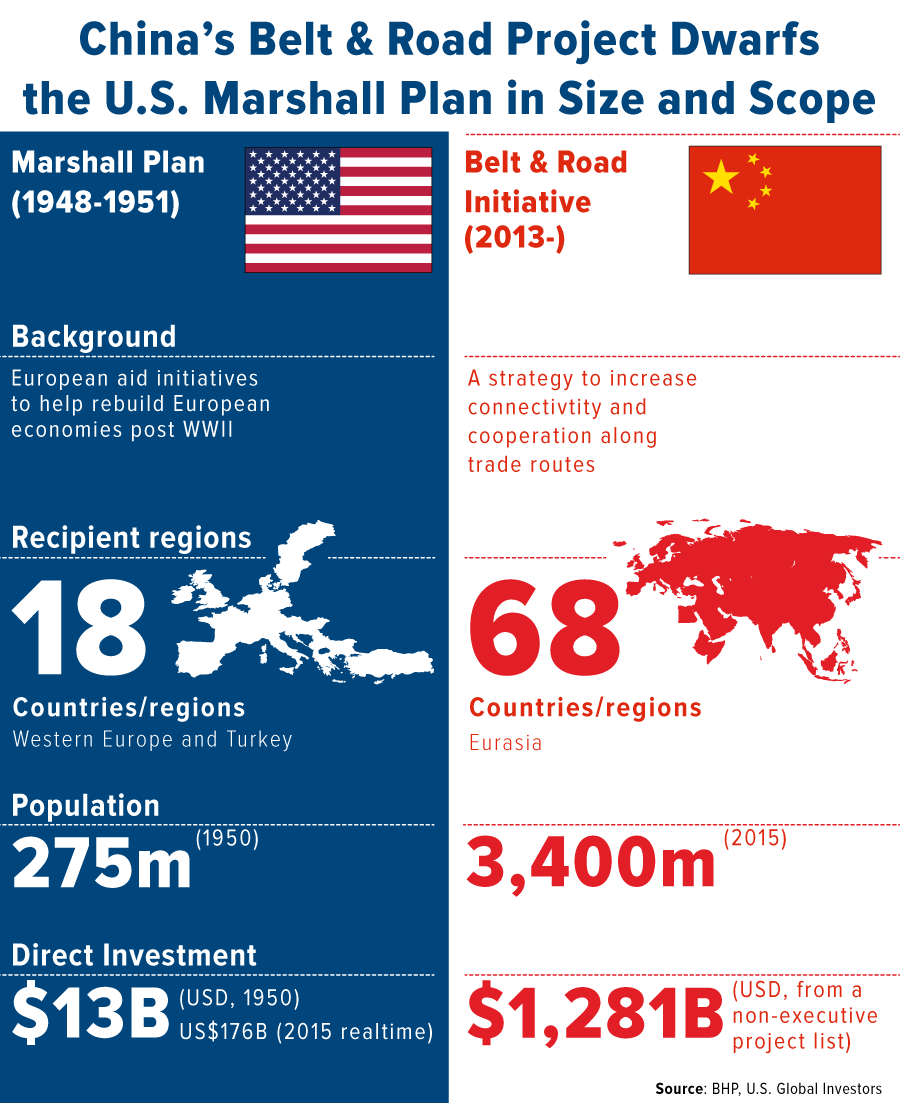
Also bolstering the commodities investment story is Chinas massive ongoing Belt and Road megaproject, also known as the Silk Road Economic Belt. In a note last week, CLSA reminded us that the infrastructure initiative is still in its infancy, expected to be completed by 2049. It will cut through as many as 68 countries across Asia and Europe, affecting an estimated 62 percent of the worlds population. China has already spent approximately $180 billion to complete various projects, but many billions more will go toward building roads, ports, dams, high-speed rail, airports and moreall to enhance regional connectivity, as President Xi Jinping put it, and strengthen Chinas economic clout.
To give you some scale as to how monumental and historic this undertaking truly is, the graphic below, courtesy of BHP, compares the development to the U.S. Marshall Plan, then one of the most expensive projects in human history. The Belt and Road initiative could eventually cost 12 times as much or more, with total spending estimates ranging between $4 trillion and $8 trillion.
Estimates of how much energy and natural resources will be needed during the development phase vary wildly, but I think its fair to assume that demand will continue to be supported for some time.
Gold Supply Concerns Highlight It's Rarity
Gold ended last week down slightly, the first time in three weeks its done so. It looks as if gold investors took some profits late in the week after the yellow metal came close to breaching $1,360 on Wednesday.
I still believe gold could hit $1,500 an ounce this year on rising consumer and producer prices, which I think are understated. This is more than apparent when you compare the official U.S. consumer price index (CPI) and alternative measures such as the New York Feds Underlying Inflation Gauge (UIG). And as Dr. Ed Yardeni points out in a recent blog post, the word inflation appeared as many as 106 times during the latest Federal Open Market Committee (FOMC) meeting, a sign that Fed members could be getting more and more concerned about mounting inflationary pressures.
Recent reports also suggest gold production is slowing, which could help support prices long-term. Exploration budgets have been declining pretty steadily since 2012 after the price of gold peaked, and fewer and fewer large-deposit mines are being discovered.
Last week the China Gold Association announced that the country, the largest producer of gold, produced 98 million metric tons in the March quarter, down some 3 percent from the same period last year. This comes after total Chinese output in 2017 fell 6 percent year-over-year to 426 million tons. Granted, miners have been pressured by Beijing to curtail production as part of the governments enforcement of tougher environmental protection policies, but the decline in output is part of a downward trend were seeing across the board, especially among major producers.
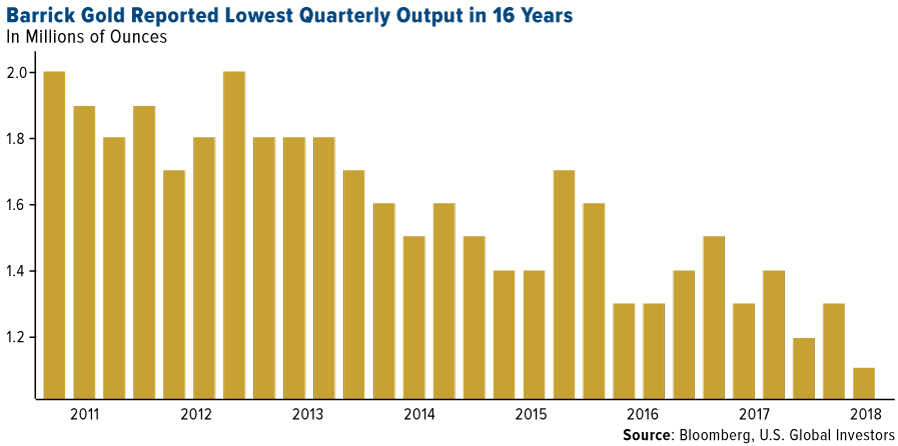
Take a look at the declining quarterly output of Barrick Gold, the worlds largest gold miner. According to its preliminary results for the first quarter, Barrick produced a total of 1.05 million ounces from its 10 projects. Thats only a 2 percent decrease from the same quarter last year, but a far cry from where it was seven years ago.
Since the news hit April 11, shares of Barrick are up about 3 percent, even after a Friday selloff.
While some investors might view the lower output as disappointing, others no doubt see it as a reminder that gold is a finite resource, one of the many reasons why its remained so highly valued for centuries. As Ive written before, the low-hanging fruit has likely already been picked, making the task of mining the yellow metal more difficult as well as expensive. Supply isnt growing nearly as fast as it once did.
And yet demand continues to climb. Not only do the peoples of India, China, Turkey and other countries have a strong cultural affinity to goldan obsession that will only intensify as incomes risebut the metal still plays a vital role as a portfolio diversifier in times of economic and political uncertainty.
Franco-Nevada IPO at 10
On a final note, Franco-Nevada, one of our favorite players in the gold space, recently celebrated it's 10- year anniversary as a publically-traded company. As if to commemorate the occasion, the company reported record sales and profit in 2017, not to mention a record $167.9 million in dividends paidall while staying debt-free.
I am pleased that Franco-Nevadas 10th full year since its IPO was its best year ever, commented CEO David Harquail.
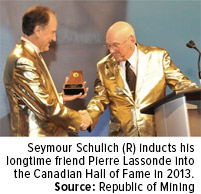
Id like to congratulate my good friends Seymour Schulich and Pierre Lassonde, who conceived of the gold royalty model and cofounded the company back in 1983. (As Ive explained before, Franco-Nevada was the first IPO I worked on as a young analyst in Toronto.) Seymour and Pierre are true rock stars in the world of gold mining, and what theyve managed to achieve is nothing short of legendary.
Read more about Franco-Nevadas record year by clicking here!
The S&P GSCI (formerly the Goldman Sachs Commodity Index) serves as a benchmark for investment in the commodity markets and as a measure of commodity performance over time. It is a tradable index that is readily available to market participants of the Chicago Mercantile Exchange. The S&P 500 is a stock market index that tracks the stocks of 500 large-cap U.S. companies. It represents the stock market's performance by reporting the risks and returns of the biggest companies.
The compound annual growth rate (CAGR) is a useful measure of growth over multiple time periods. It can be thought of as the growth rate that gets you from the initial investment value to the ending investment value if you assume that the investment has been compounding over the time period.
Free cash flow (FCF) is a measure of a company's financial performance, calculated as operating cash flow minus capital expenditures. FCF represents the cash that a company is able to generate after spending the money required to maintain or expand its asset base.
The Underlying Inflation Gauge (UIG) includes a wide range of nominal, real and financial variables in addition to prices and focuses on the persistent common component of monthly inflation. The UIG is defined as the persistent common component of monthly inflation.
The Consumer Price Index (CPI) is one of the most widely recognized price measures for tracking the price of a market basket of goods and services purchased by individuals. The weights of components are based on consumer spending patterns.
There is no guarantee that the issuers of any securities will declare dividends in the future or that, if declared, will remain at current levels or increase over time.
Holdings may change daily. Holdings are reported as of the most recent quarter-end. The following securities mentioned in the article were held by one or more accounts managed by U.S. Global Investors as of 3/31/2018: BHP Billiton Ltd., Barrick Gold Corp., Franco-Nevada Corp.
All opinions expressed and data provided are subject to change without notice. Some of these opinions may not be appropriate to every investor. By clicking the link(s) above, you will be directed to a third-party website(s). U.S. Global Investors does not endorse all information supplied by this/these website(s) and is not responsible for its/their content.
The content on this site is protected
by U.S. and international copyright laws and is the property of GoldSeek.com
and/or the providers of the content under license. By "content" we mean any
information, mode of expression, or other materials and services found on GoldSeek.com.
This includes editorials, news, our writings, graphics, and any and all other
features found on the site. Please contact
us for any further information.
Live GoldSeek Visitor Map | Disclaimer
The views contained here may not represent the views of GoldSeek.com, Gold Seek LLC, its affiliates or advertisers. GoldSeek.com, Gold Seek LLC makes no representation, warranty or guarantee as to the accuracy
or completeness of the information (including news, editorials, prices, statistics,
analyses and the like) provided through its service. Any copying, reproduction
and/or redistribution of any of the documents, data, content or materials contained
on or within this website, without the express written consent of GoldSeek.com, Gold Seek LLC,
is strictly prohibited. In no event shall GoldSeek.com, Gold Seek LLC or its affiliates be
liable to any person for any decision made or action taken in reliance upon
the information provided herein.