-- Published: Monday, 18 June 2018 | Print | Disqus
By Plunger
I hadnt planned on submitting anything this weekend, however in light of Fridays action I felt it may be useful. After Fridays smashing in the commodities and precious metals market many investors are now rattled and may have bailed from the sector already. It is not my purpose to recommend holding or selling, however I would like to lay out for you what is going on beneath the surface
the process that the markets are undergoing.
First off one should see Fridays action as only short term noise. It is my view that it was triggered by the markets reaction to the Trump tariffs and the fear of it hurting global trade. Here we see the gap down action in the CRB. It chose to stop at the 150 EMA and its lower Bollinger Band:

The action of late in the CRB has been pretty bearish to the downside with its gap off of the top followed by a failed bear flag right under the 50 EMA. Even though the upside move is still intact, I for one, am on the lookout for the top in commodities for now.
One could say that the move down in gold and silver was collateral damage due to the drop in commodities. Thats a reasonable assessment, however there could be a more sinister element involved which entails a paper smash of the gold market. We have seen numerous cases of this in the past and it looks likely thats what this was also. But if you are resistant to believing this stuff happens, thats fine also as what you should know is that as these price dives occur, physical metal is being taken out of the market and being delivered to stronger hands. These hands will not be shaken in the future as they are the hands of central banks which are not involved in the gold price suppression scheme. As .999 gold gets bought up and refined into .9999 metric it goes into deep storage and it wont be available for export sales. These gold tonnages cannot be replaced at todays prices. Stated differently, the physical supply bought up in these high volume gold smashes gets taken out of the market and moves to entities where it will serve as the collateral to the national currencies of the future.
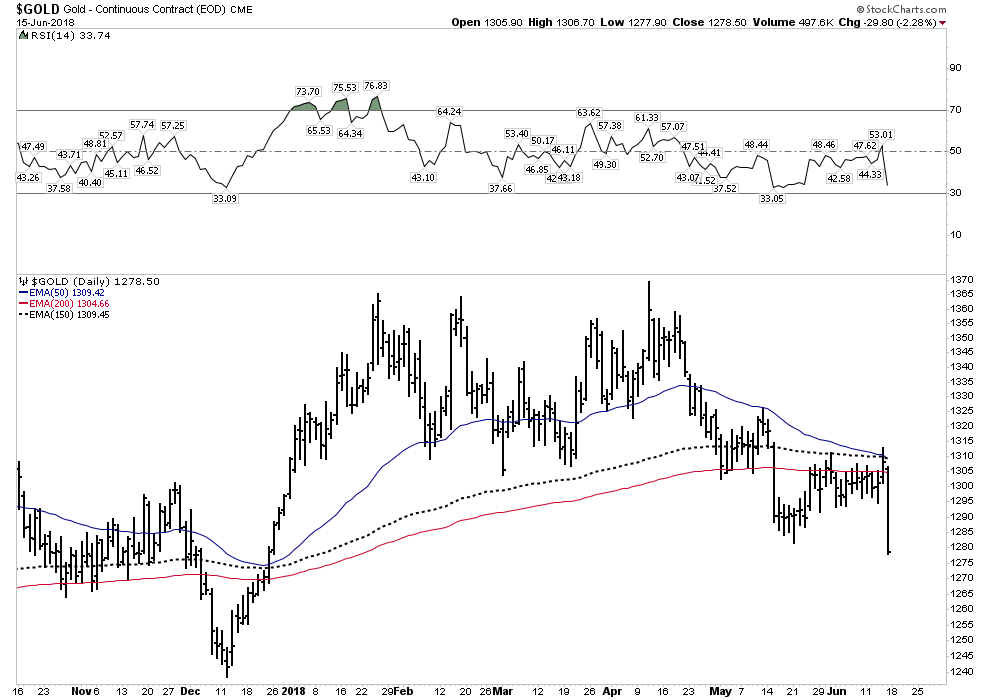
Below we see the daily gold chart and its smash down from just under the overhead resistance of the 200 EMA. It certainly looks grim and may very well continue down, however one can see in the second chart below the weekly view which shows an intact uptrend.
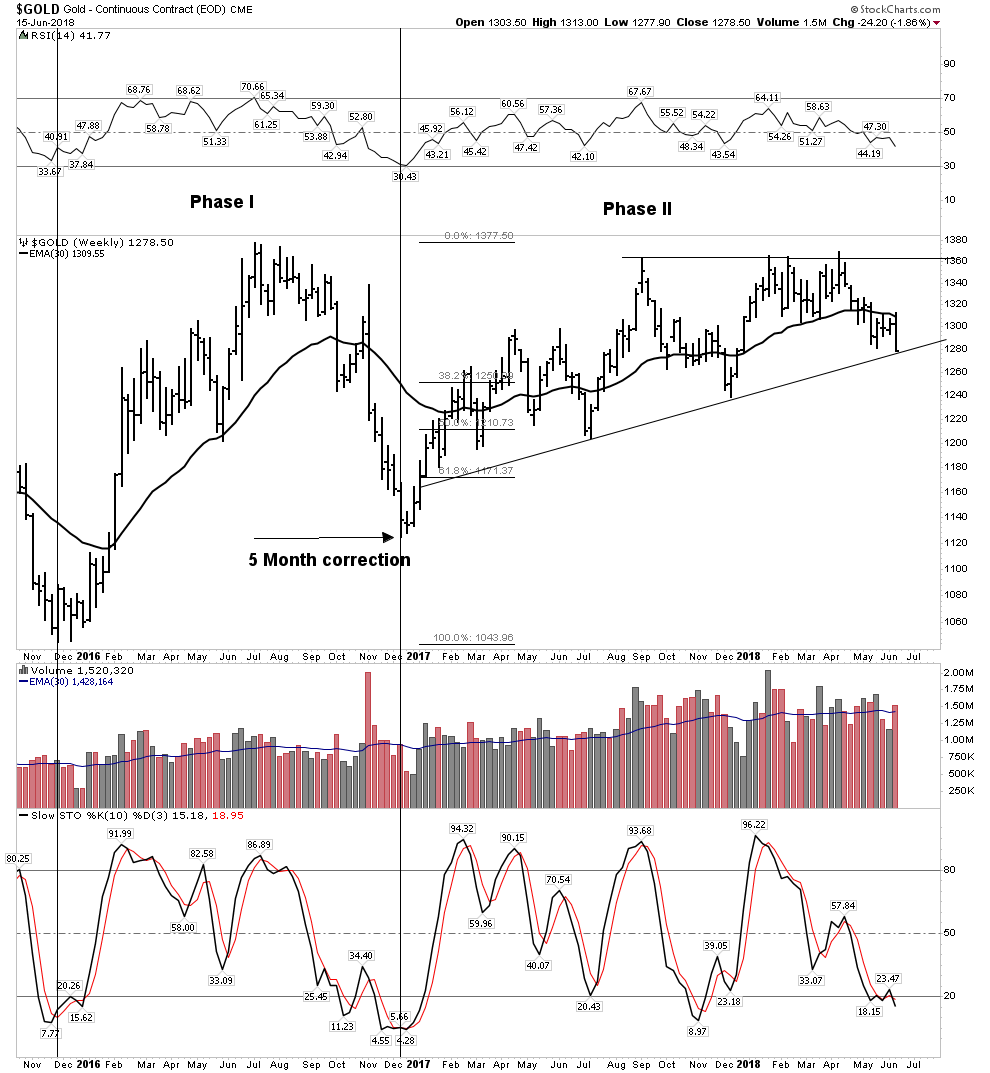
Below is the weekly showing the bull market uptrend still intact, however price remains below a now downward sloping 30 EMA sitting right at trendline support.

Silver
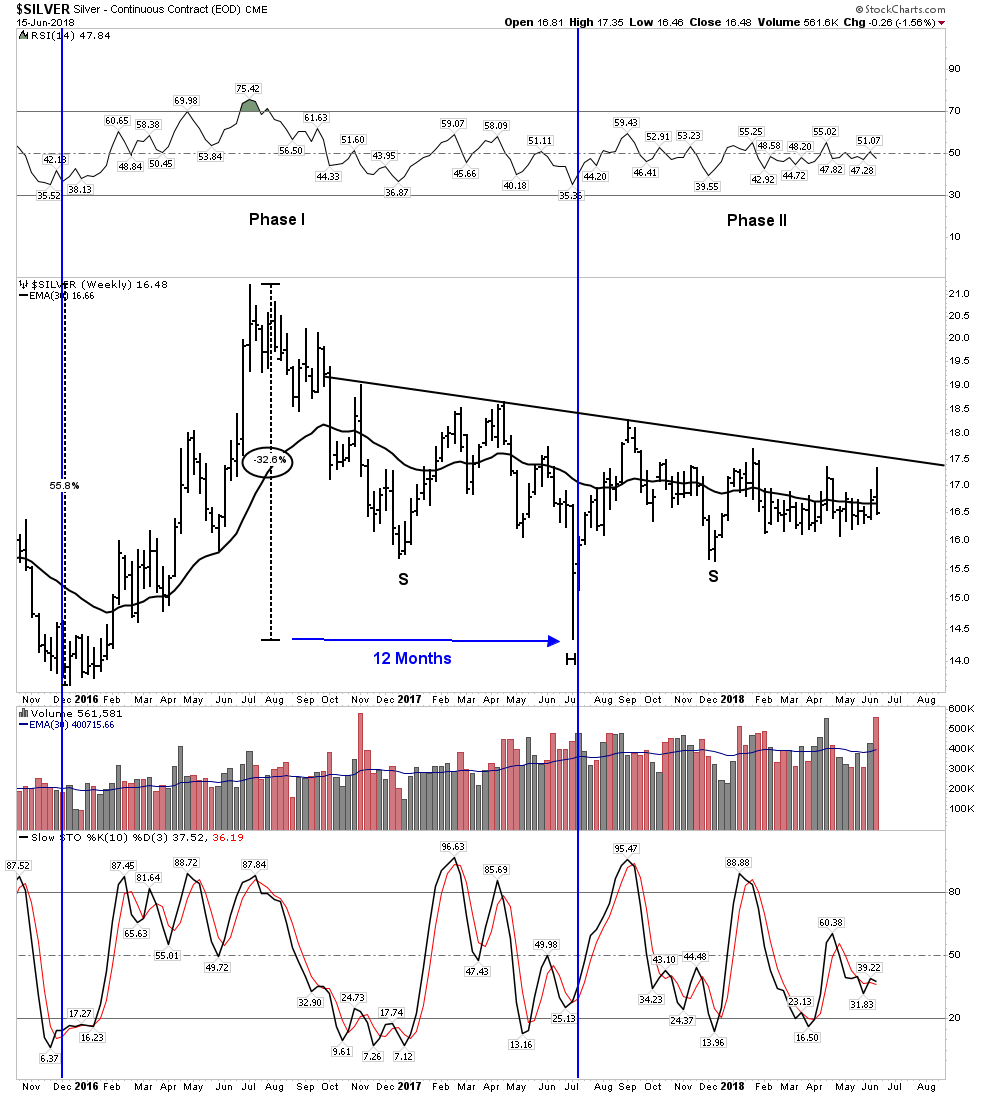
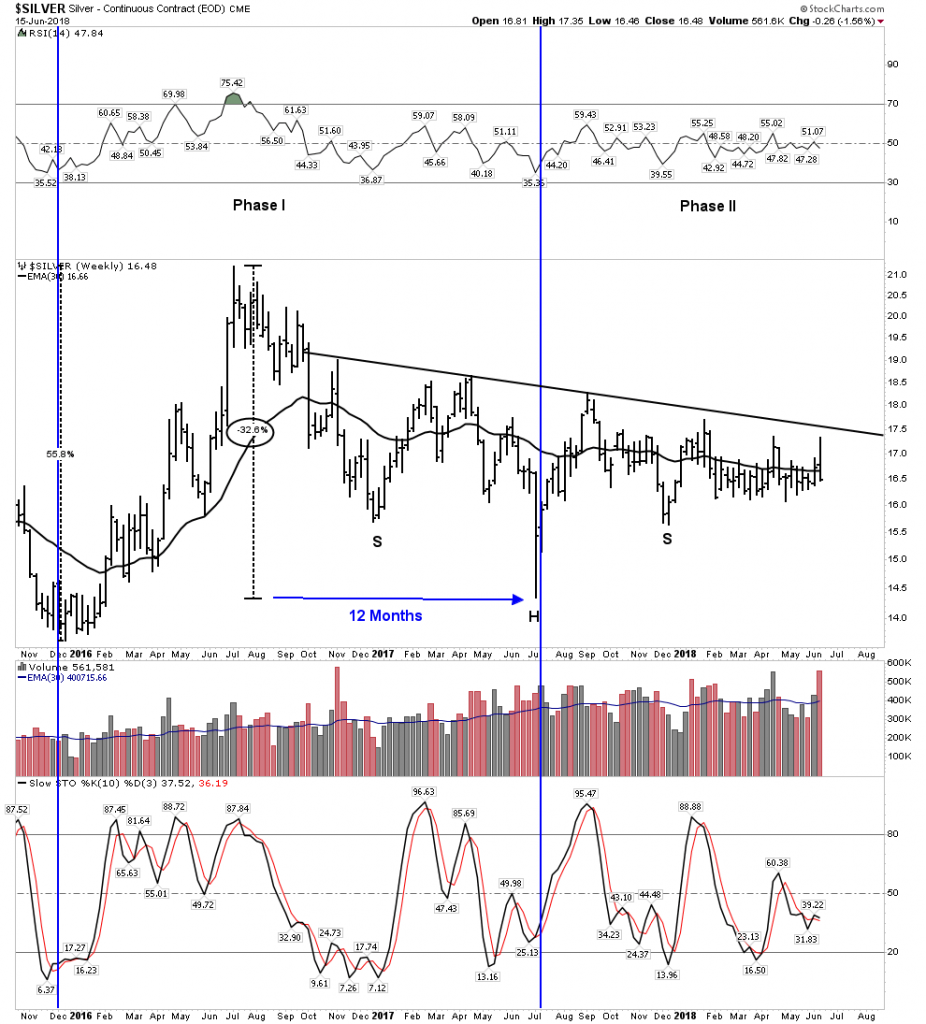
Silver has shown recent relative strength to gold, however it has trailed gold in turning up to the upside. You can see in the chart below it needs to break above the forming NL. The smash Friday put this process back on hold.
Bottom Line PM:
The metals and the PM stocks appeared at the cusp of a break upward before Fridays smash. After Fridays whacking many gold newsletter writers have now advised their subscribers to sell and seek safety. They may be proven right, however nothing has changed in my view. The forces of a bull market continue to coalesce. Selling out ones position in this sector is an error in my view. Weak hands are letting go their positions right now, I prefer to hold onto quality companies.
Connecting the Dots and solving Mr. Markets puzzle.
Above we see the chart view, however what I really want to show you is the big picture. The underlying strategic process that is occurring underneath the surface of these markets. It is the story that IS NOT being told. It is the essential story, the underlying process that is driving these markets. If you understand this you have a chance of not only capturing the next major uptrend, but also protecting yourself from the next bear market.
It is said that Americans have the attention span of a major league baseball season. I am not even sure investors can keep a thought in their head for that long. So to think that the average investor can formulate an investment theme and comprehend it unfolding over several years may be too tall an order. But thats what we have to do if we are to understand and ride the trend change which is occurring right now.
The End of the Super Cycle and the Post Bubble Contraction
The world has been in a secular expansion since the late 1940s. This credit cycle began with public and private balance sheets at low debt levels. We are now in a fully mature end of cycle, where these balance sheets must be ratcheted down. This process entails a post bubble contraction of credit. Typically the process unfolds over a period of 20 years. This is what we now face and historically it is an environment bullish for gold and gold stocks.
The 1937 Bear Market- You heard it here first
Since late last year, I have pointed out that the current bull market resembled the bull market from 1932-1937. I heard of no other source making this claim until now. The 32-37 bull market is the only bull with declining volume throughout its lifespan, just like our current 9 year bull has shown. The 32-37 bull was driven by a perception that the government was going to spend us out of a depression, a close cousin to todays various QE programs. It has been my hypothesis that since the current bull has such a close resemblance to the 32-37 bull that it may end in similar fashion.
Well, this month Robert Prechtor wrote several pages in his monthly EW letter laying out a similar scenario regarding the 1937 bear market which ensued. Welcome to the same conclusions we have arrived at Robert, I believe we are in good company. So lets compare todays market with what occurred in 1937.
First off let me say I have reviewed Rambus charts of the overall stock market averages. I see how the long term uptrends remain intact and viewed from a long term perspective they continue to appear in upward trajectories. What I show below is an internal view of the averages and what the movement of the averages this year seem to be telegraphing according to DOW Theory principles.
Update on DOW/TRAN
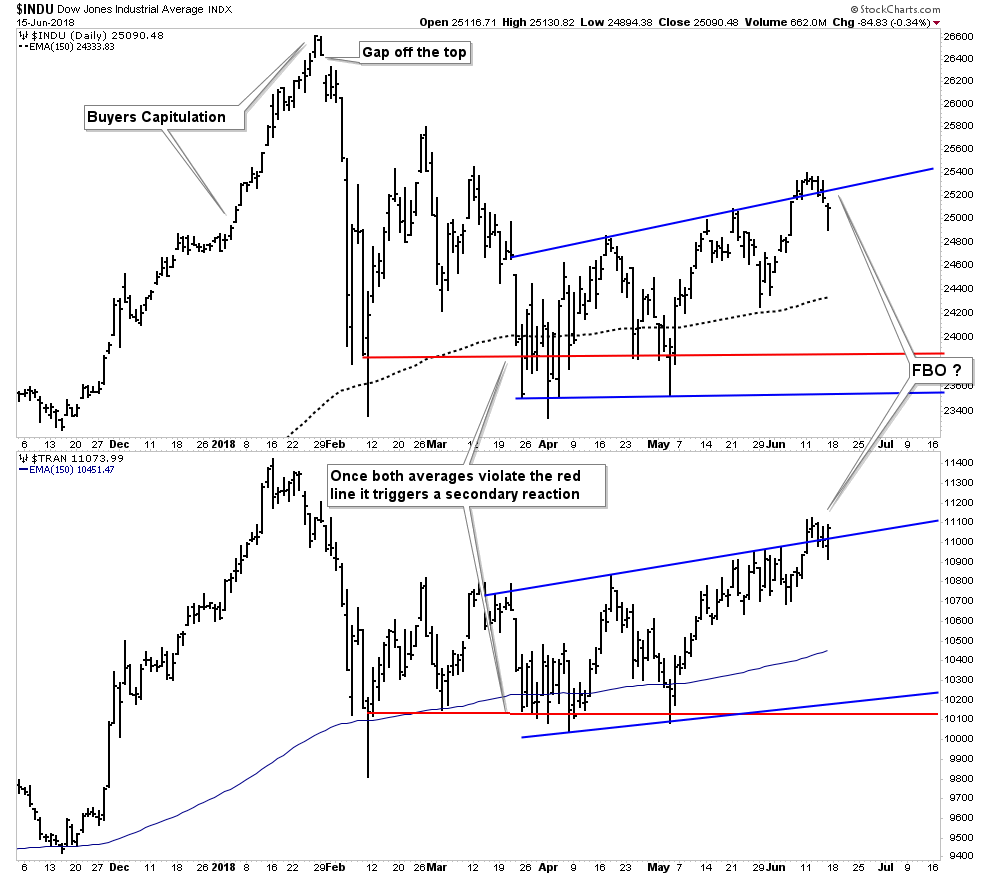
Above one sees the process of correcting the JAN/FEB flash decline which I have termed the Slaughter of the Volitility Traders. It came off of the upside buyers capitulation of Dec-Jan. The top occurred within the context of bitcoin blowing out on the upside and in the timeframe of typical bubble tops of the past. (Turn of the year tops 1973, 1989 Nikki, 2000 USA & others) After the crashette bottom the market underwent a failing rally and violated the closing lows in late March & early April for the transports. This triggered a secondary reaction classification to the move. If both market indexes violate the Mar/Apr lows it will deliver a Dow Theory Bear Market signal to the market. The only way to eradicate the secondary reaction classification is for both averages to go on to new highs. The market has been attempting this, however it has been struggling in this endeavor. Over the past week the averages may have put in a false BO above their rising channel depicted by the blue lines. My interpretation is that this channel is a bear flag, to be taken out to the down side. We will see.
A rolling top, similar to the 1937 rolling top?
Here is where it gets interesting. When we compare the process of what we discussed above to what happened in the rolling top of 1937.

Above we see the top of early March. Its a broad H&S with a very strong RS bounce after a 14.7% drop to form its NL. It then squeezed out all of the shorts with a 2 month rally finishing up in early August. What then followed was nothing less than total rapid annihilation. Over the next 2 months market participants were violently smashed with little means to exit the market. The market then went on to lose 50% over the next 12 months.
Could this happen today? I cant say, but recall this bull market of the past 9 years resembles the 1932-1937 bull market more than any bull over the past 120 years. After the top the 37 bear underwent an initial 14% decline. We saw a 12.3% decline in our current initial sell off and it has been struggling to ever since to recover the highs. For those holding out for the averages to resume their upward climb I remind you of Inspector Callahans line
. Do you fell lucky?
Well do you?
The Post Bubble Contraction Progresses
Grinding away in the back ground the post bubble contraction continues its process. Historically as rates rise, credit stress occurs at the periphery of the economic system. Eventually economic problems get transmitted towards the economic center of the financial capital of the reserve currency.
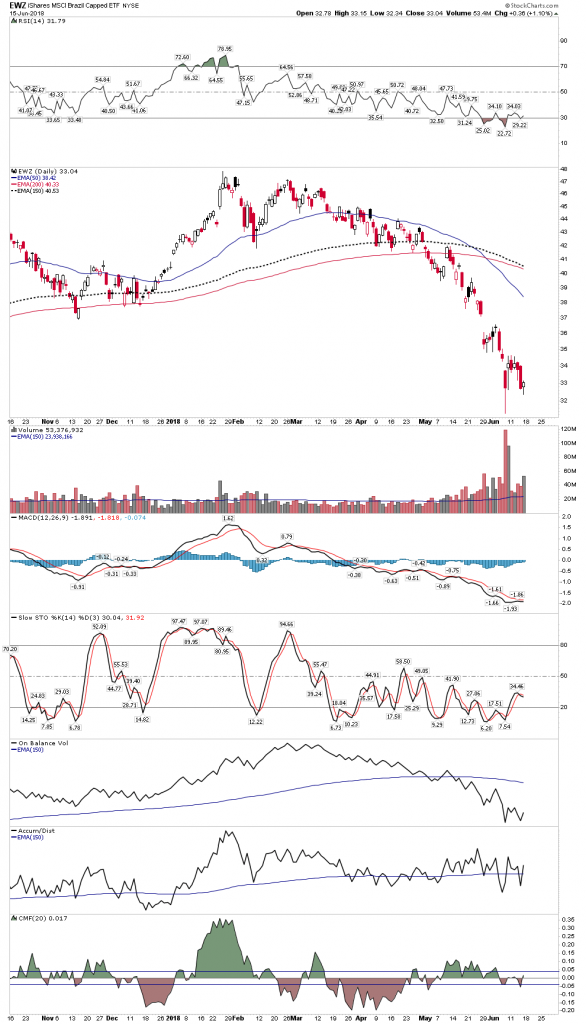
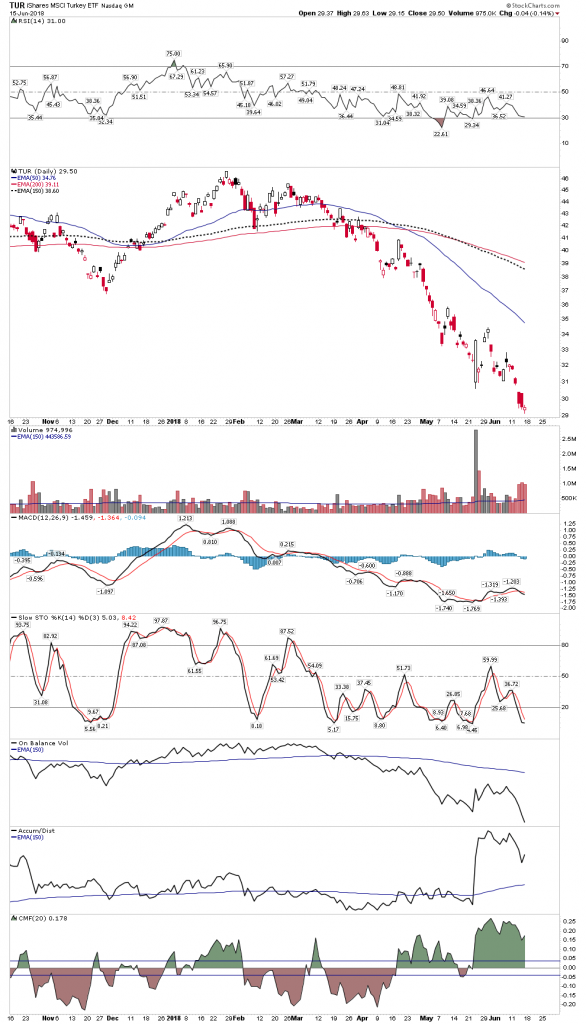
We see this now starting to occur. As the FED rises rates the weaker periphery currencies and economies start to blow up. Over the past month we now see this occurring in the Italian bond market the Argentine currency and Brazilian and Turkish stock market among others and its spreading.
Brazil
Turkey
Rising rates spells trouble for credit expansion. However even though nominal rates are rising, real rates remain negative which over time is fuel for a gold bull market. Remember at this part of the cycle the FED rises rates until something blows up. We are now starting to see this occur as emerging currencies and markets implode and the shock gets transmitted towards the center. Eventually the flow of funds will desire safety and will seek out the most liquid of assets: gold and treasury bills of the senior currency. The USD captures the flows and starts its rise. At that time it will be game on in the PM space.
This is the big picture process that is occurring now beneath the surface. Its the slow motion process that the average investor does not have the attention span to keep in his head.
Risks to early stage bull market in gold and silver
So we now can see the process actually taking hold. Now that it is beginning to occur can we now start to deploy in size in ones gold portfolio? This is hard to say, since historically the mining stocks take a hit in the initial stage of a stock market decline. They decline in sympathy as they are equities and they act as a source of liquidity to draw on. Once the initial decline is over however, the bull market can resume. In the last crisis of 2008 this period lasted about 2-3 months. Next time is anyones guess. Remember markets learn, maybe next time it lasts much shorter, if at all.
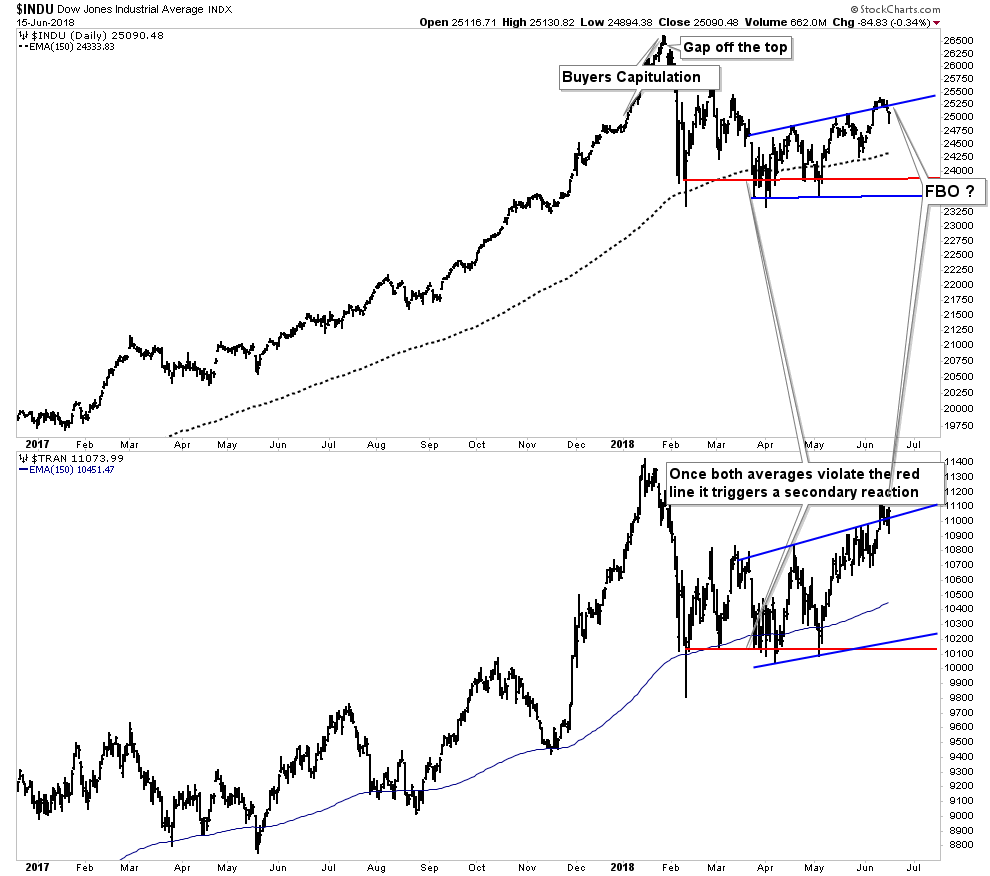
The Dow and Transports: Looking from across the room
Looking at the above DOW/TRAN chart from an 18 month duration perspective one can see the current consolidation between the blue lines as a possible bear flag. It can continue to consolidate, but if it breaks below the flag by late summer the 1937 analogy presents itself front and center. We will remain objective and let the market speak its language
were listening.
Conclusion
The daily action in the general averages attract the eyes of the average investor. He sees the Russell and Nasdaq going to new highs giving him comfort and validation of the constant stream of bullishness he hears on CNBC. The FANGMAN stocks capture his imagination and dreams. He has no ability to see beneath the surface and piece together the market puzzle as we have done today. This is what is important and its unfolding before our very eyes. May you live in interesting times.
..
Editors Note : Plunger is the resident Market Historian and an Associate Writer at Rambus Chartology. His views based on Dow Theory and a lifelong study of Market History are welcomed by Rambus , even as sometimes they may be in opposition to Rambus Charts .
https://rambus1.com/
| Digg This Article
-- Published: Monday, 18 June 2018 | E-Mail | Print | Source: GoldSeek.com