-- Published: Monday, 6 August 2018 | Print | Disqus
By John Mauldin
The Distribution of Pain
The Two Economies
Leveraged Stress
Working Class Versus Service Class
Maine and up in the Air
This week I have something special for you: an update of The Distribution of Pain, one of 2017s most popular letters. I say popular just in terms of feedback and reprint requests. It was thought-provoking but also sobering. I started with the original version, re-edited to clarify a few points, and added some new comments. It is still a timely, important topic.
As you read this, I will be in Grand Lake Stream, Maine, at the annual Camp Kotok economics/fishing retreat. This has become an annual pilgrimage for me (13 straight years). My friend David Kotok organizes an amazing event with several dozen economists, financial advisors, fund managers, journalists, and a few others. Our venue at Leens Lodge and some of the surrounding camps is quite remote, so Ive learned not to assume I will have an internet connectionanother reason Ive pre-written this weeks letter. Out on the lake, you can sometimes connect with Bell Canada!
Before we begin, you should have received some e-mails from me this week about our Mauldin Economics VIP program. It is open until August 8, and I highly recommend you consider it
I said in Thoughts from the Frontline last week that all investors should have one or more investment advisors. Of course, that is not always possible. But with Mauldin VIP, you get access to the thinking of six esteemed editors, our entire backroom team of analysts, seven top quality services, and a lot more. Think of it as a year-round Camp Mauldin.
If you agree with me that the Great Train Wreck and Great Reset are coming, then you owe it to yourself to consider joining us at VIP. You can find out more herebut please do so before your invitation expires on August 8.
Now, on with our letter.
When you write about economics, you quickly learn the economy doesnt care what you say. The forces that drive it are beyond any one persons comprehension, much less control.
But at the same time, the economy doesnt work like a law of nature. Unlike gravity, for instance, the economy responds to human choices and preferences. We influence it, even if we dont understand exactly how.
In my 2017 Fragmentation of Society letter, I wrote about the coming technological changes that will replace many human jobs and disrupt society. Some of the disruption will be good and necessary. Much of it will be painful, too, and the pain wont be evenly distributed.
That is a problem whether you personally feel it or not. People dont like pain. They change their behavior to avoid or relieve it. People in pain will vote for politicians who say they can help, regardless of whether they actually can. And if those who suffer see you dont share their pain, they will wonder why not and want whatever advantage you possess. Then it gets ugly. Thats not a moral statement but simply a fact-based observation of human nature.
The natural stratification of society, which is something I really deplore (but it is also reality), means we at the upper end of the financial spectrum have little interaction with or knowledge of the people who feel the most pain. I wrote about this chasm between classes in 2016 (see Life on the Edge) as the US election made the split in our nation harder to ignore.
It doesnt matter that I began life on the wrong side of the tracks in West Texas. Dad was an alcoholic, and we were poor. But a few lucky breaks and a lot of hard work (the harder I worked, the luckier I got) got me to the upper end. And without knowing the story, most people assume that is how my life began. But I remember. I have more sympathy than you might imagine for those who are struggling.
Peggy Noonan talks about the Protected class that makes public policy and the Unprotected who must live with those policies. Today, I want to delve a little deeper into this widening split and consider where it may take us. As youll see, the possibilities range from not so bad to very, very bad.
Ray Dalio is no stranger to my readers. The billionaire founder of top hedge fund Bridgewater Associates got where he is by having keen insight into both human nature and economic trends. Occasionally he shares some of his wisdom publicly. I featured his reflections on the then-forthcoming Trump presidency in Outside the Box after the 2016 election.
In October 2017, Dalio posted a new article, The Two Economies: The Top 40% and the Bottom 60%. He wrote that it is a serious mistake to think you can analyze or understand the economy because we now have two economies. Wealth and income are so skewed between top and bottom that average indicators no longer reflect the typical persons experience or living conditions.
Dalio launches with this chart:
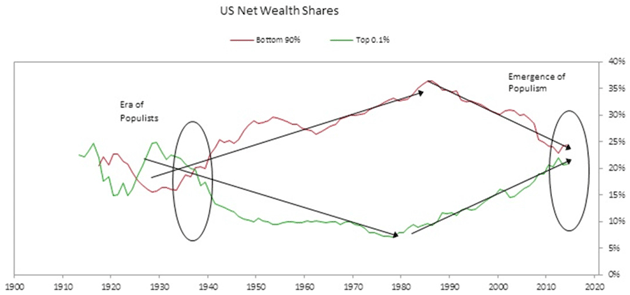
Source: Ray Dalio
The red line is the share of US wealth owned by the bottom 90% of the population, and the green line is the share held by the top 0.1%. Right now, they are about the same, but notice the trend. The wealthiest 0.1% has been increasing its share of wealth since the 1980s, while the bottom 90% has been losing ground.
Looking back, we see a similar pattern in the 1920swhich dramatically reversed in the following decade. Then there was an almost 50-year period during which the masses gained wealth and the wealthy lost ground.
(Important note: This doesnt mean the 0.1% ceased being wealthy. It just means they owned a smaller portion of the total wealth. An economy in which 0.1% of the people own 10% of the wealth is still skewed, just less so. But more on that later.)
In the big picture, we see about a half-century when the net wealth gap widened in favor of the bottom 90%, followed by another 30 or so years in which the wealthiest gained ground while most of the population lost it
at least in terms of total national aggregate wealth.
I have written elsewhere that wealth is relative. Most of the bottom 90% have better lives today than 38 years ago. But they dont compare life to where they were in 1980, but to today. They see income and wealth relative to the current economic totem pole, not the one from 30 years ago. Now, maybe you dont have those feelings, but unfortunately many of our neighbors do. Thus the political split.
Its no coincidence that populism emerged as a political force in both the 1920s1930s and the 2010s. In each case, people at the bottom could tell that the economy wasnt working in their favor. Their best tool to do something about it was the vote, so they elected FDR then and Trump nowtwo very different presidents but both responsive to their eras intensely angered voters.
And I would note that Bernie Sanders reflected that same angst on the left. I fully expect that a younger, more rational, and appealing Bernie Sanders (even, and maybe especially, if it is a woman) will be the Democratic flag bearer in 2020.
Looking back further in Dalios chart, that previous roughly 10-year period, in which the green line was above the red line, included the Roaring 20s, the 1929 market crash, and the first part of the Great Depression. For the 0.1%s share of the wealth, 1929 was roughly the high point. Wealth lost in the crash sent their share plummeting. It has not fully recovered to this day, but its getting close.
Thinking about this situation, I cant help but connect it to my friend Neil Howes idea of a Fourth Turning every 80 years or so. It fits well with Dalios data. Neil argues we are in the last half of that Fourth Turning, and he expects conditions to worsen from here. As he points out, for almost 500 years, the last half of Fourth Turning has always encompassed the most tumultuous times in Anglo-Saxon history.
(A Fourth Turning is a time when societys foundational institutions are challenged. The generation who are young adults at that time must face the challenge, and hopefully overcome it. The so-called Greatest Generation did so by persevering through the Great Depression and fighting World War II. It may not be a war, but Neil says the Millennial Generation will face a similarly consequential test.)
Back to Dalios article, he quantifies the 60/40 split with some startling numbers. Just a sampling:
- The average household in the top 40% earns four times more than the average household in the bottom 60%.
- Real incomes for the bottom 60% have been either flat or down slightly since 1980.
- In 1980, the average household in the top 40% had six times more wealth than the average household in the bottom 60%. Now, it is 10 times as much.
- Only about a third of the bottom 60% saves any of their income.
Dalio also found some very useful data: household income adjusted to show the impact of taxes, tax credits, and government benefits. This adjustment gets closer to the resources people actually have available for living expenses, savings, and investment. The Heritage Foundation has similar studies from a different perspective, but they generally agree.
Splitting that data by the top 40% and bottom 60%, we see a sharply growing difference in the percentage changes since 1980. The top saw its after-tax net household income grow almost three times faster than household income for the bottom 60%, even including government transfer payments.
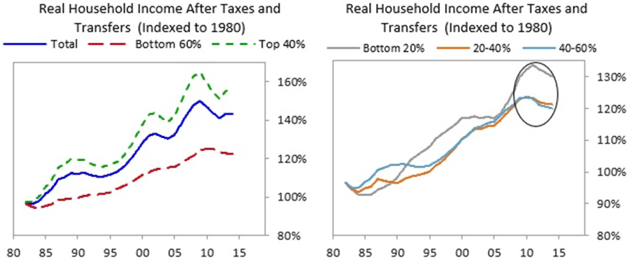
Source: Ray Dalio
And note something in the right-hand side of the chart, which depicts income changes for the bottom 60% only, divided into three segments. There is a significant difference in the income growth of the middle 4060% segment and the bottom 20%, and that difference accelerated during and after the Great Recession. Think about that in the context of recent political trends.
You see the problem here? The bottom 60% know their own experience. Thanks to the internet and social media, they are particularly aware of the gap and increasingly resentful.
Note also that the lower ranks of the top 40% are not wealthy by any stretch. Anyone below the 80th percentile is probably struggling to some degree. This Statista chart shows you need to make at least $75,000 a year to get into the top 40%. Maybe Im jaded, but I dont think $75,000 a year is wealthy. I can guarantee you that my friends in the $150,000 to $200,000 range may feel comfortable, but they certainly dont think of themselves as wealthy.
Dalio is right to compare the top 0.1% to the bottom 90%. That skew at the very top creates the illusion that there are a large number of extraordinarily wealthy people when in fact there are just a few. But if you throw Bill Gates or Warren Buffett into the demographic, you raise the average net worth significantly. Which is why average is so misleading.
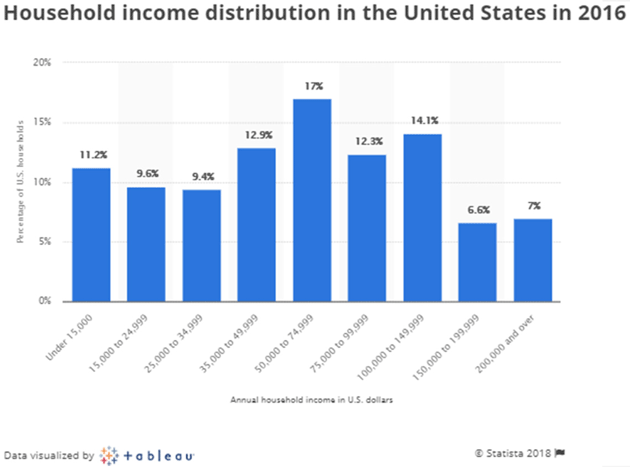
Source: Statista
Since the 1980s, most of us at the top have believed that a rising tide would lift all boats. We were half-right: It has lifted all the boats but not at the same rate, and many boats have sprung holes and are taking on water. Our differences in income and wealth are getting too great to ignore.
Think back 30 years. None of us would want to go back and live with the same technological base we had back then. All of our lives have dramatically improved. From health care to communications to entertainment to transportation and a host of other things, we are all better off in many ways
Nevertheless, and repeating myself, those in the bottom 20 or 40 or 60 or 80% notice the relative differences between where they are and where the top 10% or 1% reside, and they can see those differences growing.
While many in Africa, in some parts of Asia, and in the slums in Latin America would see the lives we call poor in the US as vastly superior to their own, that is not who the bottom 204060% of the US income strata are comparing their lives to. It is simply human nature that we compare ourselves to those who have more, and to want more for ourselves.
The American Psychological Association does an annual survey on Stress in America. Not surprisingly, the most recent one shows we are not happy campers.
A big majority (59%) think we are now at the lowest point in our nations history. To me, that seems a stretch, given that we killed each other in staggering numbers in the Civil War. And the crash of 1873 and its aftermath wasnt pretty. Neither was the Great Depression. But then, people didnt watch the fighting on their phones. Now we do, and it fills us with anxiety.
I look back on my youth and realize that the late 60s was the first time when the reality of war confronted my generation in our homes, on our TVs and in our newspapers, every day. Media coverage of social turmoil in that era was a harbinger of what the internet and social media have created today: instantaneous analysis of almost everything, much of it by people with no real understanding of the situation. Now, social media have become a monstrous breeding ground for conspiracy theories of all kinds. It is most disheartening.
The specific issues that worry people are interesting.
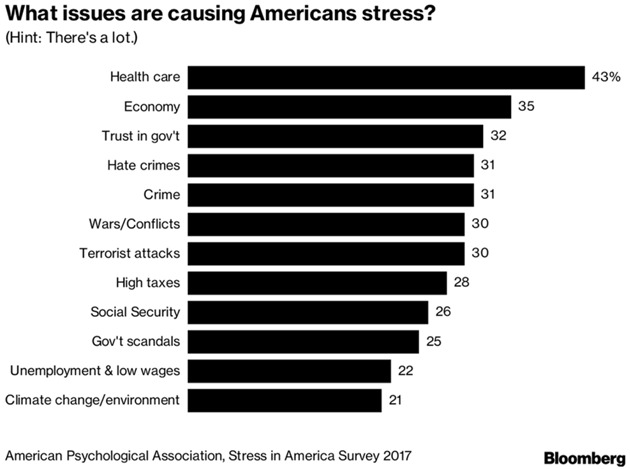
Source: American Psychological Association
First on the list is health care, by a pretty wide margin. That concern can cover a lot of territory. Maybe you or a family member are seriously ill, or maybe your health is fine but buying insurance causes financial stress.
Just over a third of respondents reported that the economy causes them stress. That seems a little low, but I remind myself that most people dont observe the economy the way I do. High taxes are well down the list, at 28%. Thats surprising but probably reflects the fact that a small number of people pay most of the income taxes.
Unemployment and low wages is also near the bottom with 22% of respondents stressed about it. Maybe that figure reflects todays low unemployment level, or maybe people are just glad to have any sort of job.
One source of considerable stress that isnt on the list but probably should be is household debt. I talk a lot about government debt and pension debt, but for most people, the more immediate concern is probably their mortgage, auto, credit-card, and student loan debt. There is a mountain of it.
Heres an interesting Deutsche Bank chart on that point.
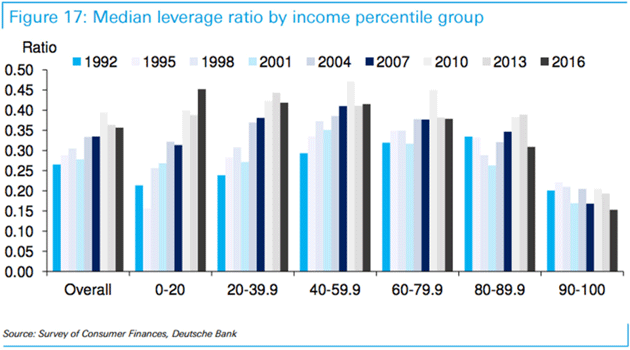
Source: Deutsche Bank
Here we see household leverage ratios spanning 19922016, broken down by income quintiles. Focus your attention on the 1992 (darker blue) and 2016 (rightmost black) bars. In that 24-year interval, leverage more than doubled for the lowest-income 20% and rose significantly for the lower-income 80% of the population. It dropped slightly for the 8089.9th percentiles and even dropped even more for the top 10% income group.
Now recall Dalios data on household income, adjusted for taxes and benefits. The top 20%, whose incomes grew the fastest, managed to reduce their leverage. The lower groups, whose income was up slightly or flat, added large amounts of debt, with the poorest adding the most, percentage-wise.
This data doesnt tell us what specific kinds of debt create these leverage ratios. Maybe some of the debt is productive, like mortgages on reasonably valued homes or student debt that helps borrowers eventually raise their incomes. But Id bet much of this borrowed money is simply gone, having bought little or nothing of lasting value.
This likely unrecoverable debt also appears as an asset on some lenders balance sheet. It ends up being sold as asset-backed securities, possibly to a mutual fund or pension fund near you. And its generally in the high-yield category, with leverage on it.
At the risk of repeating the obvious, debt that cant be repaid wont be. Somebody will eat the loss; the only question is who. Banks managed to socialize much of their losses in the last recession. Im not sure that plan will work a second time.
I started off talking about pain and how we distribute it. It may not be physical pain. Financial and employment-related pain are very real. Boredom, too, can be painful, as can loneliness or the feeling that no one needs you. Were on the verge of many medical breakthroughs, but we wont cure every disease or heal every kind of wound. People will still suffer, and its clear we need a lot of societal as well as personal healing.
We have long had this notion of the working class. These are the people who dont own businesses and are not professionals like doctors, lawyers, or accountants.
I have spent a great deal of time thinking about the future of work. It is the single most difficult chapter to write in my upcoming book, partly because I dont like the conclusions Im coming to. One thing I am realizing is there is a distinction between what we have seen as the working class and what I am coming to see as the service class.
A working-class person is somebody who has a trade, and because of that skill, can generally command a decent income.
The service classbar and restaurant workers, retail salespeople, general manual laborers, and so onis almost plug-and-play. It is not that the greedy restaurant owner doesnt want to pay his staff more; its that competition generally wont let him do so and still make a profit. So he holds his labor costs downand he can do so because in todays market, there are typically more people available for these jobs than there are jobs. And because of the Obamacare mandate, if you are a business with more than 50 employees, you simply cannot afford to have full-time employees, so you resort more and more to part-time positions, which dont let workers earn adequate wages.
We are increasingly a nation under stress. Dalio talks about it in terms of the bottom 60% versus the top 40%, but he could have made the same case using an 8020 model or even a 9010 model. I am reminded of Paretos 80/20 principle, which states that roughly 80% of effects come from 20% of causes.
Our socioeconomic situation is not going to improve for a long time. Lets assume, wildly optimistically, that the US economy and the rest of the developed world grow at a 5% nominal rate for the next 15 years, so that our economies roughly double. Will the gap between the lower 60% and the upper 40% grow even wider? We will have more than a few people worth more than $100 billion, thats for sure.
Will the lives of the lower 60% be significantly better than they are today? Absolutely. Theyll have improved health care and health spans (if they have access to health care), lower food costs, far more access to services, etc., but the relative differences will be even greater between the top and the bottom.
Unless we somehow figure out how to help people deal with their stress and better manage the yawning differences in incomes and outcomes, were going to see increasing tension and fragmentation in our society.
As I mentioned above, Im in Maine this weekend. This annual pilgrimage has become one of the highlights of my life. There are people that I have been fishing, talking, and drinking with for 13 years. Others drift in and out, and David Kotok always seems to have a fantastic mix of new friends. Some of my closest relationships and deepest economic insights, being tutored by some of the greatest minds in the world, have come on the lakes and at Leens Lodge at night.
And dear gods, what I learn from the Maine Guides. The county we are in is sometimes called the lowest-income area east of the Mississippi. Paper mills and other good jobs have been slowly closing down. People in the town tell us that this weekend is the areas biggest economic event of the year. In a way, that is quite sad for such a beautiful place. Kotok makes sure that our guides and the staff are well taken care of. He raises a lot of money for the local conservation trust, a very worthy cause.
In an odd sort of way, talking with the local guides makes me feel like Im back in West Texas. I see the same independence and fortitude. And while they are extraordinarily talented fishing guides, nearly all of them also trek backcountry for moose and bear hunting season, setting up camps for city slickers and doing generally hard labor. They do it for as long as their bodies can keep going. It helps that they love it, but it is one of the few ways to make money in that county. Talk about income disparity
. You can learn a few lessons there.
As I was writing this conclusion, I was interrupted by a conference call with my associates Olivier Garrett and Shannon Staton about SIC 2019. It is still over nine months away, but the planning we do now is what makes this the best economic event anywhere. The next SIC will be in Dallas, May 1316. Save the date. Olivier said I cant tell you who we already have lined up, but it is going to be a powerhouse conference. A few old names, but a lot of new ones. Im really excited and can barely wait. Stay tuned
It is time to hit the send button. Im finishing this on Tuesday, while still in Dallas. I get on a plane to Philadelphia very early tomorrow morning, where Ill have some meetings. Then I fly to Bangor and drive to Grand Lake Stream on Thursday morning.
I noticed on my American Airlines account that sometime soon I will have over eight million air miles. I think they must double-count the times I fly business class and so on. Not really sure how it works, as going over eight million miles gets you absolutely nothing. But I am just grateful that at almost 69, I can still look forward to getting on that next flight.
Have a great week!
Your sometimes feeling those miles analyst,


| John Mauldin
Chairman, Mauldin Economics |


