Leuthold Group has sounded the alarm on a valuation metric that shows the S&P 500 is twice as expensive as it was at the peak of the tech bubble.
This development could have large implications for stock investors of all types, particularly value traders who make their living by finding discounts in the market.
With the stock market within shouting distance of an all-time high, traders are readying their Champagne bottles.
Just dont tell them about the eye-popping statistic just published by the reputed research outfit Leuthold Group, lest you spoil their fun.
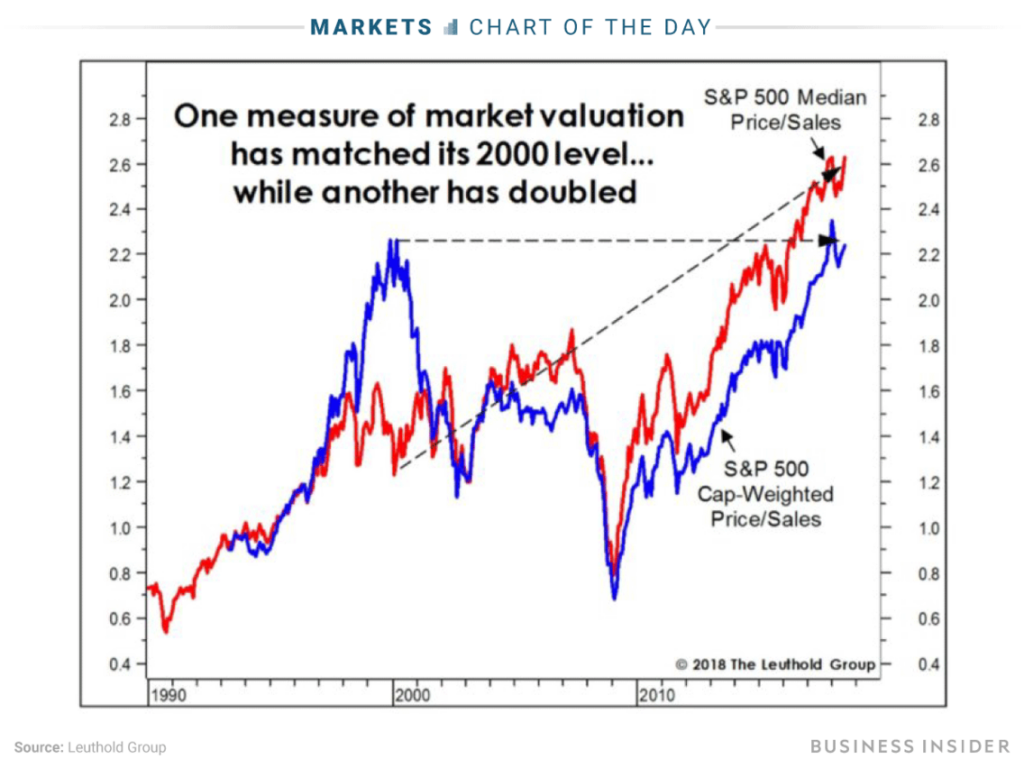
Leuthold has taken a fairly traditional valuation measure the price-to-sales ratio, or P/S and added a twist. Rather than take the market-cap-weighted P/S for the benchmark S&P 500 , the firm has calculated the median P/S for every company in the index.
And as you can see from the red line in the chart, the historical comparison is jarring. Going by the median P/S measure, the S&P 500 is actually twice as expensive as it was at the peak of the tech bubble.
Leuthold has already sounded the alarm in the past about the blue line, which is the market-cap-weighted version of the P/S metric. The firm previously considered it the scariest chart in our database but it now appears to be a distant No. 2.
The addition transforms an already alarming chart into one thats almost unfit for a family-friendly publication, Doug Ramsey, Leutholds chief investment officer, wrote in a client note. The nature of this markets overvaluation is very different than in 2000.
Its different in the sense that the overvaluation is more widespread and the implications of that fact are potentially devastating. When the stock market does face its next Armageddon stage, there will be nowhere to hide.
When the broader market got crushed in the dot-com era after the tech bubble burst, that was largely because of the massive concentration of positions in the sector. Traders couldve theoretically protected themselves by hiding in more fairly valued industries. Investors today have no such luxury.
Overvaluation in 2000 was highly concentrated, Ramsey said. Today it is pervasive.
The lack of comparatively cheap opportunities in the market is a particularly troublesome development for so-called value investors, who are left searching for bargains that simply dont exist.
In a more concentrated market, value investors could position themselves to outperform by patiently waiting in cheaper areas for the more crowded, pricy segments to collapse. With no inexpensive areas to speak of, that strategy becomes much more difficult.
This breadth of overvaluation certainly helps explain todays level of despondence among value managers, Ramsey said. The long period of penance has not rewarded them with any truly cheap pockets of the stock market like it did in 1999 and 2000. They still stand to lose serious money in the next bear market, but their results should be much better than the throngs whove decided to put their equity investing on auto-pilot.
Trump Trade and Currency Wars With China Goldnomics Podcast
The content on this site is protected
by U.S. and international copyright laws and is the property of GoldSeek.com
and/or the providers of the content under license. By "content" we mean any
information, mode of expression, or other materials and services found on GoldSeek.com.
This includes editorials, news, our writings, graphics, and any and all other
features found on the site. Please contact
us for any further information.
Live GoldSeek Visitor Map | Disclaimer
The views contained here may not represent the views of GoldSeek.com, Gold Seek LLC, its affiliates or advertisers. GoldSeek.com, Gold Seek LLC makes no representation, warranty or guarantee as to the accuracy
or completeness of the information (including news, editorials, prices, statistics,
analyses and the like) provided through its service. Any copying, reproduction
and/or redistribution of any of the documents, data, content or materials contained
on or within this website, without the express written consent of GoldSeek.com, Gold Seek LLC,
is strictly prohibited. In no event shall GoldSeek.com, Gold Seek LLC or its affiliates be
liable to any person for any decision made or action taken in reliance upon
the information provided herein.