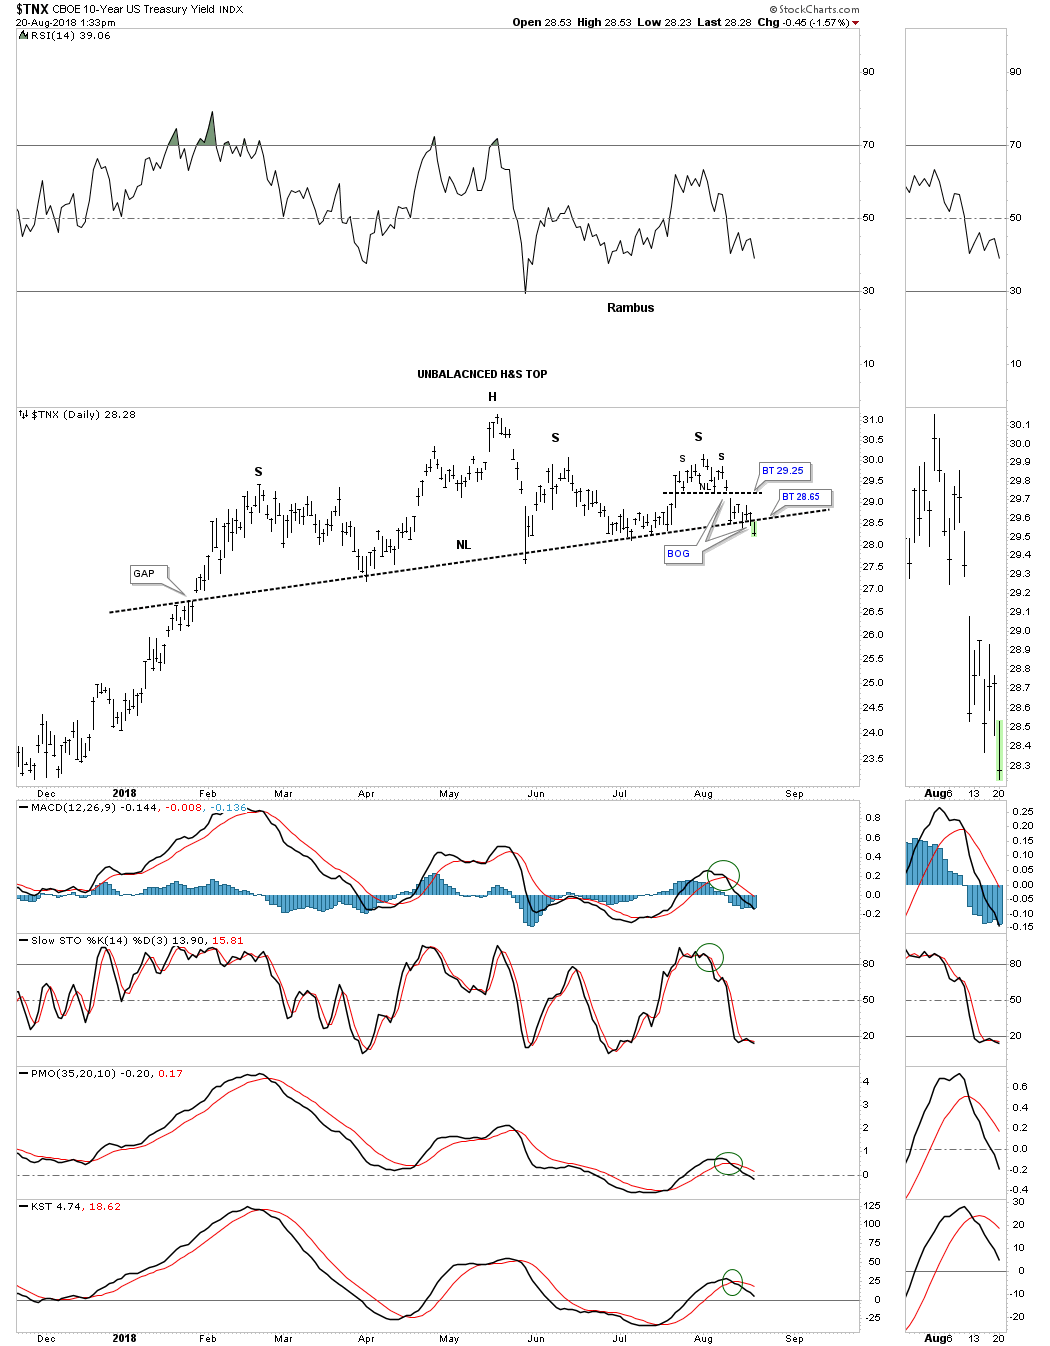
LIVE Gold Prices $  | E-Mail Subscriptions | Update GoldSeek | GoldSeek Radio 

Commentary : Gold Review : Markets : News Wire : Quotes : Silver : Stocks - Main Page 

 GoldSeek.com >> News >> Story  Disclaimer 
 
Latest Headlines

GoldSeek.com to Launch New Website
By: GoldSeek.com

Is Gold Price Action Warning Of Imminent Monetary Collapse Part 2?
By: Hubert Moolman

Gold and Silver Are Just Getting Started
By: Frank Holmes, US Funds

Silver Makes High Wave Candle at Target – Here’s What to Expect…
By: Clive Maund

Gold Blows Through Upside Resistance - The Chase Is On
By: Avi Gilburt

U.S. Mint To Reduce Gold & Silver Eagle Production Over The Next 12-18 Months
By: Steve St. Angelo, SRSrocco Report

Gold's sharp rise throws Financial Times into an erroneous sulk
By: Chris Powell, GATA

Precious Metals Update Video: Gold's unusual strength
By: Ira Epstein

Asian Metals Market Update: July-29-2020
By: Chintan Karnani, Insignia Consultants

Gold's rise is a 'mystery' because journalism always fails to pursue it
By: Chris Powell, GATA

 
Search

GoldSeek Web

 
$TNX: Curveball Update


 -- Published: Tuesday, 21 August 2018 | Print  | Disqus 

By Rambus

Over the last several months or so I’ve been writing about the bond market throwing us a possible curveball. Instead of continuing rising interest rate we may see falling rates. Today the $TNX, 10 year treasury yield finally broke below the neckline we’ve been following that started to developing back in January of this year. I’ve labeled the H&S top as an unbalanced H&S top as the price action formed a second right shoulder that was a small H&S top. A backtest to the neckline would now come into play around the 28.65 area.

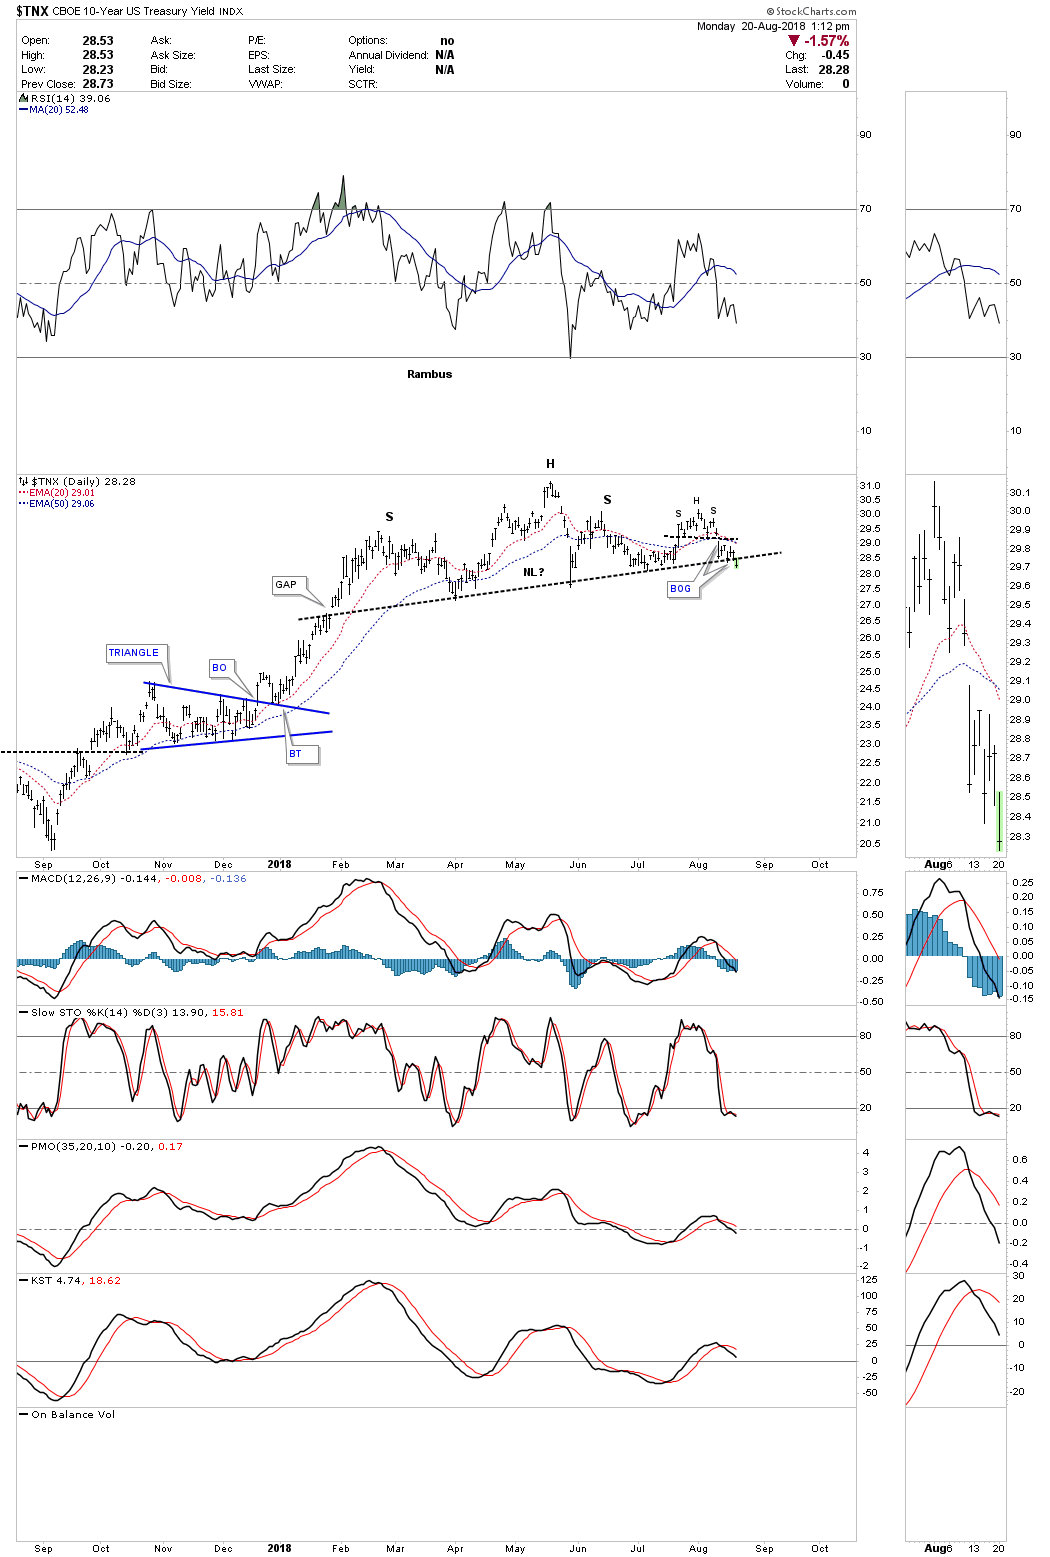
A longer term daily chart.

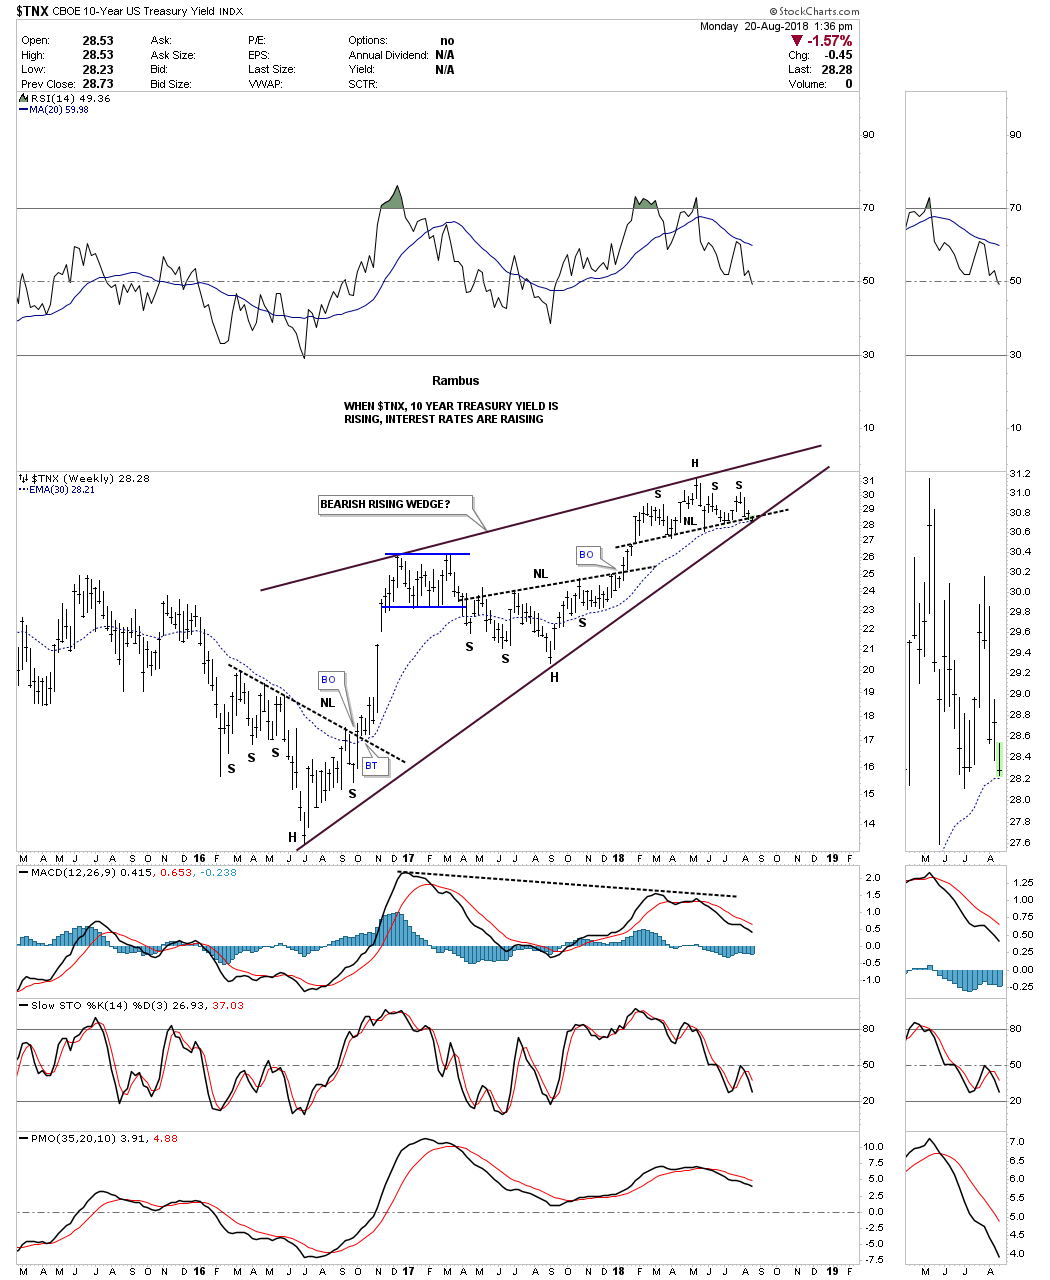
The weekly chart shows the $TNX has been rising for the last two years building out a possible bearish rising wedge with the H&S top forming at the top. That H&S top is strongly suggesting the bottom rail of the black rising wedge is going to give way to the downside. The curveball has almost reached home plate.

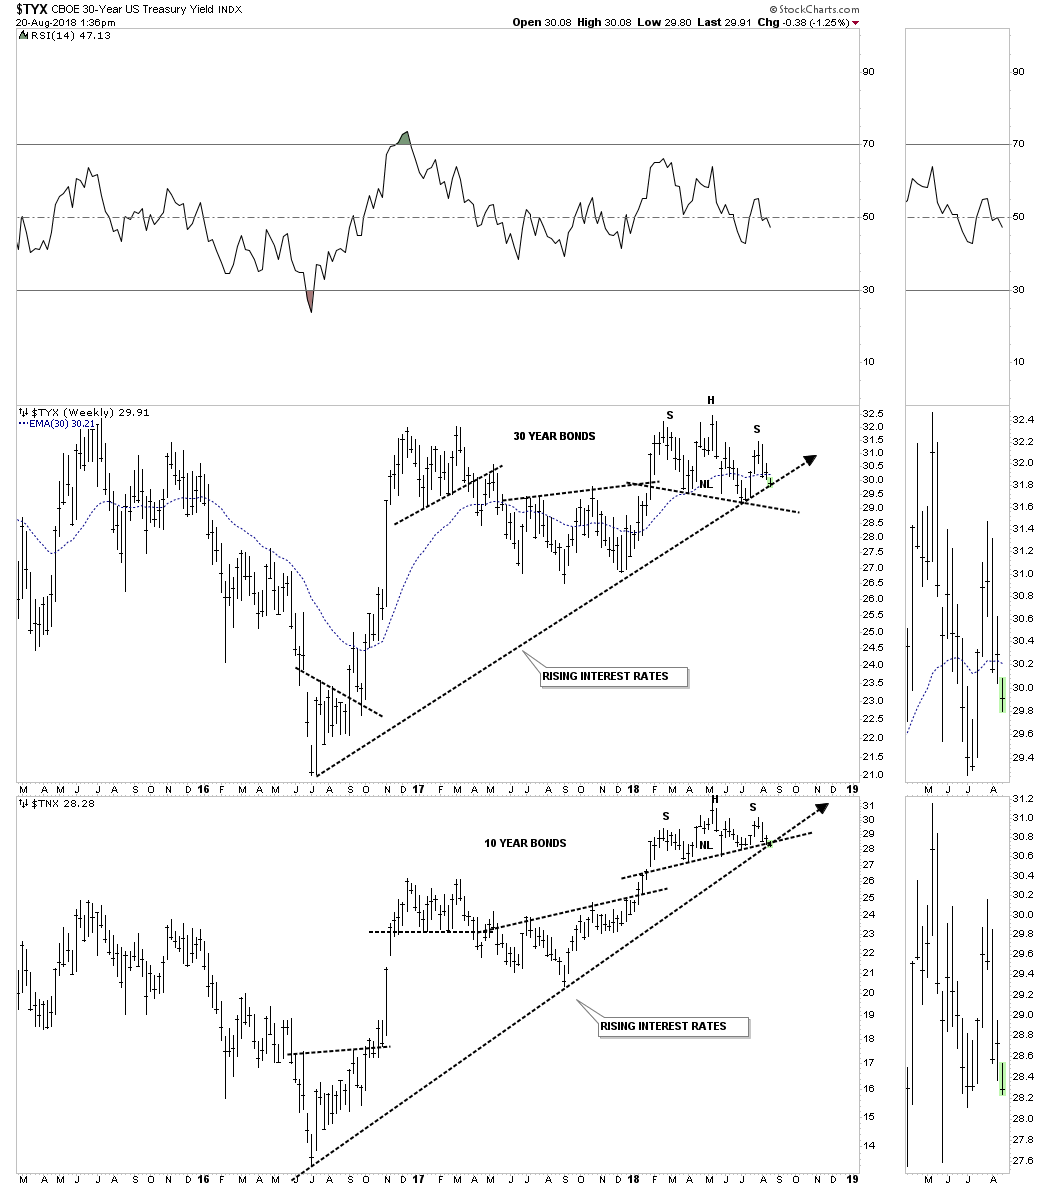
Below is a combo chart which has the $TYX, 30 year bond on top and the $TNX 10 year bond on the bottom.

https://rambus1.com/


| Digg This Article
 -- Published: Tuesday, 21 August 2018 | E-Mail  | Print  | Source: GoldSeek.com

comments powered by Disqus


Increase Text SizeDecrease Text SizeE-mail Link of Current PagePrinter Friendly PageReturn to GoldSeek.com

 news.goldseek.com >> Story

E-mail Page  | Print  | Disclaimer 


© 1995 - 2019


GoldSeek.com Supports Kiva.org

© GoldSeek.com, Gold Seek LLC

The content on this site is protected by U.S. and international copyright laws and is the property of GoldSeek.com and/or the providers of the content under license. By "content" we mean any information, mode of expression, or other materials and services found on GoldSeek.com. This includes editorials, news, our writings, graphics, and any and all other features found on the site. Please contact us for any further information.

Live GoldSeek Visitor Map | Disclaimer


Map

The views contained here may not represent the views of GoldSeek.com, Gold Seek LLC, its affiliates or advertisers. GoldSeek.com, Gold Seek LLC makes no representation, warranty or guarantee as to the accuracy or completeness of the information (including news, editorials, prices, statistics, analyses and the like) provided through its service. Any copying, reproduction and/or redistribution of any of the documents, data, content or materials contained on or within this website, without the express written consent of GoldSeek.com, Gold Seek LLC, is strictly prohibited. In no event shall GoldSeek.com, Gold Seek LLC or its affiliates be liable to any person for any decision made or action taken in reliance upon the information provided herein.